

A Whole-Tumor Histogram Analysis of Apparent Diffusion Coefficient Maps for Differentiating Thymic Carcinoma from Lymphoma
- PMID: 29520195
- PMCID: PMC5840066
- DOI: 10.3348/kjr.2018.19.2.358
A Whole-Tumor Histogram Analysis of Apparent Diffusion Coefficient Maps for Differentiating Thymic Carcinoma from Lymphoma
Abstract
Objective: To assess the performance of a whole-tumor histogram analysis of apparent diffusion coefficient (ADC) maps in differentiating thymic carcinoma from lymphoma, and compare it with that of a commonly used hot-spot region-of-interest (ROI)-based ADC measurement.
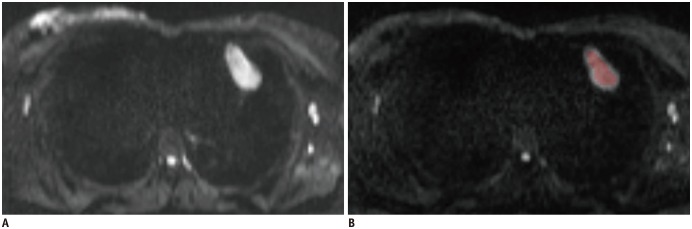
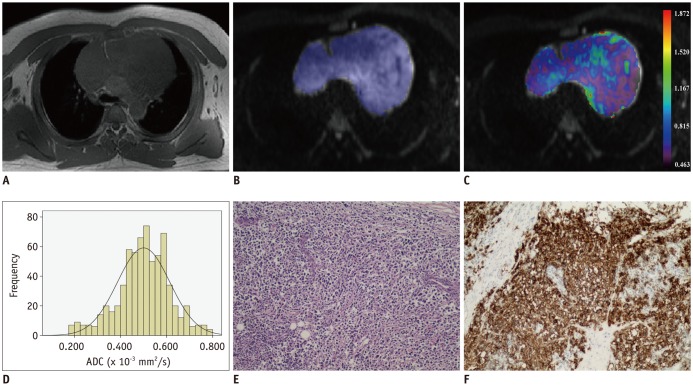
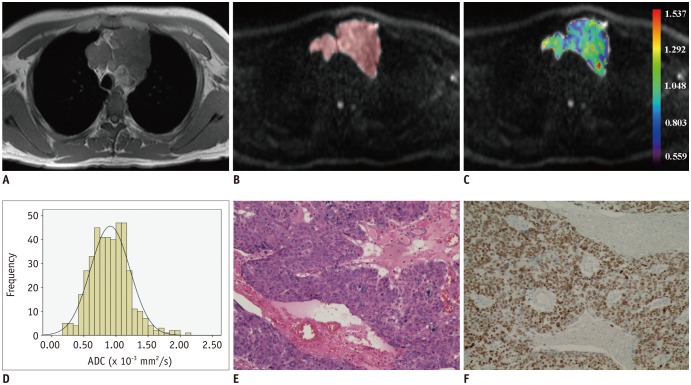
Materials and methods: Diffusion weighted imaging data of 15 patients with thymic carcinoma and 13 patients with lymphoma were retrospectively collected and processed with a mono-exponential model. ADC measurements were performed by using a histogram-based and hot-spot-ROI-based approach. In the histogram-based approach, the following parameters were generated: mean ADC (ADCmean), median ADC (ADCmedian), 10th and 90th percentile of ADC (ADC10 and ADC90), kurtosis, and skewness. The difference in ADCs between thymic carcinoma and lymphoma was compared using a t test. Receiver operating characteristic analyses were conducted to determine and compare the differentiating performance of ADCs.
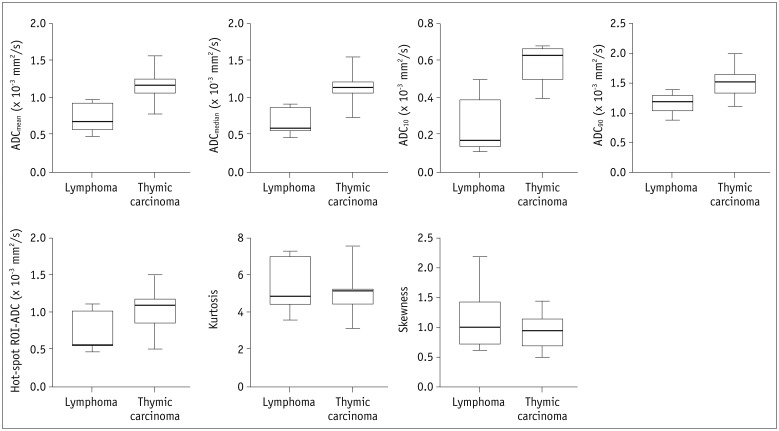
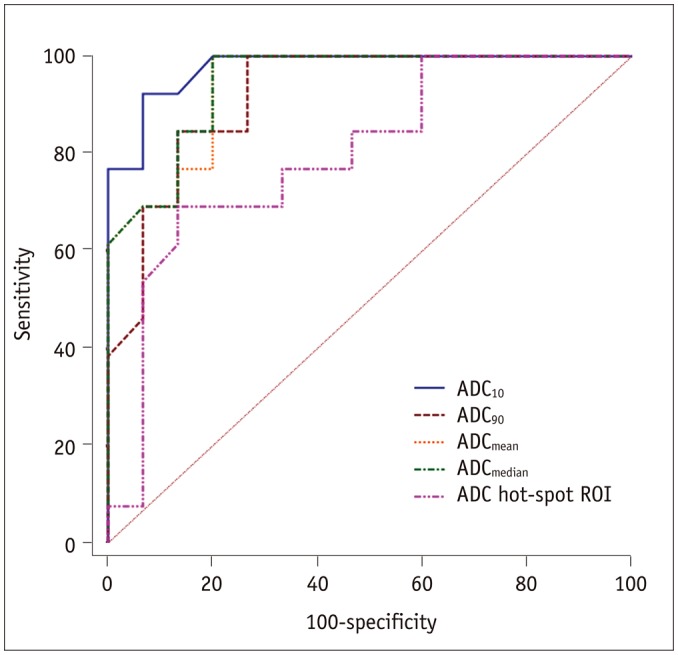
Results: Lymphoma demonstrated significantly lower ADCmean, ADCmedian, ADC10, ADC90, and hot-spot-ROI-based mean ADC than those found in thymic carcinoma (all p values < 0.05). There were no differences found in the kurtosis (p = 0.412) and skewness (p = 0.273). The ADC10 demonstrated optimal differentiating performance (cut-off value, 0.403 × 10⁻³ mm2/s; area under the receiver operating characteristic curve [AUC], 0.977; sensitivity, 92.3%; specificity, 93.3%), followed by the ADCmean, ADCmedian, ADC90, and hot-spot-ROI-based mean ADC. The AUC of ADC10 was significantly higher than that of the hot spot ROI based ADC (0.977 vs. 0.797, p = 0.036).
Conclusion: Compared with the commonly used hot spot ROI based ADC measurement, a histogram analysis of ADC maps can improve the differentiating performance between thymic carcinoma and lymphoma.
Keywords: Apparent diffusion coefficient; Diffusion weighted imaging; Histogram analysis; Lymphoma; Mediastinal mass; Thymic carcinoma.
Figures
Similar articles
-
Histogram analysis of apparent diffusion coefficient maps for assessing thymic epithelial tumours: correlation with world health organization classification and clinical staging.Br J Radiol. 2018 Apr;91(1084):20170580. doi: 10.1259/bjr.20170580. Epub 2018 Jan 10. Br J Radiol. 2018. PMID: 29260882 Free PMC article.
-
Radiological indeterminate vestibular schwannoma and meningioma in cerebellopontine angle area: differentiating using whole-tumor histogram analysis of apparent diffusion coefficient.Int J Neurosci. 2017 Feb;127(2):183-190. doi: 10.3109/00207454.2016.1164157. Epub 2016 Apr 6. Int J Neurosci. 2017. PMID: 26961388
-
Histogram analysis of apparent diffusion coefficient maps for differentiating malignant from benign parotid gland tumors.Eur Arch Otorhinolaryngol. 2018 Aug;275(8):2151-2157. doi: 10.1007/s00405-018-5052-y. Epub 2018 Jul 2. Eur Arch Otorhinolaryngol. 2018. PMID: 29961924
-
Application of Apparent Diffusion Coefficient Histogram Metrics for Differentiation of Pediatric Posterior Fossa Tumors : A Large Retrospective Study and Brief Review of Literature.Clin Neuroradiol. 2022 Dec;32(4):1097-1108. doi: 10.1007/s00062-022-01179-6. Epub 2022 Jun 8. Clin Neuroradiol. 2022. PMID: 35674799 Review.
-
Diagnostic performance of whole-lesion apparent diffusion coefficient histogram analysis metrics for differentiating benign and malignant breast lesions: a systematic review and diagnostic meta-analysis.Acta Radiol. 2020 Sep;61(9):1165-1175. doi: 10.1177/0284185119896520. Epub 2020 Jan 10. Acta Radiol. 2020. PMID: 31924104
Cited by
-
The impact of radiomics in predicting oncologic behavior of thymic epithelial tumors.Mediastinum. 2019 Jun 21;3:27. doi: 10.21037/med.2019.06.03. eCollection 2019. Mediastinum. 2019. PMID: 35118255 Free PMC article. No abstract available.
-
Anterior mediastinal lesions: CT and MRI features and differential diagnosis.Jpn J Radiol. 2021 Feb;39(2):101-117. doi: 10.1007/s11604-020-01031-2. Epub 2020 Sep 2. Jpn J Radiol. 2021. PMID: 32880074 Review.
-
Quantitative texture analysis based on dynamic contrast enhanced MRI for differential diagnosis between primary thymic lymphoma from thymic carcinoma.Sci Rep. 2022 Jul 24;12(1):12629. doi: 10.1038/s41598-022-16393-y. Sci Rep. 2022. PMID: 35871647 Free PMC article.
-
Histogram analysis from stretched exponential model on diffusion-weighted imaging: evaluation of clinically significant prostate cancer.Br J Radiol. 2020 Feb 1;93(1106):20190757. doi: 10.1259/bjr.20190757. Epub 2020 Jan 9. Br J Radiol. 2020. PMID: 31899654 Free PMC article.
-
Quantitative Thoracic Magnetic Resonance Criteria for the Differentiation of Cysts from Solid Masses in the Anterior Mediastinum.Korean J Radiol. 2019 May;20(5):854-861. doi: 10.3348/kjr.2018.0699. Korean J Radiol. 2019. PMID: 30993936 Free PMC article.
References
-
- Azizad S, Sannananja B, Restrepo CS. Solid tumors of the mediastinum in adults. Semin Ultrasound CT MR. 2016;37:196–211. - PubMed
-
- Piña-Oviedo S, Moran CA. Primary mediastinal classical hodgkin lymphoma. Adv Anat Pathol. 2016;23:285–309. - PubMed
-
- Abdel Razek AA, Soliman N, Elashery R. Apparent diffusion coefficient values of mediastinal masses in children. Eur J Radiol. 2012;81:1311–1314. - PubMed
-
- DeLong ER, DeLong DM, Clarke-Pearson DL. Comparing the areas under two or more correlated receiver operating characteristic curves: a nonparametric approach. Biometrics. 1988;44:837–845. - PubMed
MeSH terms
LinkOut - more resources
Full Text Sources
Other Literature Sources
Medical
