. 2018 Feb 22:11:53.
doi: 10.3389/fnmol.2018.00053. eCollection 2018.

α-Synuclein Heterocomplexes with β-Amyloid Are Increased in Red Blood Cells of Parkinson's Disease Patients and Correlate with Disease Severity

Affiliations

α-Synuclein Heterocomplexes with β-Amyloid Are Increased in Red Blood Cells of Parkinson's Disease Patients and Correlate with Disease Severity

Simona Daniele et al. Front Mol Neurosci. .

Abstract

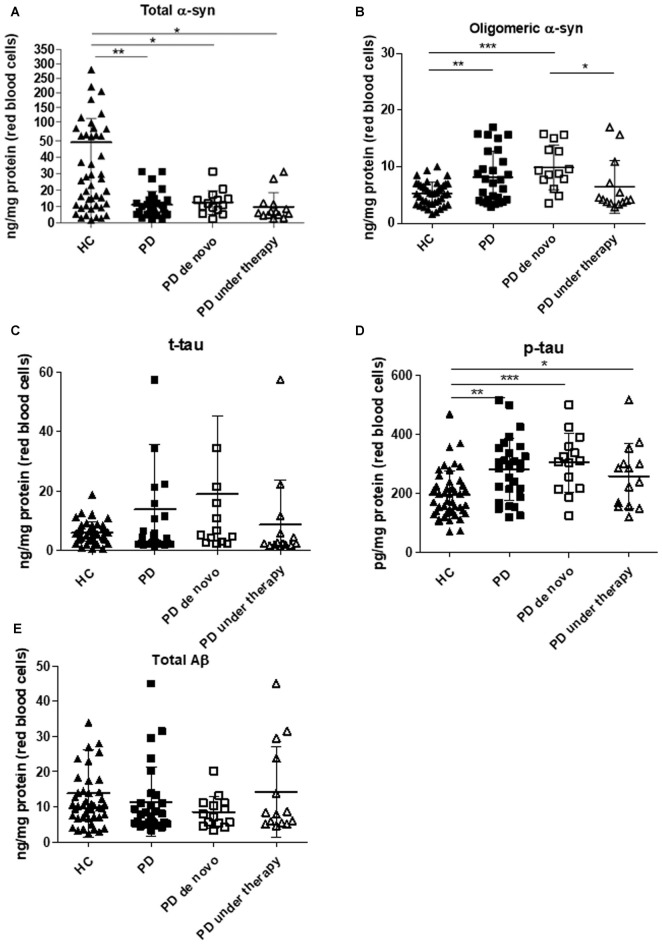
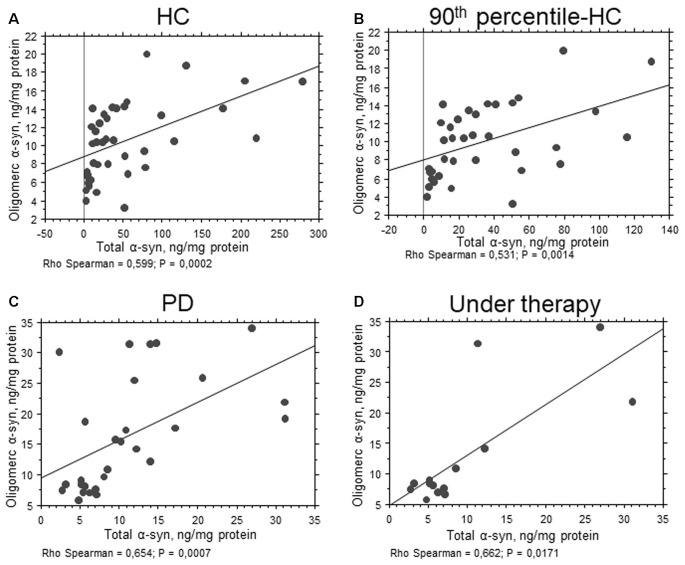
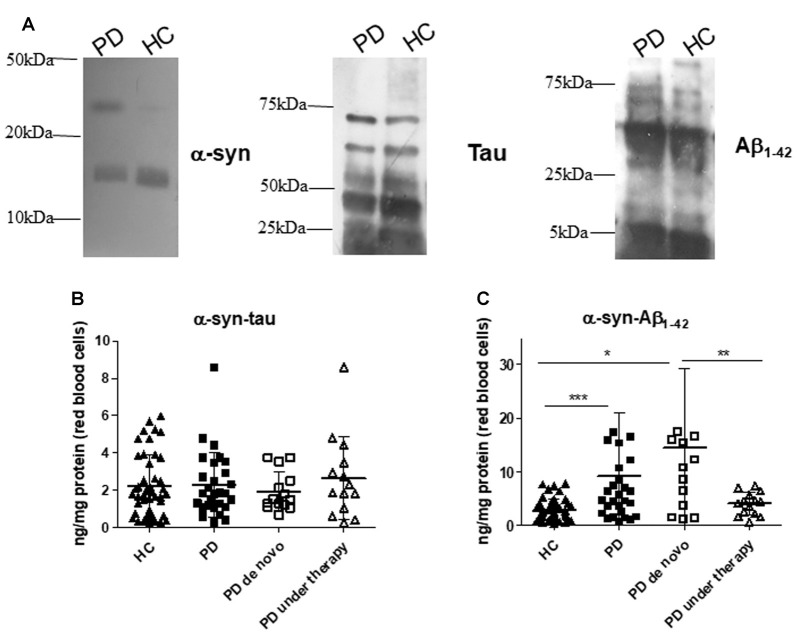
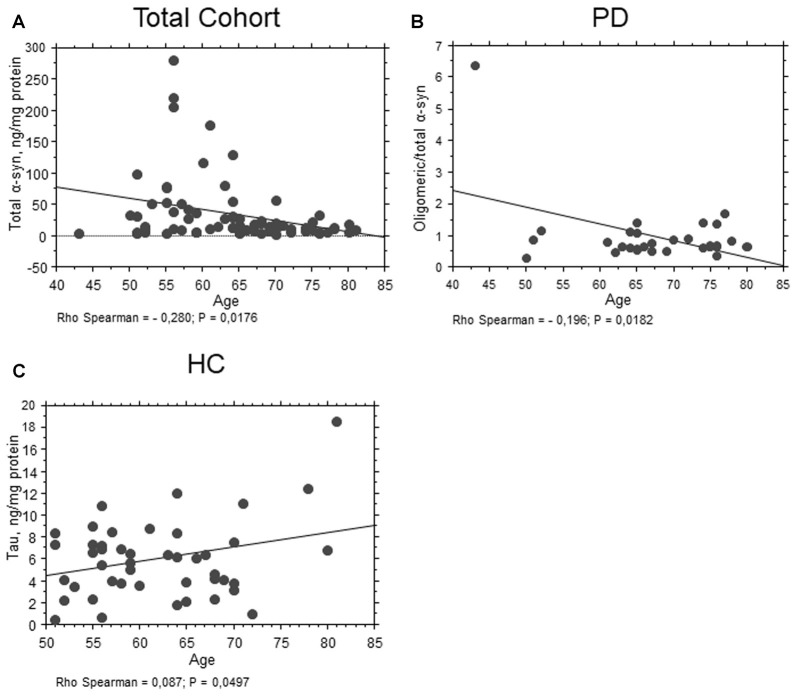
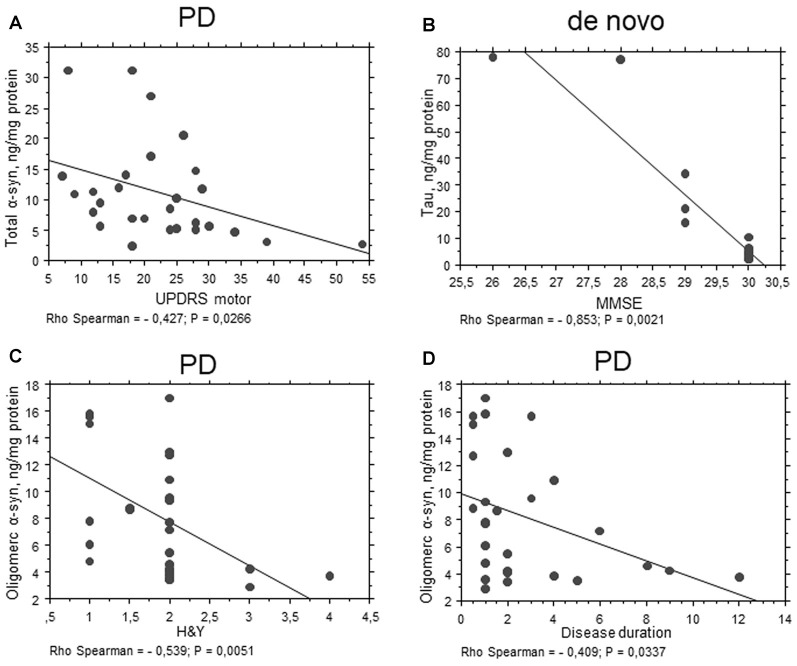
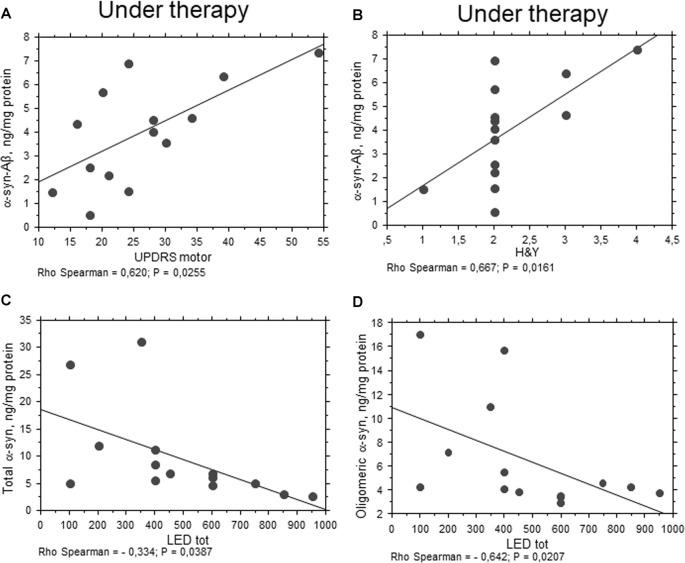
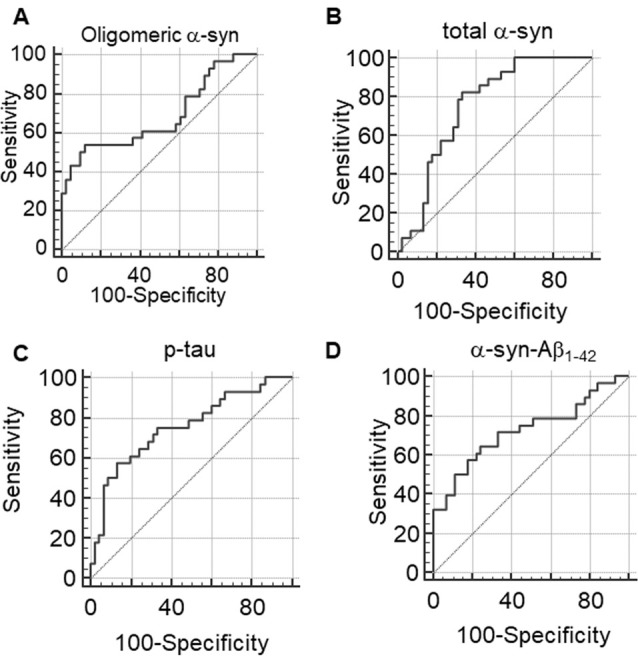
Neurodegenerative disorders (NDs) are characterized by abnormal accumulation/misfolding of specific proteins, primarily α-synuclein (α-syn), β-amyloid1-42 (Aβ1-42) and tau, in both brain and peripheral tissues. In addition to oligomers, the role of the interactions of α-syn with Aβ or tau has gradually emerged. Nevertheless, despite intensive research, NDs have no accepted peripheral markers for biochemical diagnosis. In this respect, Red Blood Cells (RBCs) are emerging as a valid peripheral model for the study of aging-related pathologies. Herein, a small cohort (N = 28) of patients affected by Parkinson's disease (PD) and age-matched controls were enrolled to detect the content of α-syn (total and oligomeric), Aβ1-42 and tau (total and phosphorylated) in RBCs. Moreover, the presence of α-syn association with tau and Aβ1-42 was explored by co-immunoprecipitation/western blotting in the same cells, and quantitatively confirmed by immunoenzymatic assays. For the first time, PD patients were demonstrated to exhibit α-syn heterocomplexes with Aβ1-42 and tau in peripheral tissues; interestingly, α-syn-Aβ1-42 concentrations were increased in PD subjects with respect to healthy controls (HC), and directly correlated with disease severity and motor deficits. Moreover, total-α-syn levels were decreased in PD subjects and inversely related to their motor deficits. Finally, an increase of oligomeric-α-syn and phosphorylated-tau was observed in RBCs of the enrolled patients. The combination of three parameters (total-α-syn, phosphorylated-tau and α-syn-Aβ1-42 concentrations) provided the best fitting predictive index for discriminating PD patients from controls. Nevertheless further investigations should be required, overall, these data suggest α-syn hetero-aggregates in RBCs as a putative tool for the diagnosis of PD.

Keywords: Parkinson’s disease; neurodegenerative disorders; tau; α-synuclein; α-synuclein heterocomplexes; β-amyloid.


Figures

Figure 1
Figure 1
Immunoassay determinations in Red Blood Cells (RBCs) of Parkinson’s disease (PD) patients and healthy controls (HC). (A–E) RBC levels of total (A) and oligomeric (B) α-synuclein (α-syn), total tau (C), p-tau (D) and Aβ1–42 (E) in the cohort of PD patients (de novo or under therapy) and HC (mean ± SD). Lysates obtained from RBCs were subjected to specific immunoassays, as described in the “Materials and Methods” section. Differences between groups—HC group, PD de novo subgroup, and PD under treatment subgroup—were evaluated by a non-parametric analysis (Kruskal Wallis): *P < 0.05, **P < 0.01, ***P < 0.001 vs. HC.
Figure 2
Figure 2
Correlation between total and oligomeric α-syn in RBCs. (A–D) Correlation analysis between total and oligomeric α-syn concentrations in RBCs of HC (A), 90th percentile-HC (B), PD (C) and PD under therapy (D). Correlations were determined using a Spearman analysis. A regression line was shown for representative purpose.
Figure 3
Figure 3
α-syn heterocomplexes with tau and Aβ1–42 in RBCs. (A) Cell lysates obtained from RBCs of HC and PD patients were immunoprecipitated with an anti-α-syn antibody, and then immunoblotted with antibody to α-syn, Aβ1–42 or tau. One representative Western blot is presented for each condition. (B,C) RBC levels of α-syn-tau (B) or α-syn-Aβ1–42 (C) and in the cohort of PD patients (de novo or under therapy) and HC (mean ± SD). Lysates obtained from RBCs were subjected to specific immunoassays, as described in the “Materials and Methods” section. Differences between groups—HC group, PD de novo subgroup, and PD under treatment subgroup—were evaluated by a non-parametric analysis (Kruskal Wallis): *P < 0.05, **P < 0.01, ***P < 0.001 vs. HC.
Figure 4
Figure 4
Correlation between RBC proteins and age. (A) Correlation analysis between age and total α-syn concentrations in RBCs of the total population. (B) Correlation analysis between oligomeric/total α-syn concentrations of PD patients and age. (C) Correlation analysis between age and total tau concentrations in RBCs of HC. Correlations were determined using a Spearman analysis. A regression line was shown for representative purpose.
Figure 5
Figure 5
Correlation between RBC proteins and clinical scales in PD patients. (A–D) Correlation analysis between Unified Parkinson’s Disease Rating Scale (UPDRS) motor (A), mini mental state examination (MMSE) (B), H&Y (C) scores or disease duration (D) and the levels of the indicated proteins in RBCs of PD patients (total cohort or de novo). Correlations were determined using a Spearman analysis. A regression line was shown for representative purpose.
Figure 6
Figure 6
Correlation between RBC proteins and pharmacological treatment in PD patients. (A,B) Correlation between UPDRS motor (A) or H&Y (B) scores and the levels of the indicated proteins in RBCs of PD patients under therapy. (C,D) Correlation analysis between the concentrations of the indicated proteins and levodopa equivalent dose (LED). Correlations were determined using a Spearman analysis. A regression line was shown for representative purpose.
Figure 7
Figure 7
(A–D) Receiver Operating Characteristic (ROC) curves to evaluate the utility of RBC concentrations of oligomeric α-syn (A), total α-syn (B), p-tau (C) or α-syn-Aβ1–42 (D) in discriminating PD patients from HC.

Similar articles

Cited by

References

    1. Abd-Elhadi S., Honig A., Simhi-Haham D., Schechter M., Linetsky E., Ben-Hur T., et al. . (2015). Total and proteinase K-resistant α-synuclein levels in erythrocytes, determined by their ability to bind phospholipids, associate with Parkinson’s disease. Sci. Rep. 5:11120. 10.1038/srep11120 - DOI - PMC - PubMed
    1. Alemayehu D., Zou K. H. (2012). Applications of ROC analysis in medical research: recent developments and future directions. Acad. Radiol. 19, 1457–1464. 10.1016/j.acra.2012.09.006 - DOI - PubMed
    1. Alves G., Brønnick K., Aarsland D., Blennow K., Zetterberg H., Ballard C., et al. . (2010). CSF amyloid-β and tau proteins and cognitive performance, in early and untreated Parkinson’s disease: the Norwegian ParkWest study. J. Neurol. Neurosurg. Psychiatry 81, 1080–1086. 10.1136/jnnp.2009.199950 - DOI - PubMed
    1. Alves G., Lange J., Blennow K., Zetterberg H., Andreasson U., Førland M. G., et al. . (2014). CSF Aβ42 predicts early-onset dementia in Parkinson disease. Neurology 82, 1784–1790. 10.1212/WNL.0000000000000425 - DOI - PubMed
    1. Andersen A. D., Binzer M., Stenager E., Gramsbergen J. B. (2017). Cerebrospinal fluid biomarkers for Parkinson’s disease—a systematic review. Acta Neurol. Scand. 135, 34–56. 10.1111/ane.12590 - DOI - PubMed