. 2018 Feb 22:12:12.
doi: 10.3389/fnana.2018.00012. eCollection 2018.

Topographic Organization of Hippocampal Inputs to the Anterior Olfactory Nucleus

Affiliations

Topographic Organization of Hippocampal Inputs to the Anterior Olfactory Nucleus

Afif J Aqrabawi et al. Front Neuroanat. .

Abstract

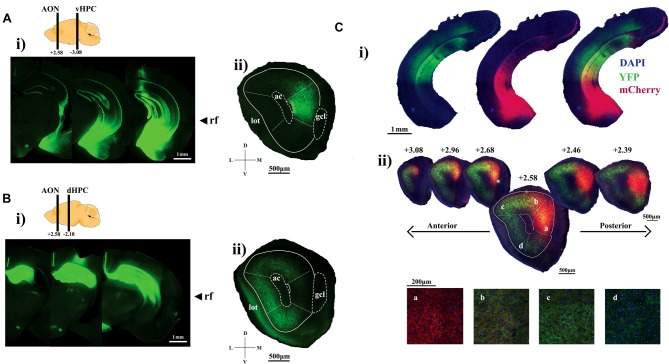
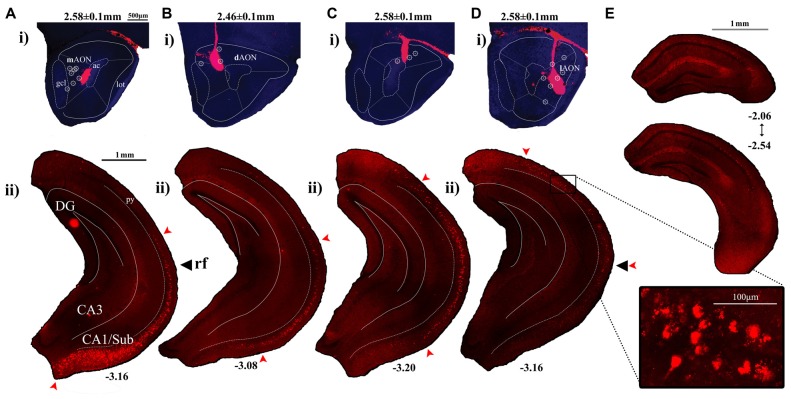
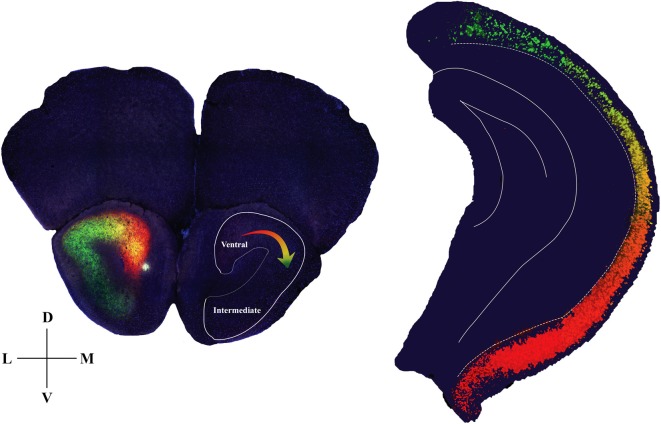
Top-down processes conveying contextual information play a major role in shaping odor representations within the olfactory system, yet the underlying mechanisms are poorly understood. The hippocampus (HPC) is a major source of olfactory top-down modulation, providing direct excitatory inputs to the anterior olfactory nucleus (AON). However, HPC-AON projections remain uncharacterized. In an effort to understand how hippocampal inputs are distributed within the AON, we systematically outlined their organization using anterograde and retrograde tracing methods. We found that AON-projecting hippocampal pyramidal neurons are located mostly in the ventral two-thirds of the HPC and are organized topographically such that cells with a ventral to intermediate hippocampal point of origin terminate, respectively, at the medial to lateral AON. Our neuroanatomical findings suggest a potential role for the HPC in the early processing and contextualization of odors which merits further investigation.

Keywords: AON; CA1; anterograde; hippocampus; olfaction; retrograde; topography; tracing.


Figures

Figure 1
Figure 1
Visualizing hippocampal projection fibers at the anterior olfactory nucleus (AON). (Ai) Representative sections showing channelrhodopsin-2 (ChR2)-YFP expression within the ventral hippocampus (HPC). (ii) AON section illustrating ChR2-YFP-positive ventral HPC axon terminals tightly contained within the medial aspect. (Bi) Representative sections showing ChR2-YFP expression throughout the dorsal HPC. (ii) ChR2-YFP-positive dorsal HPC axon terminals preferentially target the dorsal, lateral and ventral parts of the AON. (Ci) AAV2/5-mediated expression of ChR2-YFP and ChR2-mCherry into the dorsal and ventral CA1, respectively. (ii) Representative sections of the AON illustrating hippocampal terminals forming a gradient as a result of partially overlapping patterns of ChR2-mCherry and YFP-positive axon terminals. Panels (a–d) represent confocal images of axon terminals found at the corresponding areas within the AON. The relative ratio of ChR2-mCherry and YFP-positive terminals gradually shifts along the medial to lateral aspects of the AON. Included are cartoon diagrams to illustrate A/P position of hippocampal terminals (left bar) and injection site (right bar) along with A/P coordinates relative to Bregma and arrows to indicate the longitudinal position of the rhinal fissure (rf). Ac, anterior commissure; lot, lateral olfactory tract; gcl, granule cell layer of the olfactory bulb (OB).
Figure 2
Figure 2
Labeling patterns observed in the CA1 following injections of red fluorescent retrobeads into the AON. (Ai–Di) Representative sections depicting retrobead injection sites at the AON and the resulting cell body labeling patterns within the HPC. Included are AP coordinates to indicate position of coronal sections relative to Bregma and arrows to indicate the longitudinal position of the rf. The superimposed symbol (۞) indicates central positions of the injection sites which have yielded similar labeling patterns. (Aii) Retrobead injections restricted to the medial aspect of the AON produced labeled cell bodies found in the ventral-most CA1/Subiculum, decreasing in a gradient which ends at the level of the rf. (Bii) Injections delivered into the dorsomedial region of the AON resulted in labeled cell bodies found at their greatest density along more dorsal positions within the intermediate CA1. Few labeled cells were observed in the ventral-most CA1/Subiculum. (Cii) Injections into the dorsal AON resulted in retrobead-labeled cell bodies at the level of the rf, decreasing in number towards both dorsal and ventral directions. (Dii) Injections which targeted further lateral positions within the AON resulted in labeled cell bodies found at their greatest density in the intermediate CA1, decreasing in numbers towards the ventral CA1. The boxed region depicts a confocal image of retrobead-labeled pyramidal cells captured using a 20× objective. (E) Dorsal hippocampal coronal sections indicate the range of AP positions relative to Bregma where cell bodies were first identified following injections into the lateral AON.
Figure 3
Figure 3
Quantification of retrobead-labeled cells in the HPC. Data illustrates average density of retrobead-labeled cells within different subregions of the CA1. Injections of retrobeads into the mAON produced the greatest density of labeled cells in the ventral HPC (302.7 ± 23.3 cells/mm2) with fewer cells present in the intermediate HPC (29.3 ± 2.0 cells/mm2). In contrast, dAON retrobead injections resulted in a greater density of cells in the intermediate HPC (72.7 ± 4.3 cells/mm2) than the ventral HPC (36.9 ± 2.6 cells/mm2). Injections in the lAON labeled cells found predominantly in the intermediate HPC (39.7 ± 3.3 cells/mm2) with virtually none found in the ventral (0.89 ± 0.5 cells/mm2) or dorsal (2.9 ± 0.7 cells/mm2) aspects. Top-right schematic depicts delineations made to produce the three hippocampal subregions based on anteroposterior position from Bregma and the rf.
Figure 4
Figure 4
Diagram summarizing anatomical details of the hippocampal-AON pathway. Coronal section of the AON depicting CA1 pyramidal cell terminals in a gradient of innervation (left) which reflects the position of the cells (pseudo-colored from retrobead signals) within the hippocampal longitudinal axis (right). In the opposite hemisphere an outline is drawn to represent a hippocampal image that is created as a result of this innervation pattern.

References

    1. Aikath D., Aldis P. W., Rowland D. C., Kentros C. G. (2014). Role of self-generated odor cues in contextual representation. Hippocampus 24, 1039–1051. 10.1002/hipo.22289 - DOI - PMC - PubMed
    1. Aqrabawi A. J., Browne C. J., Dargaei Z., Garand D., Khademullah C. S., Woodin M. A., et al. (2016). Top-down modulation of olfactory-guided behaviours by the anterior olfactory nucleus pars medialis and ventral hippocampus. Nat. Commun. 7:13721. 10.1038/ncomms13721 - DOI - PMC - PubMed
    1. Arszovszki A., Borhegyi Z., Klausberger T. (2014). Three axonal projection routes of individual pyramidal cells in the ventral CA1 hippocampus. Front. Neuroanat. 8:53. 10.3389/fnana.2014.00053 - DOI - PMC - PubMed
    1. Brunjes P. C., Illig K. R., Meyer E. A. (2005). A field guide to the anterior olfactory nucleus (cortex). Brain Res. Rev. 50, 305–335. 10.1016/j.brainresrev.2005.08.005 - DOI - PubMed
    1. Carson K. A. (1984). Quantitative localization of neurons projecting to the mouse main olfactory bulb. Brain Res. Bull. 6, 629–634. 10.1016/0361-9230(84)90143-6 - DOI - PubMed

LinkOut - more resources