. 2018 Feb 22:9:71.
doi: 10.3389/fphar.2018.00071. eCollection 2018.

Convenience versus Biological Significance: Are PMA-Differentiated THP-1 Cells a Reliable Substitute for Blood-Derived Macrophages When Studying in Vitro Polarization?

Affiliations

Convenience versus Biological Significance: Are PMA-Differentiated THP-1 Cells a Reliable Substitute for Blood-Derived Macrophages When Studying in Vitro Polarization?

Serena Tedesco et al. Front Pharmacol. .

Abstract

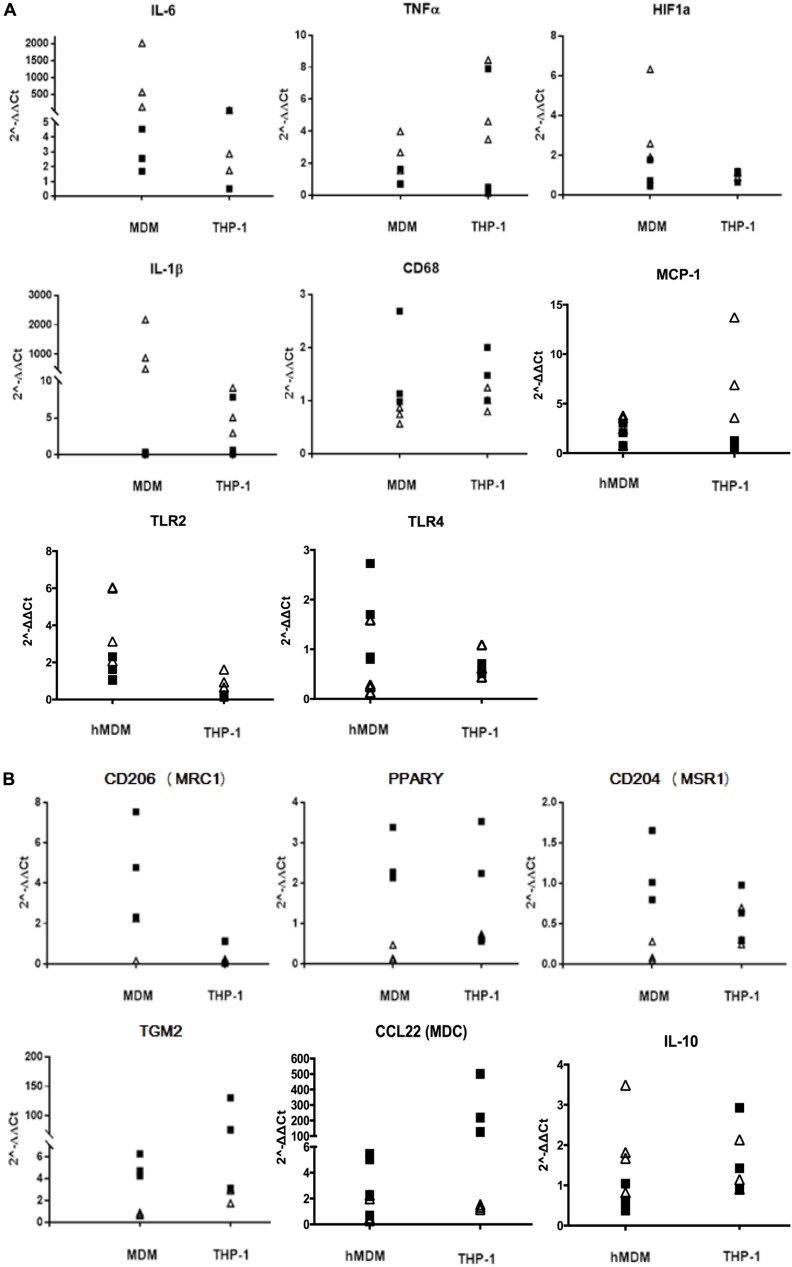
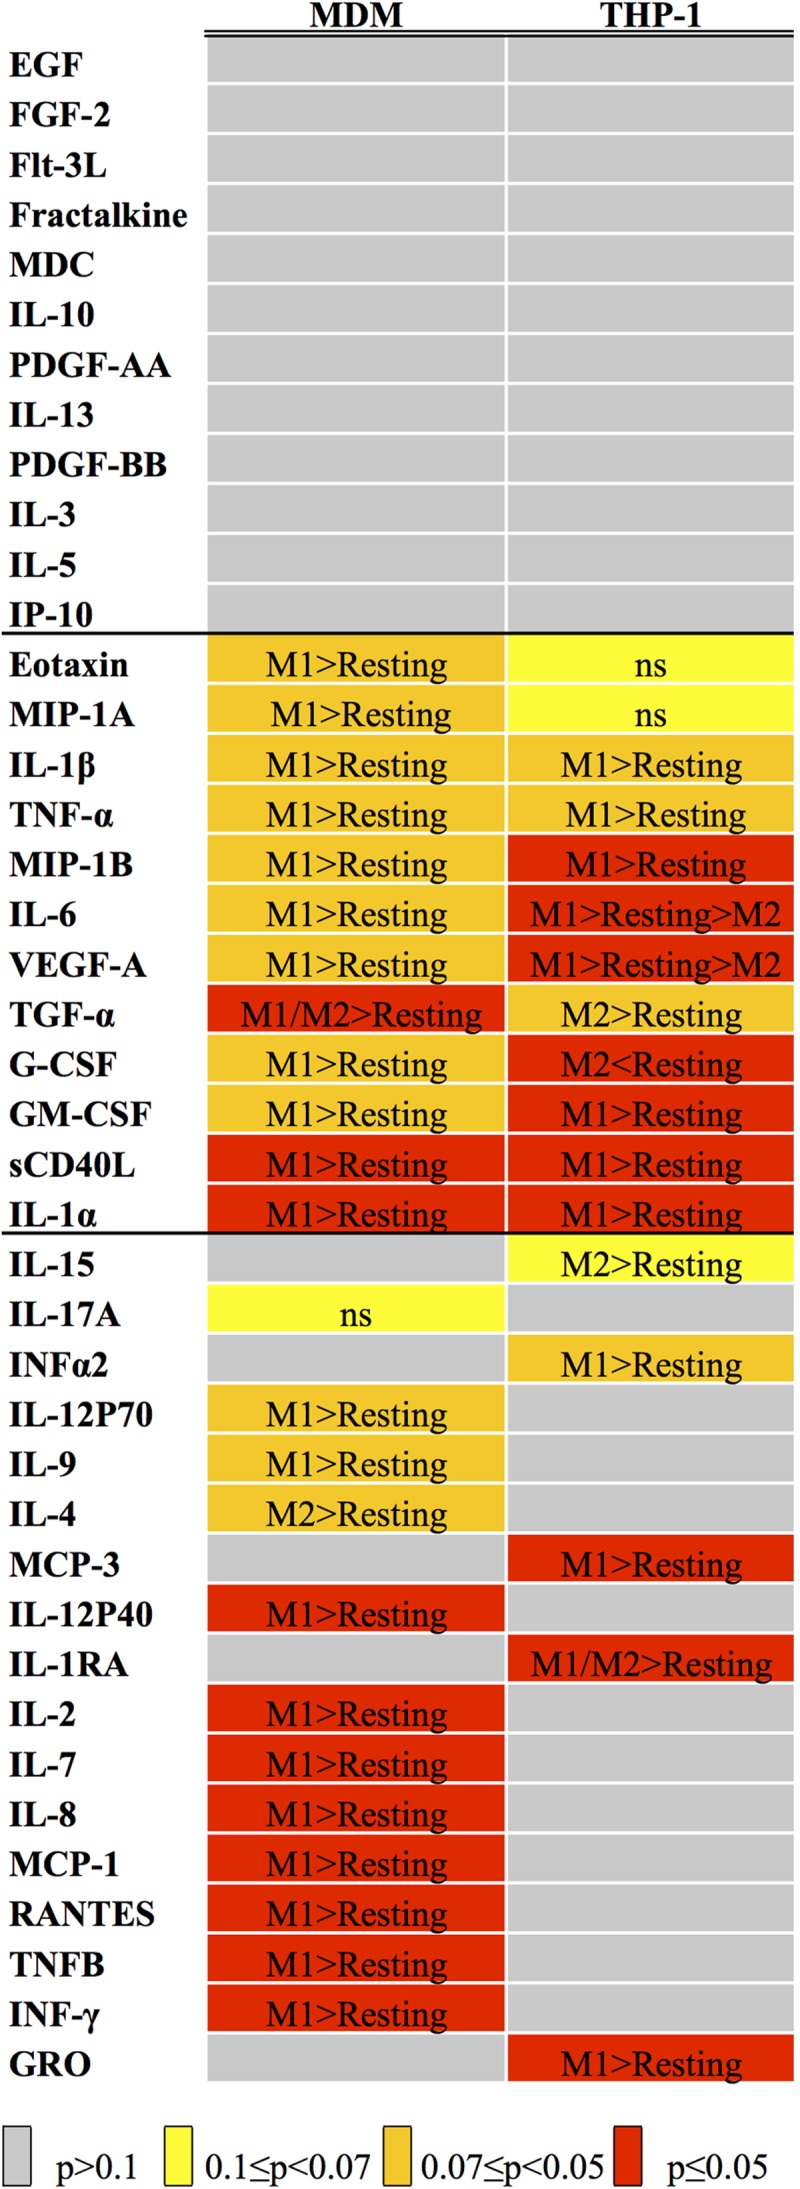
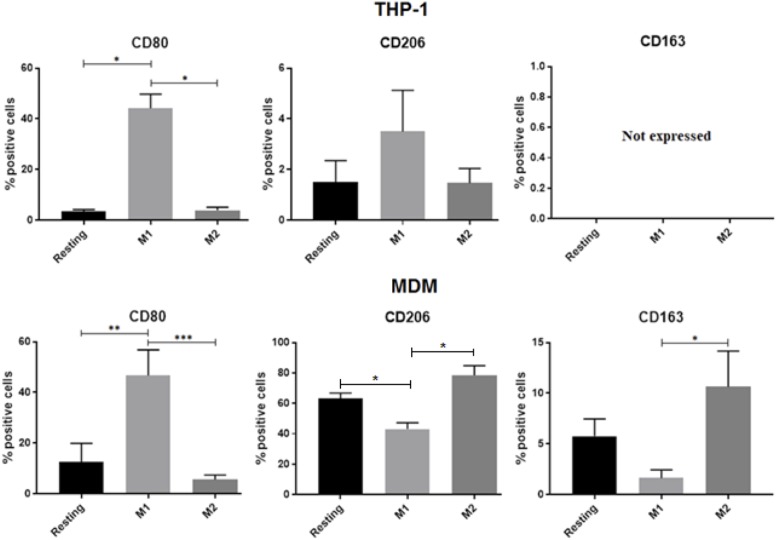
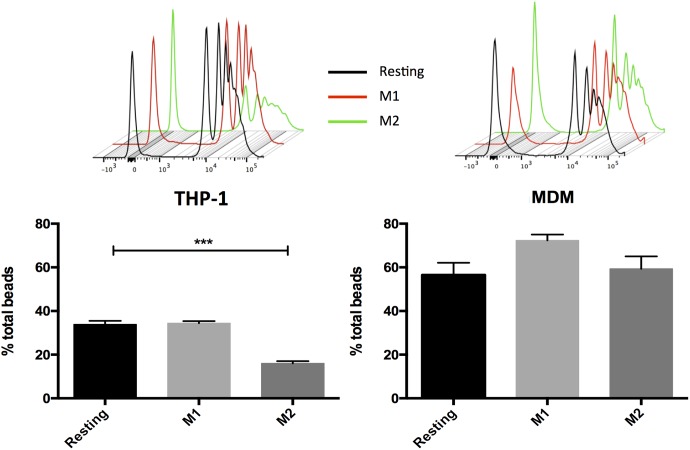
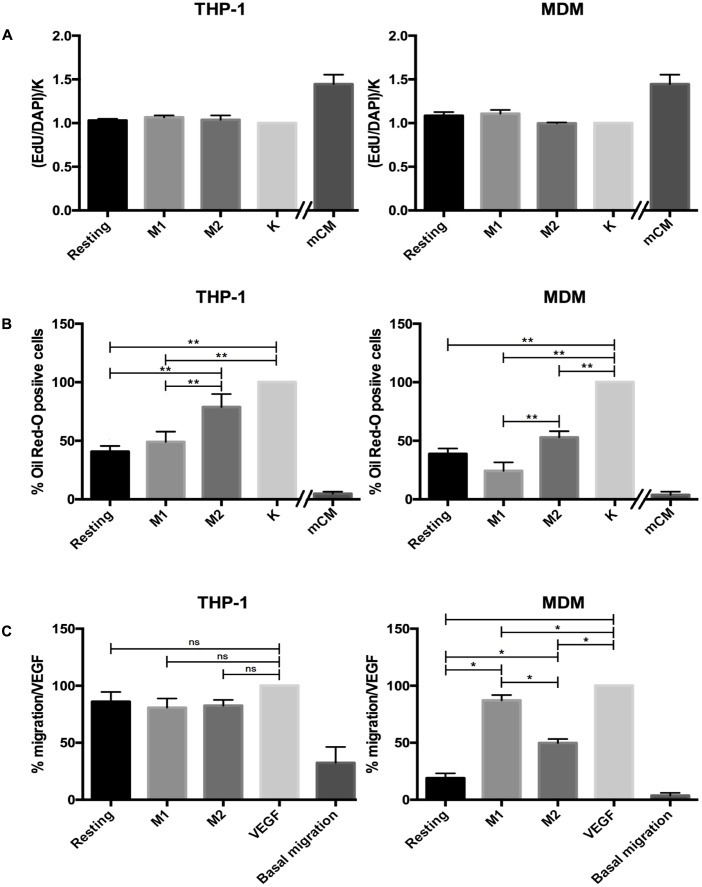
Human peripheral-blood monocytes are used as an established in vitro system for generating macrophages. For several reasons, monocytic cell lines such as THP-1 have been considered as a possible alternative. In view of their distinct developmental origins and phenotypic attributes, we set out to assess the extent to which human monocyte-derived macrophages (MDMs) and phorbol-12-myristate-13-acetate (PMA)-differentiated THP-1 cells were overlapping across a variety of responses to activating stimuli. Resting (M0) macrophages were polarized toward M1 or M2 phenotypes by 48-h incubation with LPS (1 μg/ml) and IFN-γ (10 ng/ml) or with IL-4 (20 ng/ml) and IL-13 (5 ng/ml), respectively. At the end of stimulation, MDMs displayed more pronounced changes in marker gene expression than THP-1. Upon assaying an array of 41 cytokines, chemokines and growth factors in conditioned media (CM) using the Luminex technology, secretion of 29 out of the 41 proteins was affected by polarized activation. While in 12 of them THP-1 and MDM showed comparable trends, for the remaining 17 proteins their responses to activating stimuli did markedly differ. Quantitative comparison for selected analytes confirmed this pattern. In terms of phenotypic activation markers, measured by flow cytometry, M1 response was similar but the established MDM M2 marker CD163 was undetectable in THP-1 cells. In a beads-based assay, MDM activation did not induce significant changes, whereas M2 activation of THP-1 decreased phagocytic activity compared to M0 and M1. In further biological activity tests, both MDM and THP-1 CM failed to affect proliferation of mouse myogenic progenitors, whereas they both reduced adipogenic differentiation of mouse fibro-adipogenic progenitor cells (M2 to a lesser extent than M1 and M0). Finally, migration of human umbilical vein endothelial cells was enhanced by CM irrespective of cell type and activation state except for M0 CM from MDMs. In summary, PMA-differentiated THP-1 macrophages did not entirely reproduce the response spectrum of primary MDMs to activating stimuli. We suggest that THP-1 be regarded as a simplified model of human macrophages when investigating relatively straightforward biological processes, such as polarization and its functional implications, but not as an alternative source in more comprehensive immunopharmacology and drug screening programs.

Keywords: THP-1 macrophages; human macrophages; macrophage activation; migration; phagocytosis; phenotype; progenitor cells.


Figures

FIGURE 1
FIGURE 1
Gene expression profiles of macrophage activation markers. mRNA levels of M1 markers (A) and M2 markers (B) were measured by qRT and normalized to GAPDH. White triangles indicate the values found in M1-polarized cells; black squares indicate the values found in M2-polarized cells. Data are expressed as 2-ΔΔCt values using the Resting condition as reference (n = 3–4 independent experiments per condition).
FIGURE 2
FIGURE 2
Statistical analysis of Luminex data. The heat map indicates the results of the variance analysis performed with the Kruskal–Wallis test considering the three experimental conditions (Resting, M1 and M2), expressed as p-values. The color code is listed below the map. When p was ≤0.1, we carried out a post hoc analysis with the Mann–Whitney test, comparing M1 versus Resting and M2 versus Resting. The results of such analyses are reported inside each cell (see Supplementary Table 1 for p-values).
FIGURE 3
FIGURE 3
Flow cytometry analyses of surface activation markers for MDM and THP-1. Cells were unstimulated (resting) or activated with LPS/IFNγ or IL-4/IL-13 for 48 h. Bar graphs report the percentage of CD80+, CD206+, and CD163+ cells in 3 independent experiments with THP-1 macrophages (A) and in MDMs obtained from 4 different donors (B). Data are expressed as mean ± SEM. Variance analysis was performed using the Kruskal–Wallis test and the post hoc analysis with the Mann–Whitney test. 0.1 ≥p > 0.07, ∗∗0.07 ≥p ≥ 0.05, ∗∗∗p ≤ 0.05.
FIGURE 4
FIGURE 4
Macrophage phagocytic activity following incubation with dextran-FITC 1 μm beads. MDM and THP-1 were unstimulated (resting) or activated with LPS/IFNγ or IL-4/IL-13 for 48 h then incubated with fluorescent microbeads for 1 h. Data are expressed as mean ± SEM of 3 independent experiments with THP-1 and of 7 different donors for MDMs. Variance analysis was performed with the Kruskal–Wallis test and the post hoc analysis with the Mann–Whitney test. ∗∗∗p ≤ 0.05.
FIGURE 5
FIGURE 5
Results of functional assays. (A) Effect of THP-1 and MDM CM on satellite cells proliferation. The number of proliferating cells is expressed as the ratio of EdU positive cells in the different experimental conditions, normalized against the value found in non-treated cells (‘K’ column). Data are reported as mean ± SEM of 4 independent experiments with THP-1 and 5 independent experiments with MDM CM. mCM was used as positive control. (B) Effect of THP-1 and MDM CM on FAP adipogenesis. Extent of FAP adipogenesis is expressed as the fraction of Oil Red-O stained cells, normalized against the value found in non-treated cells (‘K’ column). Data are expressed as mean ± SEM of 7 independent experiments with THP-1 cells and 4 independent experiments with MDMs. mCM was used as positive control. (C) THP-1 and MDM CM influenced HUVEC migration. HUVEC migration was measured in a Boyden micro-chemotaxis chamber after 6 h. VEGF was used as a positive control. Data are expressed as mean ± SEM of 3 independent experiments for THP-1 and of 4 different donors for MDM, all performed in sextuplicate. Variance analysis was performed with the Kruskal–Wallis test and the post hoc analysis with the Mann–Whitney test. 0.1 ≥p > 0.07, ∗∗0.07 ≥p ≥ 0.05.

References

    1. A-Gonzalez N., Quintana J. A., García-Silva S., Mazariegos M., González de la Aleja A., Nicolás-Ávila J. A., et al. (2017). Phagocytosis imprints heterogeneity in tissue-resident macrophages. J. Exp. Med. 214 1281–1296. 10.1084/jem.20161375 - DOI - PMC - PubMed
    1. Ambarus C. A., Krausz S., van Eijk M., Hamann J., Radstake T. R., Reedquist K. A., et al. (2012). Systematic validation of specific phenotypic markers for in vitro polarized human macrophages. J. Immunol. Methods 375 196–206. 10.1016/j.jim.2011.10.013 - DOI - PubMed
    1. Auwerx J. (1991). The human leukemia cell line, THP-1: a multifacetted model for the study of monocyte-macrophage differentiation. Experientia 47 22–31. 10.1007/BF02041244 - DOI - PubMed
    1. Bolego C., Buccellati C., Radaelli T., Cetin I., Puglisi L., Folco G., et al. (2006). eNOS, COX-2, and prostacyclin production are impaired in endothelial cells from diabetics. Biochem. Biophys. Res. Commun. 339 188–190. 10.1016/j.bbrc.2005.11.017 - DOI - PubMed
    1. Bosshart H., Heinzelmann M. (2004). Lipopolysaccharide-mediated cell activation without rapid mobilization of cytosolic free calcium. Mol. Immunol. 41 1023–1028. 10.1016/j.molimm.2004.05.003 - DOI - PubMed