. 2018 Feb 22:9:104.
doi: 10.3389/fphys.2018.00104. eCollection 2018.

Expression of Proinflammatory Cytokines Is Upregulated in the Hypothalamic Paraventricular Nucleus of Dahl Salt-Sensitive Hypertensive Rats

Affiliations

Expression of Proinflammatory Cytokines Is Upregulated in the Hypothalamic Paraventricular Nucleus of Dahl Salt-Sensitive Hypertensive Rats

Enshe Jiang et al. Front Physiol. .

Abstract

Accumulating evidence indicates that inflammation is implicated in hypertension. However, the role of brain proinflammatory cytokines (PICs) in salt sensitive hypertension remains to be determined. Thus, the objective of this study was to test the hypothesis that high salt (HS) diet increases PICs expression in the paraventricular nucleus (PVN) and leads to PVN neuronal activation. Eight-week-old male Dahl salt sensitive (Dahl S) rats, and age and sex matched normal Sprague Dawley (SD) rats were divided into two groups and fed with either a HS (4% NaCl) or normal salt (NS, 0.4% NaCl) diet for 5 consecutive weeks. HS diet induced hypertension and significantly increased cerebrospinal fluid (CSF) sodium concentration ([Na+]) in Dahl S rats, but not in normal SD rats. In addition, HS diet intake triggered increases in mRNA levels and immunoreactivities of PVN PICs including TNF-α, IL-6, and IL-1β, as well as Fra1, a chronic marker of neuronal activation, in Dahl S rats, but not in SD rats. Next, we investigated whether this increase in the expression of PVN PICs and Fra1 was induced by increased CSF [Na+]. Adult male SD rats were intracerebroventricular (ICV) infused with 8 μl of either hypertonic salt (4 μmol NaCl), mannitol (8 μmol, as osmolarity control), or isotonic salt (0.9% NaCl as vehicle control). Three hours following the ICV infusion, rats were euthanized and their PVN PICs expression was measured. The results showed that central administration of hypertonic saline in SD rats significantly increased the expression of PICs including TNF-α, IL-6, and IL-1β, as well as neuronal activation marker Fra1, compared to isotonic NaCl controls and osmolarity controls. Finally, we tested whether the increase in PICs expression occurred in neurons. Incubation of hypothalamic neurons with 10 mM NaCl in a culture medium for 6 h elicited significant increases in TNF-α, IL-6, and Fra1 mRNA levels. These observations, coupled with the important role of PICs in modulating neuronal activity and stimulating vasopressin release, suggest that HS intake induces an inflammatory state in the PVN, which, may in turn, augments sympathetic nerve activity and vasopressin secretion, contributing to the development of salt sensitive hypertension.

Keywords: cerebrospinal fluid; high salt diet; hypertension; paraventricular nucleus; proinflammatory cytokines.


Figures
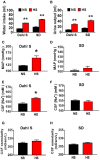
Figure 1
Figure 1
High salt (HS) intake induces an increase in water intake and urine output in both Dahl salt sensitive (Dahl S) rats and Sprague Dawley (SD) rats, but only increases mean arterial pressure (MAP) and cerebrospinal fluid (CSF) sodium concentration ([Na+]) in Dahl S rats. (A,B) show the summary data for water intake and urine output in Dahl S rats and SD rats with normal salt (NS) or HS diet, respectively. (C,E,G) show the changes in MAP, CSF [Na+], CSF osmolarity in Dahl S rats on different diets. (D,F,H) show the corresponding changes of MAP, CSF [Na+] and CSF osmolarity in SD rats. n = 5/group. *P < 0.05; **P < 0.01 compared with the rats on NS diet.
Figure 2
Figure 2
High salt (HS) diet increased mRNA levels of proinflammatory cytokines (PICs) in the paraventricular nucleus of Dahl salt sensitive (Dahl S) rats but not in Sprague Dawley (SD) rats. Summary data show the changes of mRNA levels of TNF-α (A), IL-6 (C), IL-1β (E), and Fra1 (G) in paraventricular nucleus of Dahl S rats on HS diet (red) and normal salt (NS) diet (black). (B,D,F,H) show the corresponding changes of PICs in Sprague Dawley rats. n = 5/group. *P < 0.05; **P < 0.01.
Figure 3
Figure 3
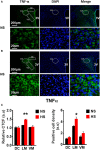
High salt intake increased TNF-α protein expression in the paraventricular nucleus (PVN) of Dahl salt sensitive (Dahl S) rats. Representative images showing immunostaining of TNF-α (green), DAPI (blue) and merged image in PVN from a Dahl S rat on normal salt (NS) diet (A) and a Dahl S rat on HS diet (B). The area boxed in circle in upper panel was higher magnified in the lower panel. The brain coronal sections were taken from ~1.8–2.1 mm caudal to the bregma. Brightness and contrast were adjusted in the PowerPoint software to the same settings for all images. (C) Summary data showing the relative CTCF and positive cell density of TNF-α protein expression within identified PVN subnuclei in the 2 groups (n = 5/group). 3V, the third ventricle; DAPI, 4′,6-diamidino-2-phenylindole dihydrochloride; CTCF, the corrected total cell fluorescence. *P < 0.05; **P < 0.01.
Figure 4
Figure 4
High salt intake increased IL-6 protein expression in the paraventricular nucleus (PVN) of Dahl salt sensitive (Dahl S) rats. Representative images showing immunostaining of IL-6 (green), DAPI (blue) and merged image in PVN from a Dahl S rat on normal salt (NS) diet (A) and a Dahl S rat on HS diet (B). The area boxed in circle in upper panel was higher magnified in the lower panel. The brain coronal sections were taken from ~1.8 to 2.1 mm caudal to the bregma. Brightness and contrast were adjusted in the PowerPoint software to the same settings for all images. (C) Summary data showing the relative CTCF and positive cell density of IL-6 protein expression within identified PVN subnuclei in the 2 groups (n = 5/group). 3V, the third ventricle; DAPI, 4′,6-diamidino-2-phenylindole; CTCF, the corrected total cell fluorescence. **P < 0.01.
Figure 5
Figure 5
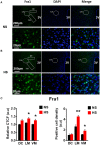
High salt intake increased Fra1 protein expression in the paraventricular nucleus (PVN) of Dahl salt sensitive (Dahl S) rats. Representative images showing immunostaining of Fra1 (green), DAPI (blue) and merged image in PVN from a Dahl S rat on a normal salt (NS) diet (A) and a Dahl S rat on a HS diet (B). The area boxed in circle in upper panel was higher magnified in the lower panel. The brain coronal sections were taken from ~1.8 to 2.1 mm caudal to the bregma. Brightness and contrast were adjusted in the PowerPoint software to the same settings for all images. (C) Summary data showing the relative CTCF and positive cell density of Fra1 protein expression within identified PVN subnuclei in the 2 groups (n = 5/group). 3V, the third ventricle; DAPI, 4,6-diamidino-2-phenylindole; CTCF, the corrected total cell fluorescence. *P < 0.05; **P < 0.01.
Figure 6
Figure 6
Intracerebroventricular (ICV) infusion of hypertonic saline increased mRNA levels of pro-inflammatory cytokines and Fra1 in the paraventricular nucleus (PVN) of Sprague Dawley (SD) rats. SD rats (n = 5/group) were ICV infused with same volume (8 μl) of either isotonic saline (vehicle control, black), 4 μmol NaCl (red), or 8 μmol mannitol (osmolarity control, blue), their PVN tissues were punched out and analyzed for mRNA levels of TNF-α (A), IL-6 (B), IL-1β (C), and Fra1 (D). *P < 0.05; **P < 0.01, 4 μmol NaCl vs. Control or 8 μmol mannitol; # P < 0.05, 8 μmol mannitol vs. Control.
Figure 7
Figure 7
Intracerebroventricular (ICV) infusion of hypertonic saline increases immunoreactivity of TNF-α in the paraventricular nucleus (PVN) of Sprague Dawley (SD) rats. (A) Representative images show the TNF-α immunostaining from a SD rat that received isotonic saline (Control) and 4 μmol NaCl ICV infusion, respectively. The area boxed in circle in upper panel was higher magnified in the lower panel. The brain coronal sections were taken from ~1.8–2.1 mm caudal to the bregma. Brightness and contrast were adjusted in the PowerPoint software to the same settings for all images. (B) Summary data showing the relative CTCF and positive cell density of TNFα protein expression within identified PVN subnuclei in the 2 groups (n = 5/group). 3V, third ventricle; CTCF, the corrected total cell fluorescence. *P < 0.05, **P < 0.01 compared to Control.
Figure 8
Figure 8
Intracerebroventricular (ICV) infusion of hypertonic saline increases immunoreactivity of IL-6 in the paraventricular nucleus (PVN) of Sprague Dawley (SD) rats. (A) Representative images show the IL-6 immunostaining from a SD rat that received isotonic saline (Control) and 4 μmol NaCl ICV infusion, respectively. The area boxed in circle in upper panel was higher magnified in the lower panel. The brain coronal sections were taken from ~1.8–2.1 mm caudal to the bregma. Brightness and contrast were adjusted in the PowerPoint software to the same settings for all images. (B) Summary data showing the relative CTCF and positive cell density of IL-6 protein expression within identified PVN subnuclei in the 2 groups (n = 5/group). 3V, third ventricle; CTCF, the corrected total cell fluorescence. *P < 0.05, **P < 0.01 compared to Control.
Figure 9
Figure 9
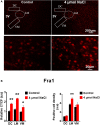
Intracerebroventricular (ICV) infusion of hypertonic saline increases immunoreactivity of Fra1 in paraventricular nucleus (PVN) of Spraque Dawley (SD) rats. (A) Representative images show the Fra1 immunostaining from SD rats that received isotonic saline (Control) and 4 μmol NaCl ICV infusion, respectively. The area boxed in circle in upper panel was higher magnified in the lower panel. The brain coronal sections were taken from ~1.8–2.1 mm caudal to the bregma. Brightness and contrast were adjusted in the PowerPoint software to the same settings for all images. (B) Summary data showing the relative CTCF and positive cell density of Fra1 protein expression within identified PVN subnuclei in the 2 groups (n = 5/group). 3V, third ventricle; CTCF, the corrected total cell fluorescence. *P < 0.05, **P < 0.01 compared to Control.
Figure 10
Figure 10
The changes of mRNA levels of proinflammatory cytokines treated with 10 mM NaCl. The summary data show the change of mRNA levels of TNF-α (A), IL-6 (B), IL-1β (C), and Fra1 (D) in primary cultured paraventricular nucleus neurons treated with vehicle control (Control, black) or 10 mM NaCl (red). n = 5/group. *P < 0.05; **P < 0.01, 10 mM NaCl vs. Control.

Similar articles

Cited by

References

    1. Angeli F., Reboldi G., Verdecchia P. (2014). Hypertension, inflammation and atrial fibrillation. J. Hypertens. 32, 480–483. 10.1097/HJH.0000000000000112 - DOI - PubMed
    1. Azar S., Ernsberger P., Livingston S., Azar P., Iwai J. (1981). Paraventricular–suprachiasmatic lesions prevent salt-induced hypertension in Dahl rats. Clin. Sci. 61(Suppl. 7), 49s−51s. 10.1042/cs061049s - DOI - PubMed
    1. Bardgett M. E., Holbein W. W., Herrera-Rosales M., Toney G. M. (2014). Ang II-salt hypertension depends on neuronal activity in the hypothalamic paraventricular nucleus but not on local actions of tumor necrosis factor-alpha. Hypertension 63, 527–534. 10.1161/HYPERTENSIONAHA.113.02429 - DOI - PMC - PubMed
    1. Beattie E. C., Stellwagen D., Morishita W., Bresnahan J. C., Ha B. K., Von Zastrow M., et al. . (2002). Control of synaptic strength by glial TNFalpha. Science 295, 2282–2285. 10.1126/science.1067859 - DOI - PubMed
    1. Biancardi V. C., Campos R. R., Stern J. E. (2010). Altered balance of gamma-aminobutyric acidergic and glutamatergic afferent inputs in rostral ventrolateral medulla-projecting neurons in the paraventricular nucleus of the hypothalamus of renovascular hypertensive rats. J. Comp. Neurol. 518, 567–585. 10.1002/cne.22256 - DOI - PMC - PubMed

LinkOut - more resources