. 2018 Feb 19:9:257.
doi: 10.3389/fimmu.2018.00257. eCollection 2018.

Functional and Phenotypic Changes of Natural Killer Cells in Whole Blood during Mycobacterium tuberculosis Infection and Disease

Affiliations

Functional and Phenotypic Changes of Natural Killer Cells in Whole Blood during Mycobacterium tuberculosis Infection and Disease

Mathieu Garand et al. Front Immunol. .

Abstract

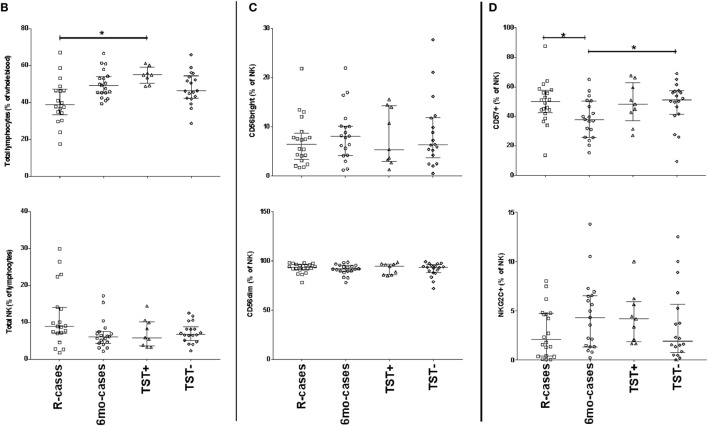
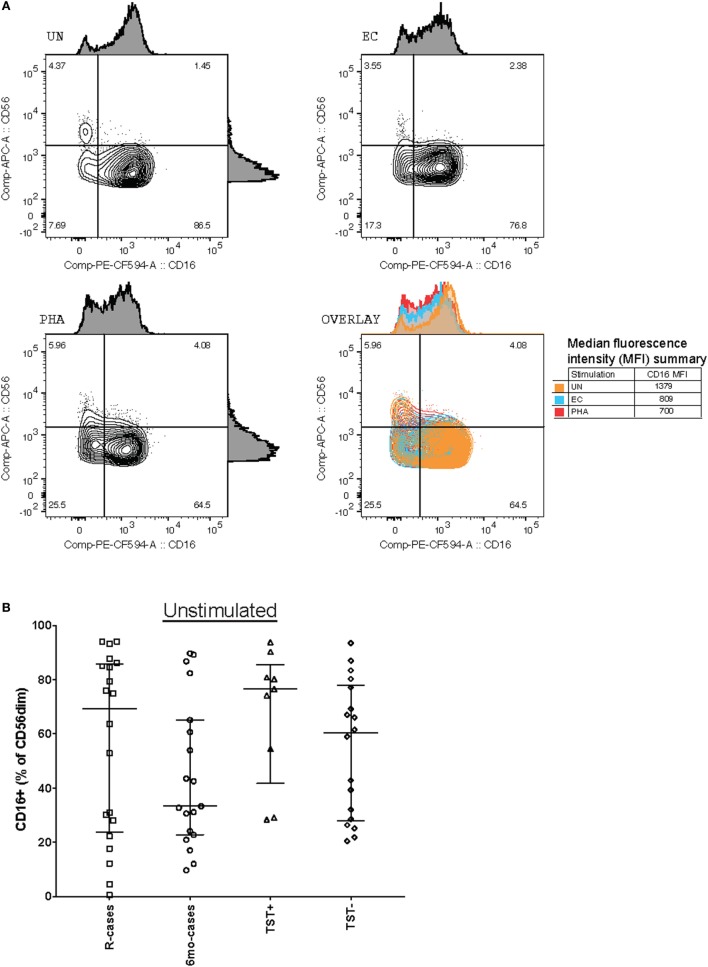
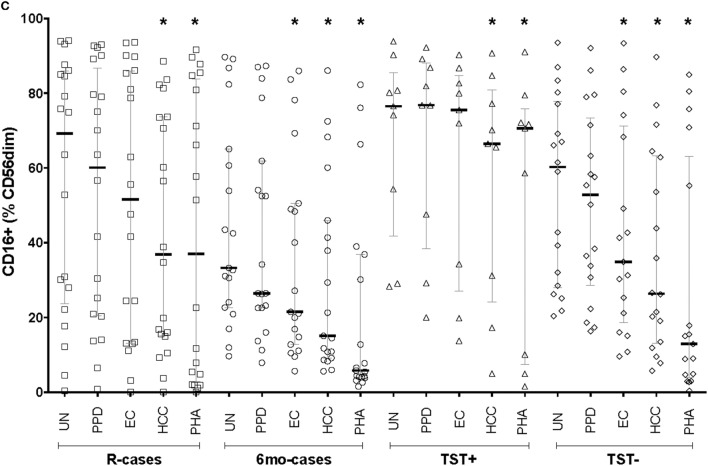
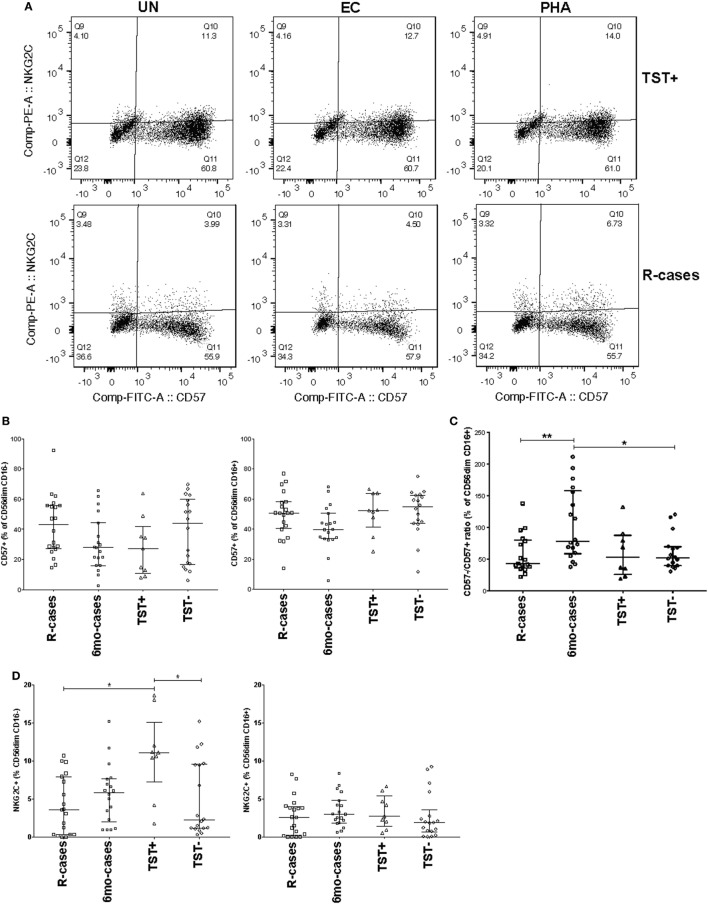
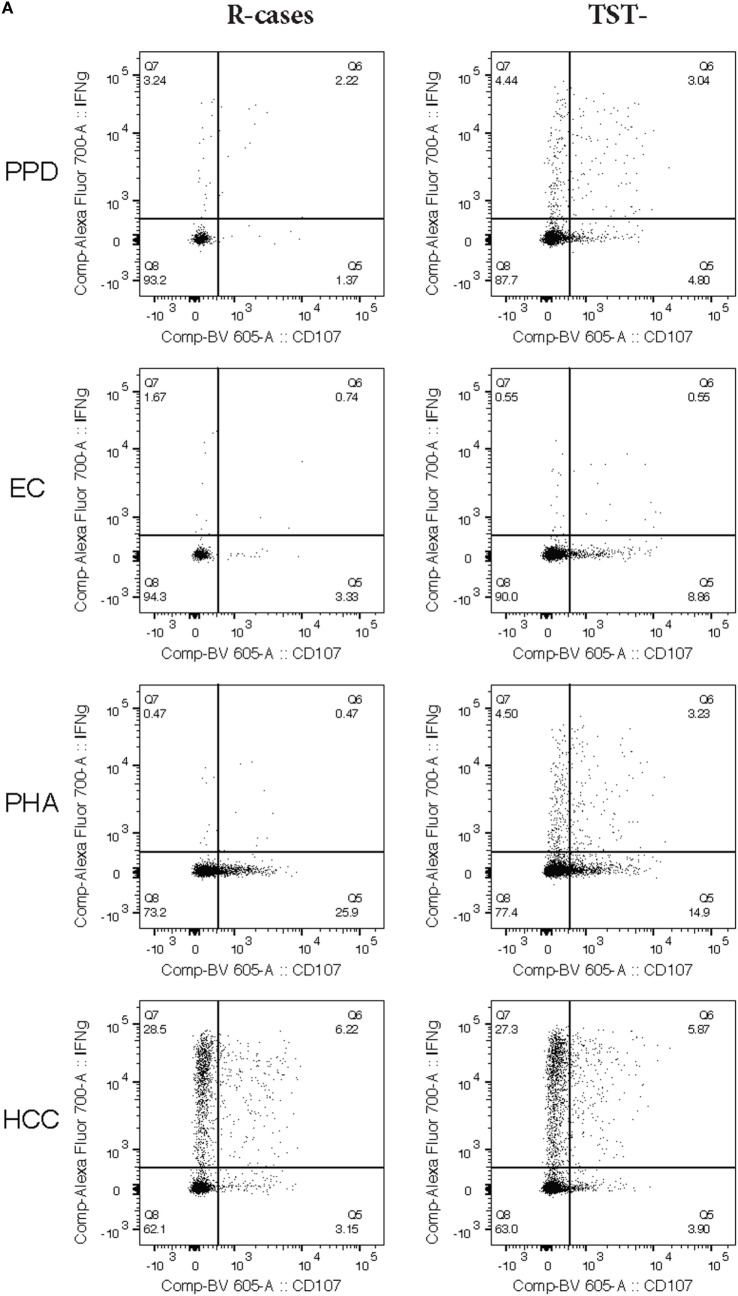
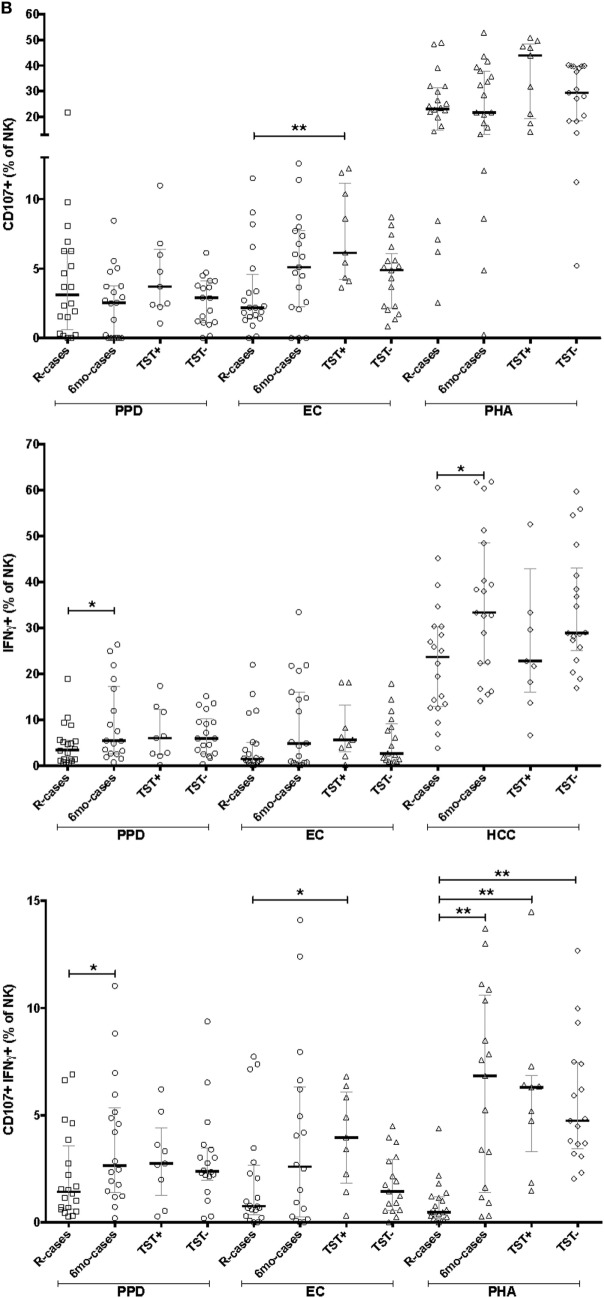
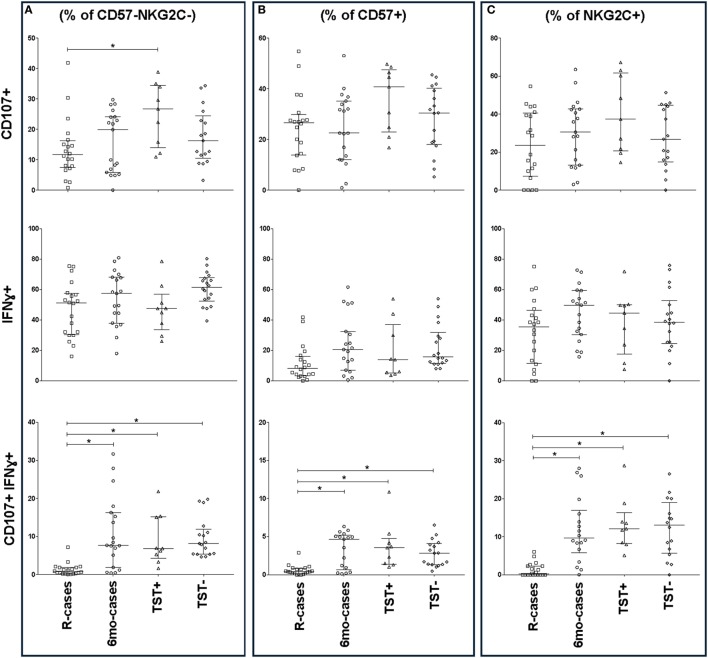
Tuberculosis (TB) is still a global health concern, especially in resource-poor countries such as The Gambia. Defining protective immunity to TB is challenging: its pathogenesis is complex and involves several cellular components of the immune system. Recent works in vaccine development suggest important roles of the innate immunity in natural protection to TB, including natural killer (NK) cells. NK cells mediate cellular cytotoxicity and cytokine signaling in response to Mycobacterium tuberculosis (Mtb). NK cells can display specific memory-type markers to previous antigen exposure; thus, bridging innate and adaptive immunity. However, major knowledge gaps exist on the contribution of NK cells in protection against Mtb infection or TB. We performed a cross-sectional assessment of NK cells phenotype and function in four distinct groups of individuals: TB cases pre-treatment (n = 20) and post-treatment (n = 19), and household contacts with positive (n = 9) or negative (n = 18) tuberculin skin test (TST). While NK cells frequencies were similar between all groups, significant decreases in interferon-γ expression and degranulation were observed in NK cells from TB cases pre-treatment compared to post-treatment. Conversely, CD57 expression, a marker of advanced NK cells differentiation, was significantly lower in cases post-treatment compared to pre-treatment. Finally, NKG2C, an activation and imprinted-NK memory marker, was significantly increased in TST+ (latently infected) compared to TB cases pre-treatment and TST- (uninfected) individuals. The results of this study provide valuable insights into the role of NK cells in Mtb infection and TB disease, demonstrating potential markers for distinguishing between infection states and monitoring of TB treatment response.

Keywords: CD107a; CD57; Fc gamma receptor IIIa; NKG2C; flow cytometry; innate memory; interferon gamma; natural killer cells.


Figures

Figure 1
Figure 1
Impact of Mtb infection status on blood cell and natural killer (NK) cell subsets populations: active TB is characterized by lower lymphocyte frequencies and higher granulocyte count. Frequency (expressed as % of parent cell population) of major cell subsets analyzed by flow cytometry (unstimulated condition only). (A) Gating strategy with dot plots (the gating order is indicated by numbers). After doublet and debris/dead cells exclusion (plot 1), we identify the following subsets: granulocytes (plot 3, based on forward and side scatter appearance; mid-high FSC/high SSC), lymphocytes (plot 4, CD45+/CD14), monocytes (plot 5, CD45/CD14+), natural killer (NK) cells (plot 6, CD3/CD56dim/+) as well as NK cells expressing CD57, NKG2C (plot 7). (B) Total lymphocytes (% of leukocytes), total NK (% of lymphocytes), (C) CD56bright (% of NK), CD56dim (% of NK), and (D) CD57+ (% of NK), and NKG2C+ (% of NK). Each data point represents one subject and vertical bars indicate the median ± interquartile range. Comparisons between groups (indicated below the x-axis of the bottom plot in each panel) were made using Kruskal–Wallis one-way ANOVA with Dunn’s test as post hoc; where applicable, significance is marked by an asterisk (*) and represents p < 0.01. The x-axis label represents the following four groups: (1) individuals with active TB disease = R-cases (open squares, n = 18–20), (2) 6 months post anti-TB treatment = 6mo-cases (open circles, n = 18–19), (3) healthy individuals living in the same household as someone with active TB disease and has a positive tuberculin skin test (TST) result = TST+ (open triangles, n = 8–9), and (4.) healthy individuals living in the same household as someone with active TB disease and has a negative TST result = TST− (open diamonds, n = 18).
Figure 1
Figure 1
Impact of Mtb infection status on blood cell and natural killer (NK) cell subsets populations: active TB is characterized by lower lymphocyte frequencies and higher granulocyte count. Frequency (expressed as % of parent cell population) of major cell subsets analyzed by flow cytometry (unstimulated condition only). (A) Gating strategy with dot plots (the gating order is indicated by numbers). After doublet and debris/dead cells exclusion (plot 1), we identify the following subsets: granulocytes (plot 3, based on forward and side scatter appearance; mid-high FSC/high SSC), lymphocytes (plot 4, CD45+/CD14), monocytes (plot 5, CD45/CD14+), natural killer (NK) cells (plot 6, CD3/CD56dim/+) as well as NK cells expressing CD57, NKG2C (plot 7). (B) Total lymphocytes (% of leukocytes), total NK (% of lymphocytes), (C) CD56bright (% of NK), CD56dim (% of NK), and (D) CD57+ (% of NK), and NKG2C+ (% of NK). Each data point represents one subject and vertical bars indicate the median ± interquartile range. Comparisons between groups (indicated below the x-axis of the bottom plot in each panel) were made using Kruskal–Wallis one-way ANOVA with Dunn’s test as post hoc; where applicable, significance is marked by an asterisk (*) and represents p < 0.01. The x-axis label represents the following four groups: (1) individuals with active TB disease = R-cases (open squares, n = 18–20), (2) 6 months post anti-TB treatment = 6mo-cases (open circles, n = 18–19), (3) healthy individuals living in the same household as someone with active TB disease and has a positive tuberculin skin test (TST) result = TST+ (open triangles, n = 8–9), and (4.) healthy individuals living in the same household as someone with active TB disease and has a negative TST result = TST− (open diamonds, n = 18).
Figure 2
Figure 2
Impact of Mtb infection status and Mtb-antigen re-exposure on CD16 expression: lower baseline CD16 expression in individual who undergone 6 months anti-TB treatment compared to the pre-treatment group. The frequency of CD16+ cells [expressed as % CD56dim natural killer (NK) cells] analyzed by flow cytometry in the presence or absence of antigenic ligands. (A) Representative dot plots showing CD56 and CD16 expression on NK cells (from the CD3/CD56dim/+ gate) from baseline (UN, top left), with exposure to EC (top right), and PHA (bottom left). CD16 median fluorescence intensity (MFI) is depicted as histograms above each plot and summarized in the overlay plot (bottom right). (B) Total CD16+ (% of CD56dim) under unstimulated condition. (C) Total CD16+ (% of CD56dim) following incubation with the following antigenic ligands: unstimulated control (UN), purified protein derivative (PPD), ESAT-6/CFP10 fusion protein (EC), high concentration of rIL-12 and rIL-18 (HCC), and phytohemagglutinin (PHA). Each data point represents one subject and vertical bars indicate the median ± interquartile range. Comparisons between groups (indicated below the x-axis) were made using Kruskal–Wallis one-way ANOVA with Dunn’s test as post hoc; where applicable, significance is marked by an asterisk (*) and represents p < 0.01. The effect of stimulation within each group was tested for significance using Freidman test for repeated measured with Dunn’s post hoc test and comparisons were performed against UN within each participant group; where applicable, significance is marked by an asterisk (*) and represents p < 0.01. The x-axis label represents the four participant groups defined in the legend of Figure 1; R-cases (n = 20), 6mo-cases (n = 19), TST+ (n = 9), TST− (n = 17–18).
Figure 2
Figure 2
Impact of Mtb infection status and Mtb-antigen re-exposure on CD16 expression: lower baseline CD16 expression in individual who undergone 6 months anti-TB treatment compared to the pre-treatment group. The frequency of CD16+ cells [expressed as % CD56dim natural killer (NK) cells] analyzed by flow cytometry in the presence or absence of antigenic ligands. (A) Representative dot plots showing CD56 and CD16 expression on NK cells (from the CD3/CD56dim/+ gate) from baseline (UN, top left), with exposure to EC (top right), and PHA (bottom left). CD16 median fluorescence intensity (MFI) is depicted as histograms above each plot and summarized in the overlay plot (bottom right). (B) Total CD16+ (% of CD56dim) under unstimulated condition. (C) Total CD16+ (% of CD56dim) following incubation with the following antigenic ligands: unstimulated control (UN), purified protein derivative (PPD), ESAT-6/CFP10 fusion protein (EC), high concentration of rIL-12 and rIL-18 (HCC), and phytohemagglutinin (PHA). Each data point represents one subject and vertical bars indicate the median ± interquartile range. Comparisons between groups (indicated below the x-axis) were made using Kruskal–Wallis one-way ANOVA with Dunn’s test as post hoc; where applicable, significance is marked by an asterisk (*) and represents p < 0.01. The effect of stimulation within each group was tested for significance using Freidman test for repeated measured with Dunn’s post hoc test and comparisons were performed against UN within each participant group; where applicable, significance is marked by an asterisk (*) and represents p < 0.01. The x-axis label represents the four participant groups defined in the legend of Figure 1; R-cases (n = 20), 6mo-cases (n = 19), TST+ (n = 9), TST− (n = 17–18).
Figure 3
Figure 3
Impact of Mtb infection status on natural killer cell differentiation and maturity: (1) moderately reduced CD57 expression in individuals with prior Mtb exposure, (2) heightened expression of the activation marker NKG2C distinguishes latently infected individuals from active tuberculosis disease and healthy controls. Frequency (expressed as % of parent cell population) of major cell subsets analyzed by flow cytometry (unstimulated condition only). (A) Dot plots showing the expression of CD57 and NKG2C on CD56dim CD16+ NK cells. Shown is the stimulation with UN, EC, and phytohemagglutinin (PHA) (first, second, and third columns, respectively) for individuals in the TST+ (top row) and R-cases (bottom row) groups. (B) Total CD57+ expressed as: % of CD56dim CD16 and% of CD56dim CD16+ (left and right, respectively). (C) Ratio of CD57 to CD57+ expressed as% of CD56dim CD16+. (D) Total NKG2C+ expressed as: % of CD56dim CD16 and % of CD56dim CD16+ (left and right, respectively). Each data point represents one subject and vertical bars indicate the median ± interquartile range. Comparisons between groups (indicated below the x-axis) were made using Kruskal-Wallis one-way ANOVA with Dunn’s test as post hoc; where applicable, significance is marked by * for p < 0.05 and ** for p < 0.01. The x-axis label represents the four participant groups defined in the legend of Figure 1; R-cases (n = 19–20), 6mo-cases (n = 18–19), TST+ (n = 9), TST− (n = 18).
Figure 4
Figure 4
Impact of Mtb infection status and Mtb-antigen re-exposure on natural killer (NK) cell function: NK from individuals with active tuberculosis (TB) showed markedly reduced interferon gamma (IFNγ) production and moderately reduced degranulation in response to antigenic ligands. The frequency of IFNγ+ and CD107a+ cells (expressed as % NK cells) analyzed by flow cytometry in the presence or absence of antigenic ligands. (A) Examples of dot plots showing expression of IFNγ and CD107a by NK cells following exposure to purified protein derivative (PPD), EC, phytohemagglutinin (PHA), and HCC as indicated in the R-cases and TST− groups (left and right columns, respectively). (B) Total CD107a+ expressed following incubation with PPD, EC, and PHA (top row). Total IFNγ expressed following incubation with PPD, EC, and HCC (mid row). Total double-positive cells (i.e., IFNγ+CD107a+) following incubation with PPD, EC, and PHA (bottom row). Each data point represents one subject and vertical bars indicate the median ± interquartile range. Comparisons between groups (indicated below the x-axis) were made using Kruskal–Wallis one-way ANOVA with Dunn’s test as post hoc; where applicable, significance is marked by * for p < 0.05 and ** for p < 0.01. The x-axis label represents the four participant groups defined in the legend of Figure 1; R-cases (n = 20), 6mo-cases (n = 18–19), TST+ (n = 9), TST− (n = 17–18).
Figure 4
Figure 4
Impact of Mtb infection status and Mtb-antigen re-exposure on natural killer (NK) cell function: NK from individuals with active tuberculosis (TB) showed markedly reduced interferon gamma (IFNγ) production and moderately reduced degranulation in response to antigenic ligands. The frequency of IFNγ+ and CD107a+ cells (expressed as % NK cells) analyzed by flow cytometry in the presence or absence of antigenic ligands. (A) Examples of dot plots showing expression of IFNγ and CD107a by NK cells following exposure to purified protein derivative (PPD), EC, phytohemagglutinin (PHA), and HCC as indicated in the R-cases and TST− groups (left and right columns, respectively). (B) Total CD107a+ expressed following incubation with PPD, EC, and PHA (top row). Total IFNγ expressed following incubation with PPD, EC, and HCC (mid row). Total double-positive cells (i.e., IFNγ+CD107a+) following incubation with PPD, EC, and PHA (bottom row). Each data point represents one subject and vertical bars indicate the median ± interquartile range. Comparisons between groups (indicated below the x-axis) were made using Kruskal–Wallis one-way ANOVA with Dunn’s test as post hoc; where applicable, significance is marked by * for p < 0.05 and ** for p < 0.01. The x-axis label represents the four participant groups defined in the legend of Figure 1; R-cases (n = 20), 6mo-cases (n = 18–19), TST+ (n = 9), TST− (n = 17–18).
Figure 5
Figure 5
Impact of Mtb infection status on CD57/NKG2C-defined natural killer (NK) cell subset functional responses to antigenic ligands. The frequency of CD107a+, IFNγ+, and double-positive cells (top, mid, and bottom row, respectively) analyzed by flow cytometry in the presence strong antigenic ligands: phytohemagglutinin (PHA), HCC, and PHA for CD107a, interferon gamma (IFNγ), and CD107a/IFNγ, respectively. Total functional response expressed as (A) % of CD57 NKG2C NK cells, (B)% of CD57+ NKG2C, and (C) % of CD57 NKG2C+. Each data point represents one subject and vertical bars indicate the median ± interquartile range. Comparisons between groups (indicated below the x-axis) were made using Kruskal–Wallis one-way ANOVA with Dunn’s test as post hoc; where applicable, significance is marked by an asterisk (*) and represents p < 0.01. The x-axis label represents the four participant groups defined in the legend of Figure 1; R-cases (n = 20), 6mo-cases (n = 18–19), TST+ (n = 9), TST− (n = 16–18).

References

    1. Global Tuberculosis Programme, WHO. Global Tuberculosis Report. WHO; (2016). Available from: http://www.who.int
    1. Ottenhoff TH, Kaufmann SH. Vaccines against tuberculosis: where are we and where do we need to go? PLoS Pathog (2012) 8:e1002607. 10.1371/journal.ppat.1002607 - DOI - PMC - PubMed
    1. Walzl G, Ronacher K, Hanekom W, Scriba TJ, Zumla A. Immunological biomarkers of tuberculosis. Nat Rev Immunol (2011) 11:343. 10.1038/nri2960 - DOI - PubMed
    1. Ramakrishnan L. Revisiting the role of the granuloma in tuberculosis. Nat Rev Immunol (2012) 12:352. 10.1038/nri3211 - DOI - PubMed
    1. van Crevel R, Ottenhoff TH, van der Meer JW. Innate immunity to Mycobacterium tuberculosis. Clin Microbiol Rev (2002) 15:294. 10.1128/CMR.15.2.294-309.2002 - DOI - PMC - PubMed

Publication types

MeSH terms