. 2018 Feb 22:9:217.
doi: 10.3389/fpls.2018.00217. eCollection 2018.

Identification of Metabolites and Transcripts Involved in Salt Stress and Recovery in Peanut

Affiliations

Identification of Metabolites and Transcripts Involved in Salt Stress and Recovery in Peanut

Feng Cui et al. Front Plant Sci. .

Abstract

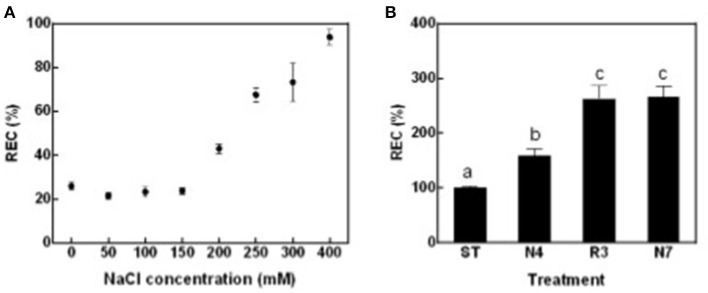
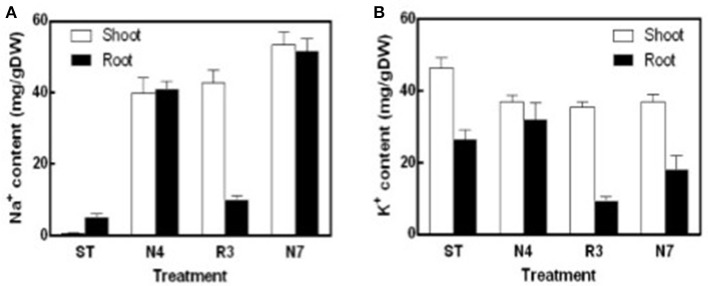
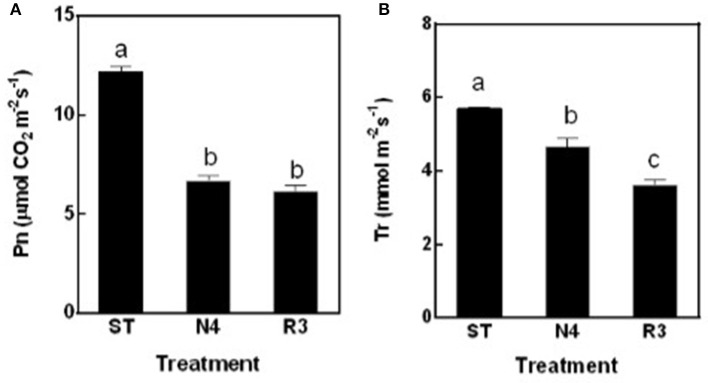
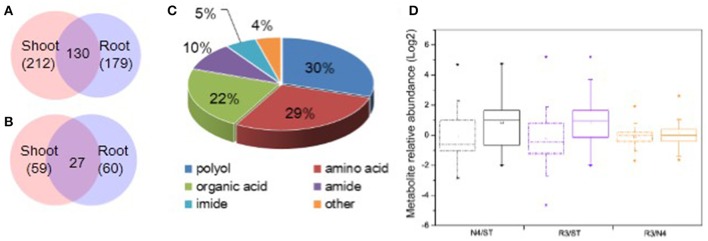
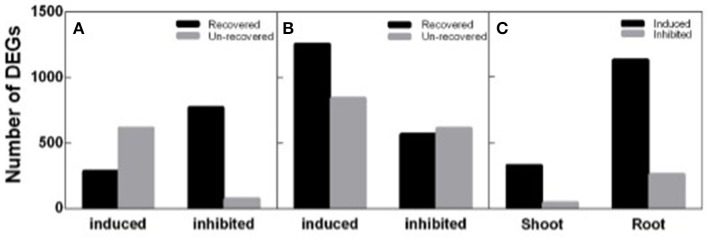
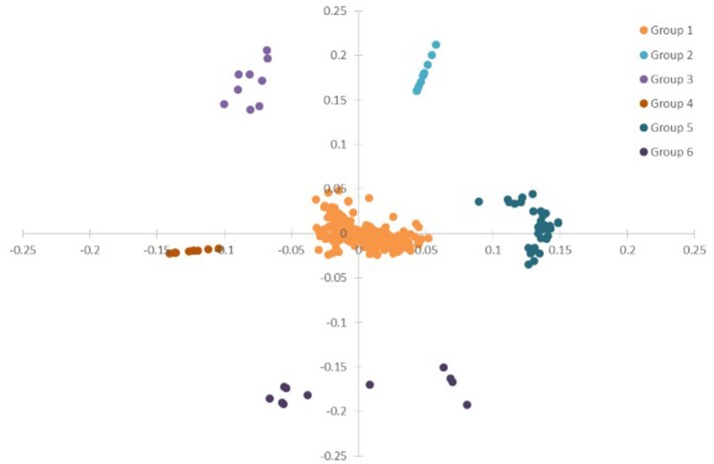
HIGHLIGHTS Metabolites and transcripts related to plant physiology in salt stress conditions, especially to the recovery process were disclosed in peanut. Peanut (Arachis hypogaea L.) is considered as a moderately salt-sensitive species and thus soil salinity can be a limiting factor for peanut cultivation. To gain insights into peanut plant physiology in response to salt stress and alleviation, we comprehensively characterized leaf relative electrolyte leakage (REC), photosynthesis, leaf transpiration, and metabolism of plants under salt stress and plants that were subjected to salt stress followed by salt alleviation period. As expected, we found that REC levels were higher when plants were subjected to salt stress compared with the untreated plants. However, in contrast to expectations, REC was even higher compared with salt treated plants when plants were transferred from salt stress to standard conditions. To decipher REC variation in response to salt stress, especial during the recovery, metabolite, and transcript variations were analyzed by GC/MS and RNA-seq method, respectively. Ninety two metabolites, among total 391 metabolites identified, varied in response to salt and 42 metabolites responded to recovery specially. Transcriptomics data showed 1,742 in shoots and 3,281 in roots transcript varied in response to salt stress and 372 in shoots and 1,386 transcripts in roots responded specifically to recovery, but not salt stress. Finally, 95 transcripts and 1 metabolite are indicated as candidates involved in REC, photosynthesis, transpiration, and Na+ accumulation variation were revealed by using the principal component analysis (PCA) and correlation analysis. This study provides valuable information on peanut response to salt stress and recovery and may inspire further study to improve salt tolerance in peanut germplasm innovation.

Keywords: correlation analysis; metabolomics; peanut; recovery; salt stress; transcriptomics.


Figures

Figure 1
Figure 1
Leaf relative electric conductivity (REC) of peanut seedlings grown with various treatments. (A) The RECs of peanut seedlings under different NaCl concentration. Eighteen-day-old seedlings treated with 0, 50, 100, 150, 200, 250, 300, and 400 mM NaCl for 4 days. Data were pooled from at least two independent plant cultures with n ≥ 12 at each point. (B) The RECs of peanut seedlings in standard conditions (ST) and treated with 250 mM NaCl for 4 days (N4) or 7 days (N7), and recover from N4 for 3 days (R3). Data were pooled from three independent repeats with n ≥ 16 at each point. RECs (mean ± SE) were expressed as percentage of mean REC of plant grown in ST conditions. Different letters above the bars indicate significant difference at p < 0.05 as determined by one-way ANOVA followed by Tukey's test.
Figure 2
Figure 2
Na+ and K+ contents of shoots and roots in different treatments. Na+ and K+ were determined using an atomic absorption spectrophotometer and Na+ (A) and K+ (B) content (mg/gDW) were calculated with the shoots or roots dry weight in ST, N4, R3, and N7. Data were pooled from two independent repeats with n ≥ 6 at each point and values are means ± SE.
Figure 3
Figure 3
The net photosynthesis rate (Pn) (A) and transpiration rate (Tr) (B) of peanut leaves were measured in ST, N4, R3, and N7 conditions. Values are means ± SE from at least three independent biological replicates and different letters above the bars indicate significant difference at p < 0.05 as determined by one-way ANOVA followed by Tukey's test.
Figure 4
Figure 4
Categorization and variation of metabolites in response to salt stress and recovery. (A) All metabolites identified including 212 in shoots and 179 in roots and 130 shared in both tissues. (B) Salt stress response metabolites including 59 in shoots and 60 in roots with 27 varied in both tissues. (C) Totally, 91 varied metabolites in both shoots and roots were identified including 29.7% polyols, 28.6% amino acids, 22.0% organic acids, 9.9% amides, 5.5% imides, and 4.4% other metabolites. (D) Boxplot of salt stress response metabolite variation in N4 and R3 against ST or R3 conditions in shoots and roots, respectively. The dashdot line and solid line box represents data from shoots and roots, respectively. * and □ represents the extreme and mean values in each conditions, respectively. Data was from metabolite analysis from three biological and two technical replicates.
Figure 5
Figure 5
Different expression genes (DEGs) identified in N4 and R3 conditions. Salt stress response genes including salt stress induced and inhibited and the numbers of them recovered or not in R3 conditions in shoots (A) and roots (B). (C) the number of R3 specific response transcripts including induced and inhibited in shoots and roots.
Figure 6
Figure 6
GO classification analysis of DEGs in response to salt stress (A–C) and to recovery specifically (D–F). Varied transcripts were categorized into cellular component (A,D), molecular function (B,E), and biological process (C,F). (formula image) and (formula image
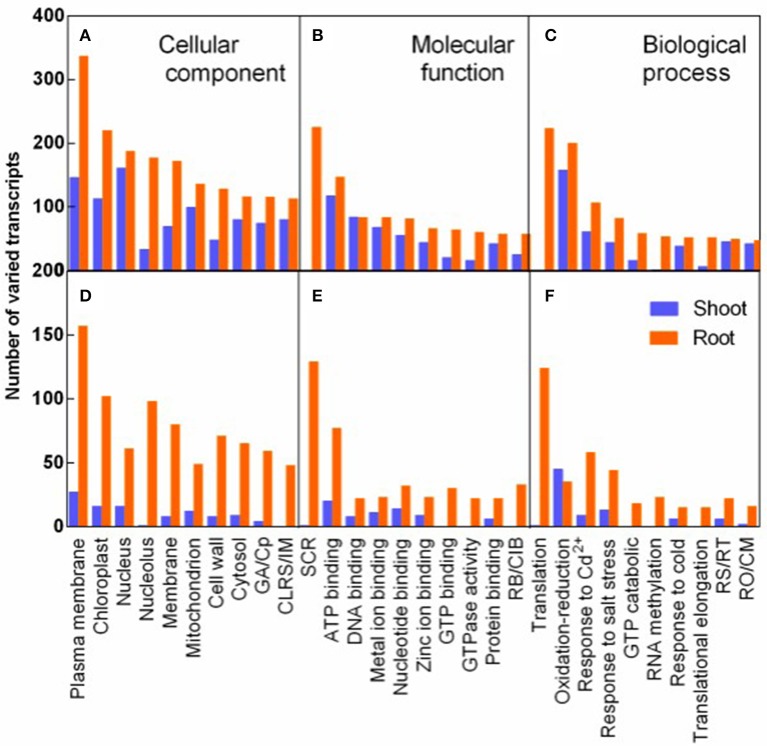
) represent varied transcripts in shoots and in roots, respectively. GA/Cp in represents Golgi apparatus term for D/Cytoplasm term for (A) in X-axis, respectively. CLRS/IM, Cytosolic large ribosomal subunit/Integral to membrane (A,D); SCR, Structural constituent of ribosome; RB/CIB, RNA binding/Copper ion binding (B,E). RS/RT, Response to stress/Regulation of translation; and RO/CM, Response to oxidative stress/Carbohydrate metabolic process (C,F).
Figure 7
Figure 7
The mostly enriched Kyoto Encyclopedia of Genes and Genomes (KEGG) pathway in roots. (A) The top 20 enriched pathway in salt stress conditions (N4 vs. ST) in roots. (B) The top 20 enriched pathway in salt stress recovery conditions (R3 vs. N4) in roots. The size and the color of solid circles represent the number of transcripts involved in the certain pathway and the significant value (Qvalue) of the rich factor, respectively.
Figure 8
Figure 8
PCA of the physiological, transcriptome and metabolome data from ST, N4, and R3. ANOVA (with FDR correction) was applied on the physiological/transcriptome/metabolome data separately. And further the variables (physiological measurement/transcript/ metabolite) with FDR-corrected p-value < 0.001 were selected for the PCA based on the ANOVA analysis.
Figure 9
Figure 9
A representative inferred network of plant physiological, metabolite and transcript variables based on Pearson correlation (p < 0.001). Na+/K+ ratio in shoots was positively linked to 11 transcripts and 1 metabolite and negatively linked to 8 transcripts. Thirteen and six transcripts positively and negatively linked to Na+ content in shoots, respectively. Nine transcripts shared the same correlation with both Na+/K+ ratio and Na+ content in shoots. The solid edge represents positive correlation and the dashed edge represents negative correlation.

References

    1. Amtmann A. (2009). Learning from evolution: Thellungiella generates new knowledge on essential and critical components of abiotic stress tolerance in plants. Mol. Plant 2, 3–12. 10.1093/mp/ssn094 - DOI - PMC - PubMed
    1. Arbona V., Manzi M., Ollas D.-C., Gómez-Cadenas A. (2013). Metabolomics as a tool to investigate abiotic stress tolerance in plants. Int. J. Mol. Sci. 14, 4885–4911. 10.3390/ijms14034885 - DOI - PMC - PubMed
    1. Arshi A., Ahmad A., Aref I. M., Iqbal M. (2010). Effect of calcium against salinity-induced inhibition in growth, ion accumulation and proline contents in Cichorium intybus L. J. Environ. Biol. 31, 939–944. - PubMed
    1. Benjamini Y., Hochberg Y. (1995). Controlling the false discovery rate: a practical and powerful approach to multiple testing. J. R. Stat. Soc. Ser. B 57, 289–300.
    1. Bies-Ethève N., Gaubier-Comella P., Debures A., Lasserre E., Jobet E., Raynal M., et al. (2008). Inventory, evolution and expression profiling diversity of the LEA (late embryogenesis abundant) protein gene family in Arabidopsis thaliana. Plant Mol. Biol. 67, 107–124. 10.1007/s11103-008-9304-x - DOI - PubMed