

P-glycoprotein Restricts Ocular Penetration of Loperamide across the Blood-Ocular Barriers: a Comparative Study in Mdr1a Knock-out and Wild Type Sprague Dawley Rats
- PMID: 29520587
- PMCID: PMC7325844
- DOI: 10.1208/s12249-018-0979-2
P-glycoprotein Restricts Ocular Penetration of Loperamide across the Blood-Ocular Barriers: a Comparative Study in Mdr1a Knock-out and Wild Type Sprague Dawley Rats
Abstract
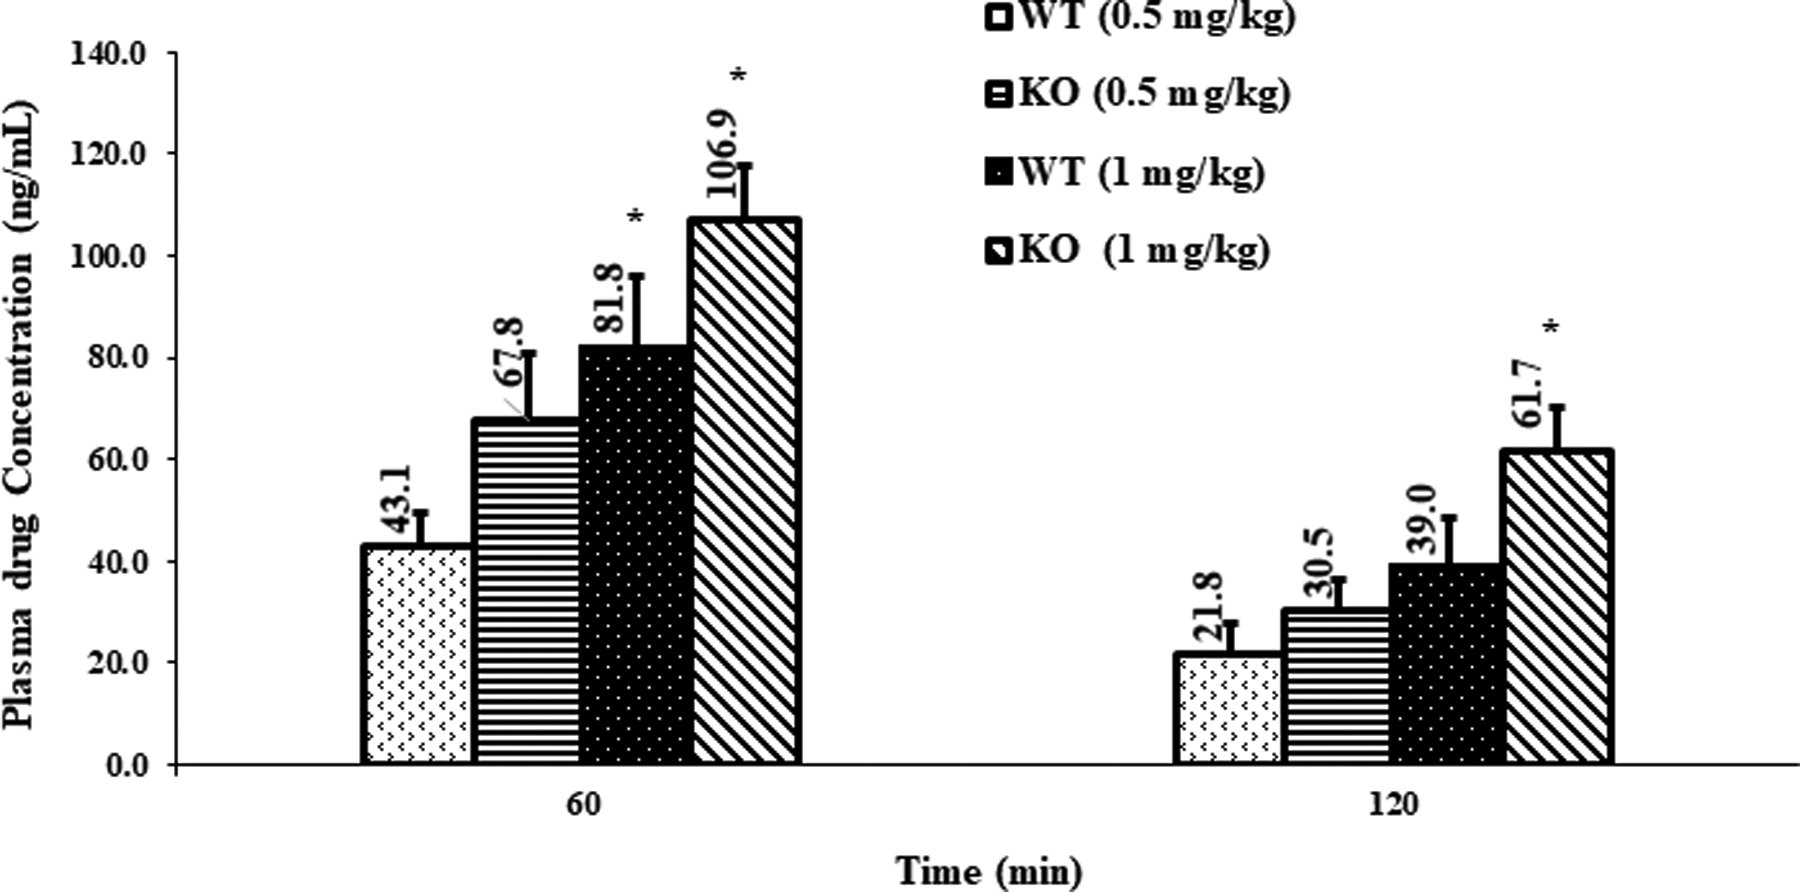
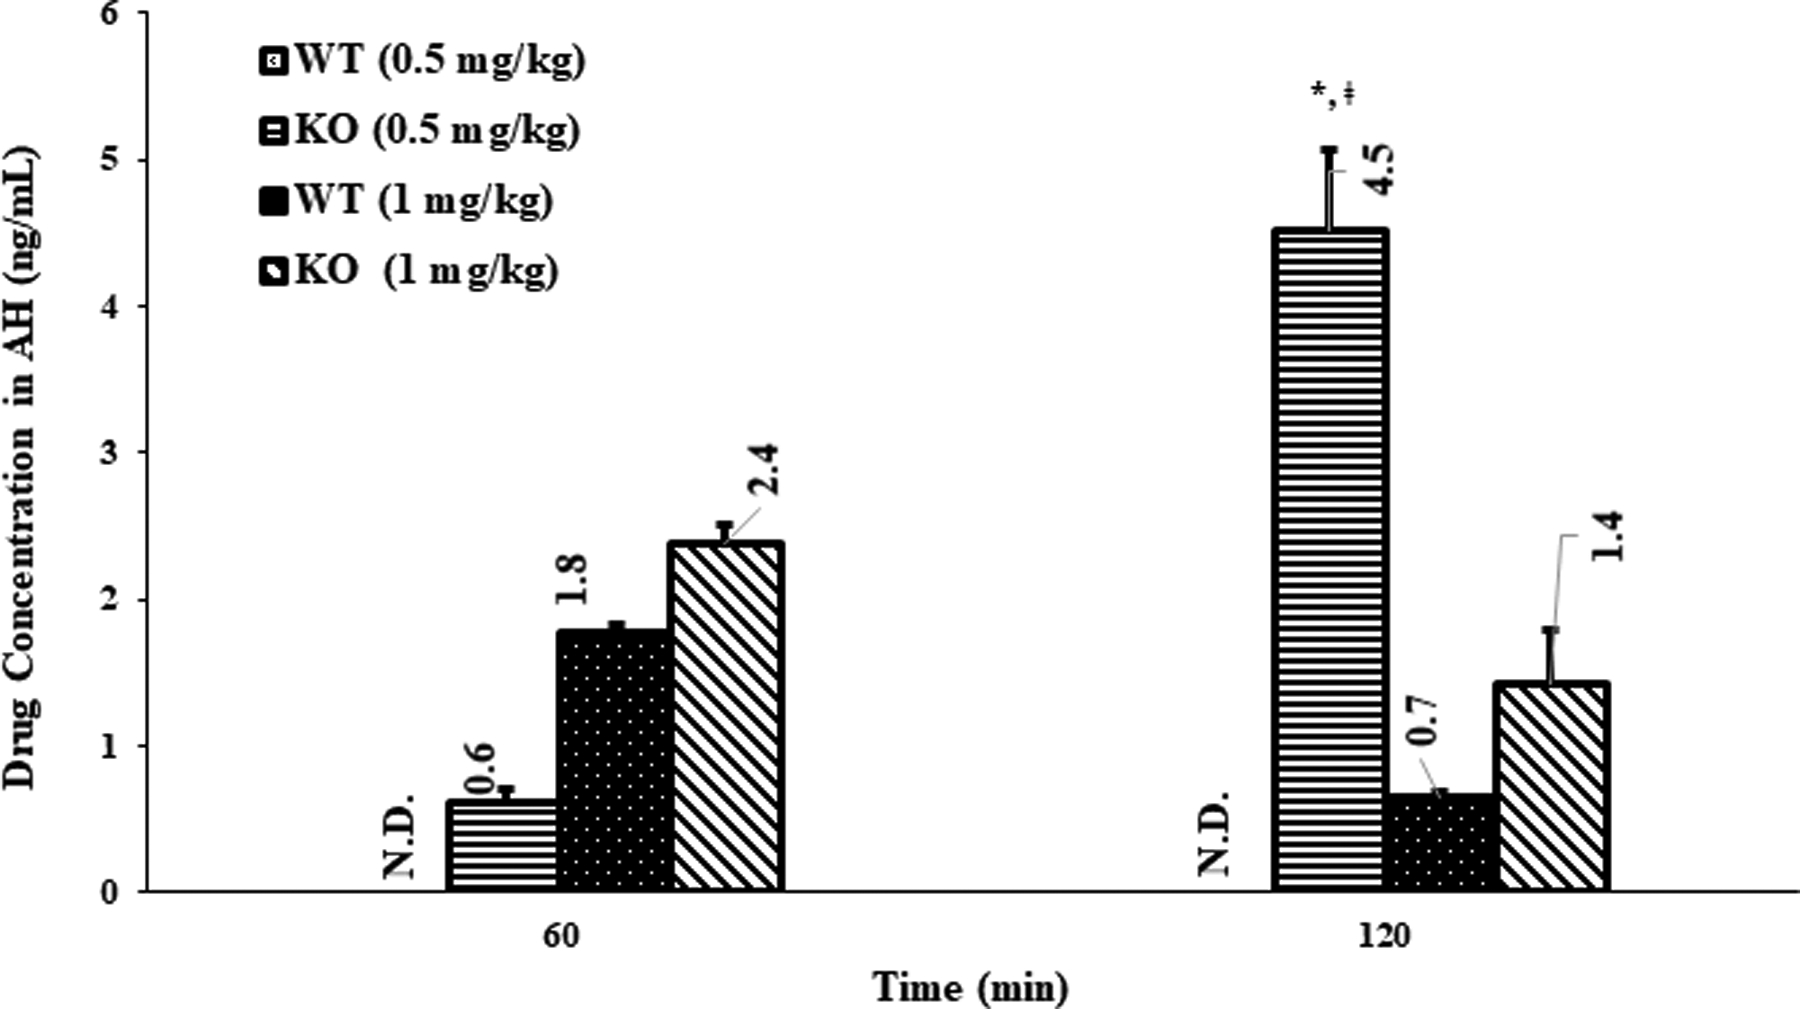
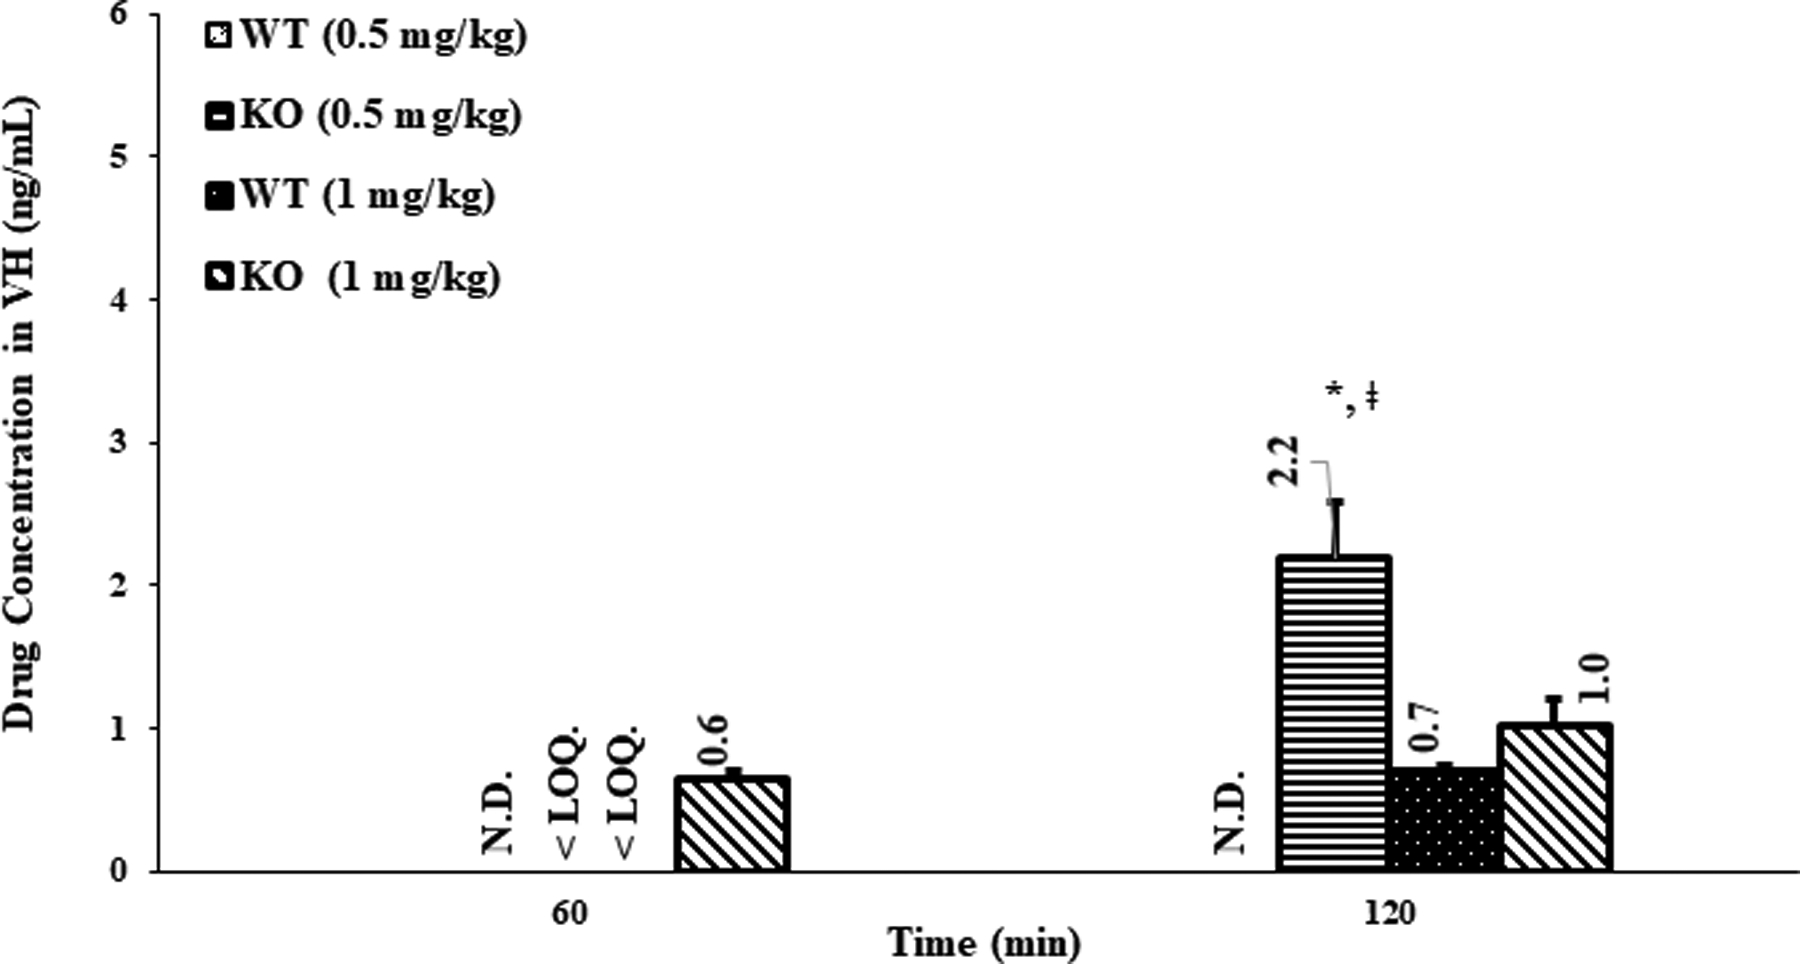
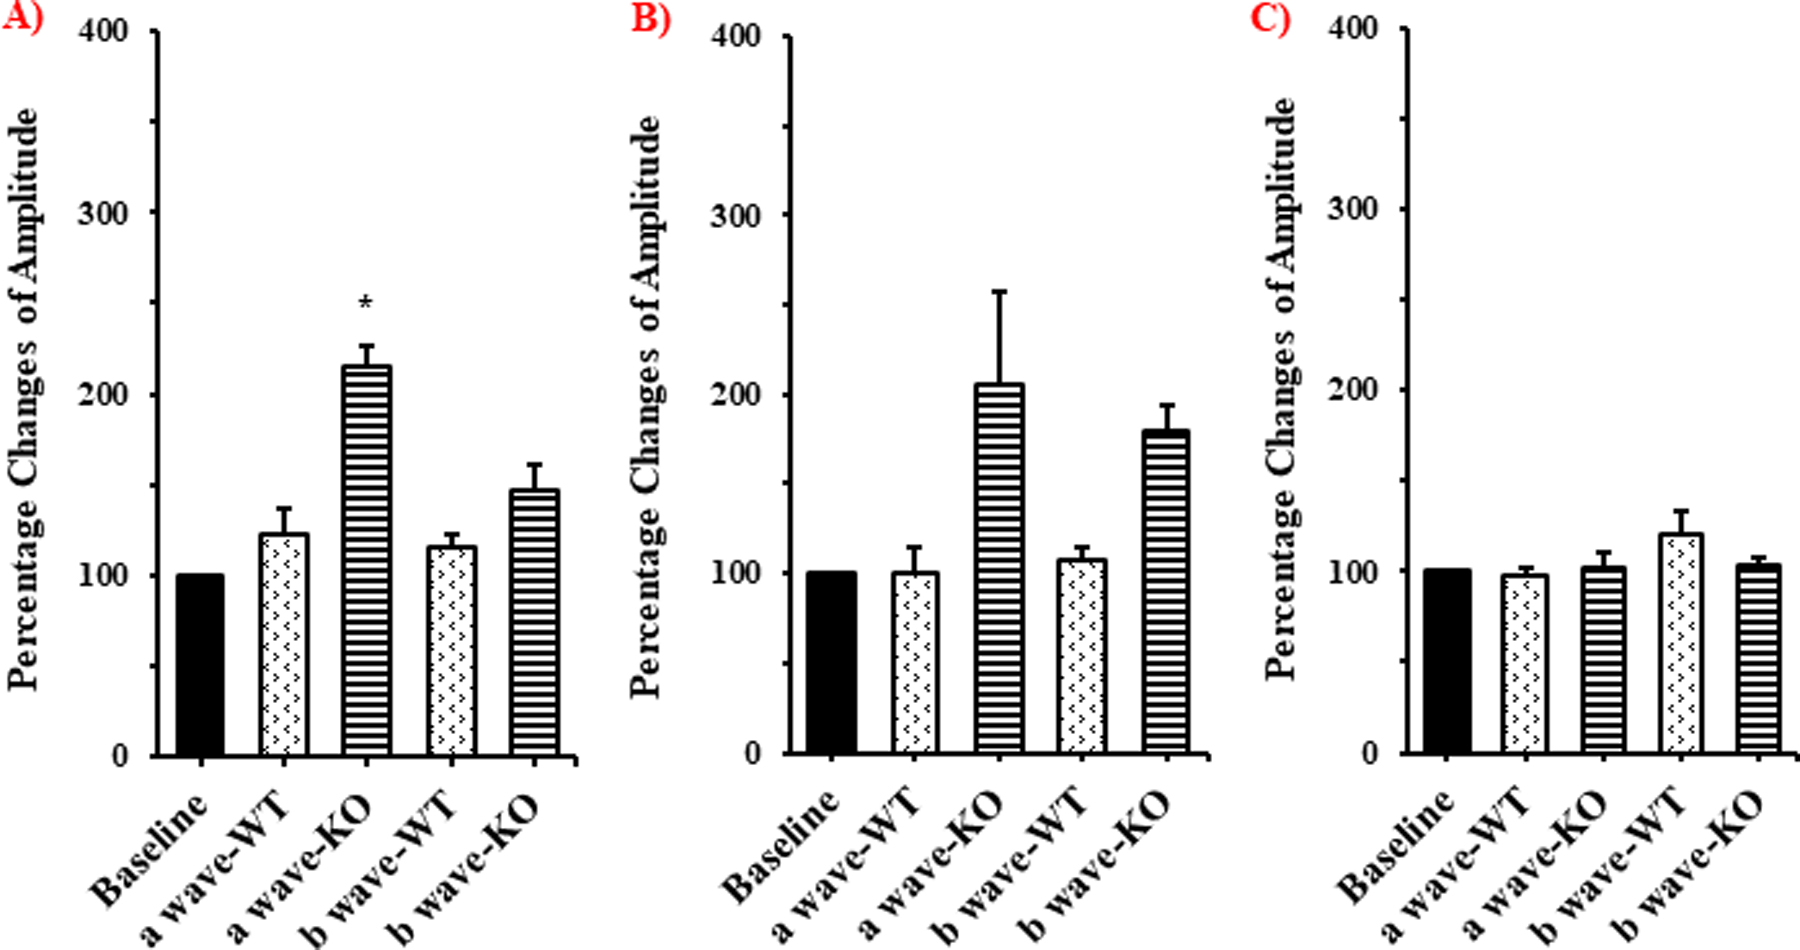
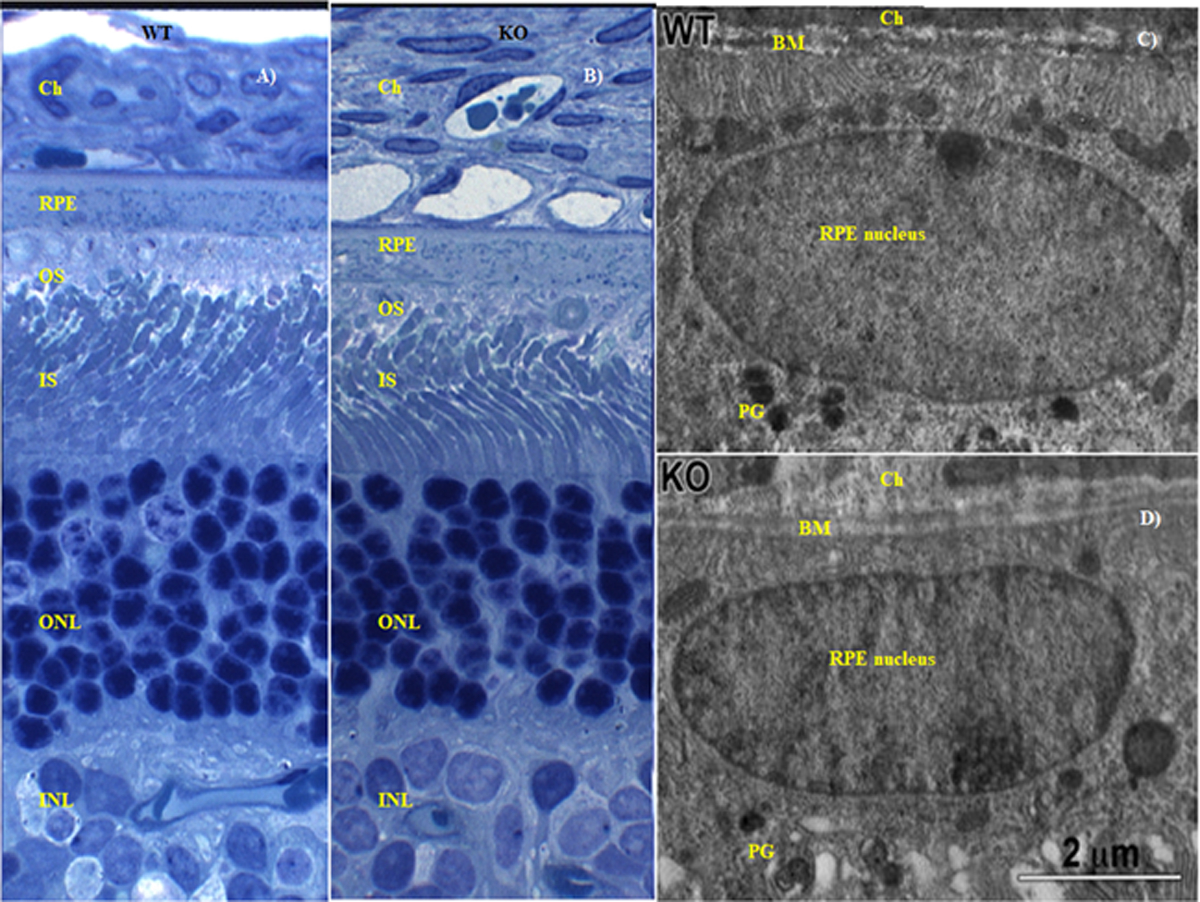
The current research was undertaken to determine the existence and magnitude of P-glycoprotein (P-gp) expression on the blood-ocular barriers by studying the ocular penetration of loperamide, a specific P-gp substrate, in P-gp (Mdr1a) knock-out (KO) and wild type (WT) Sprague Dawley rats. A clear, stable, sterile solution of loperamide (1 mg/mL), for intravenous administration, was formulated and evaluated. Ocular distribution was studied in P-gp KO and WT rats following intravenous administration of loperamide (at two doses). The drug levels in plasma, aqueous humor (AH), and vitreous humor (VH) samples were determined with the aid of UHPLC-Q-TOF-MS/MS, and the AH/plasma (D AH ) and VH/plasma (D VH ) distribution ratios were estimated. Electroretinography (ERG), ultrastructural analyses, and histology studies were carried out, in both KO and WT rats, to detect any drug-induced functional and/or structural alterations in the retina. Dose-related loperamide levels were observed in the plasma of both WT and KO rats. The loperamide concentrations in the AH and VH of KO rats were significantly higher compared to that observed in the WT rats, at the lower dose. However, a marked increase in the D AH and D VH was noted in the KO rats. ERG, ultrastructure, and histology studies did not indicate any drug-induced toxic effects in the retina under the test conditions. The results from these studies demonstrate that P-gp blocks the penetration of loperamide into the ocular tissues from the systemic circulation and that the effect is more pronounced at lower plasma loperamide concentrations.
Keywords: P-glycoprotein; blood-ocular barriers; electroretinography; ocular distribution; retinal pigmented epithelium.
Conflict of interest statement
Conflict of interest
The authors declare no conflicts of interest in this research.
Figures
References
-
- Aukunuru JV, Sunkara G, Bandi N, Thoreson WB, Kompella UB. Expression of Multidrug Resistance-Associated Protein (MRP) in Human Retinal Pigment Epithelial Cells and Its Interaction with BAPSG, a Novel Aldose Reductase Inhibitor. Pharm Res. 2001. May 1;18(5):565–572. - PubMed
-
- Kennedy BG, Mangini NJ. P-glycoprotein expression in human retinal pigment epithelium. Mol Vis. 2002. November 11;8:422–430. - PubMed
-
- Steuer H, Jaworski A, Elger B, Kaussmann M, Keldenich J, Schneider H, et al. Functional characterization and comparison of the outer blood-retina barrier and the blood-brain barrier. Invest Ophthalmol Vis Sci. 2005. March;46(3):1047–1053. - PubMed
-
- Cunha-Vaz JG. The blood-ocular barriers: past, present, and future. Doc Ophthalmol Adv Ophthalmol. 1997;93(1–2):149–157. - PubMed
-
- Cunha-Vaz JG. The blood–retinal barriers system. Basic concepts and clinical evaluation. Exp Eye Res. 2004. March 1;78(3):715–721. - PubMed
Publication types
MeSH terms
Substances
Grants and funding
LinkOut - more resources
Full Text Sources
Other Literature Sources
Research Materials
Miscellaneous
