

Editorial
doi: 10.1111/bph.14153.
Experimental design and analysis and their reporting II: updated and simplified guidance for authors and peer reviewers
Affiliations
- PMID: 29520785
- PMCID: PMC5843711
- DOI: 10.1111/bph.14153
Item in Clipboard
Editorial
Experimental design and analysis and their reporting II: updated and simplified guidance for authors and peer reviewers
Br J Pharmacol.
2018 Apr.
Abstract
This article updates the guidance published in 2015 for authors submitting papers to British Journal of Pharmacology (Curtis et al., 2015) and is intended to provide the rubric for peer review. Thus, it is directed towards authors, reviewers and editors. Explanations for many of the requirements were outlined previously and are not restated here. The new guidelines are intended to replace those published previously. The guidelines have been simplified for ease of understanding by authors, to make it more straightforward for peer reviewers to check compliance and to facilitate the curation of the journal's efforts to improve standards.
© 2018 The British Pharmacological Society.
Figures
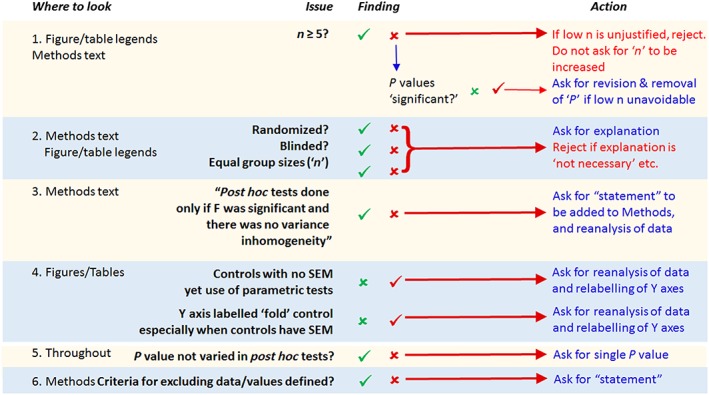
This flow chart describes how triage of the design and analysis aspects of a paper may be checked by authors and by peer reviewers.
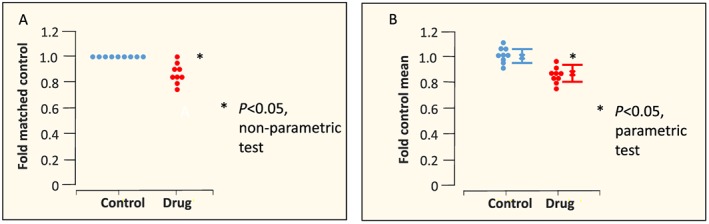
Parametric versus non‐parametric. Individual data points (circles), mean values (x) and SEM values are shown. In panel A, two datasets derived from an analysis (e.g. Western blotting) where each drug experiment included a matched (contemporaneous) control. A common practice is for each drug value to be normalized to each matched control value. This means that the control mean is 1, and there is no variance in the control. The correct way to analyse these data is using a non‐parametric statistical test, and the correct label for the Y axis is ‘fold matched control’. Because analysis is non‐parametric, it is misleading to show the parameter SEM. In panel B, each control and each drug value has been ‘normalized’ to the mean value of the control group (mean values shown as x). In other words, each raw value has been divided by the value of the mean of the control values. This generates a Gaussian dataset that can be analysed by parametric statistics (provided the variance is similar in the two groups ‐ a t‐test may falsely identify a nonsignificant difference if the two SEM values differ greatly ‐ see Figure 3), and if so, it is appropriate to show the SEM (error bars in the figure). However, there is actually no benefit in making this transformation since the ratio between each mean and each SEM is the same as the equivalent ratios for the raw data. In other words, this ‘transformation’ is identical to a relabelling or rescaling of the Y axis from the absolute raw values to new values for which the control mean value is relabelled as ‘1’. This has no effect on the ability of the parametric statistical test to detect a significant difference. However, readers have a tendency to make ‘eyeball’ comparisons between normalized datasets in the same paper or indeed from one paper to the next, and this may lead to false inferences. Thus, use of the normalization shown in panel A or presentation of the raw data (in units that may be arbitrary if this is the case) is preferred, although we acknowledge that for quantitative PCR, the ‘transformation’ depicted in panel B represents common practice at the present time. We also remind authors to ensure that whatever normalization is chosen, the Y axis is labelled correctly (fold control is not correct) and the appropriate type of statistical test is used.
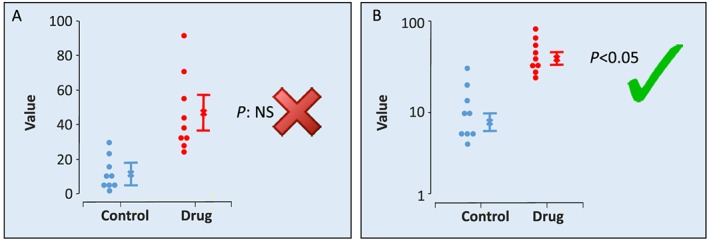
Data transformation. Individual data points (circles), mean values (x) and SEM values are shown. In panel A, owing to the large variance in the drug group, a t‐test identifies the two groups as not significantly different. However, closer examination shows this to be a false inference. The individual data values are not equally distributed around the arithmetic mean, and an arithmetic SEM should not be used to summarize the distribution. It is possible to analyse the data shown in panel A using a nonparametric statistical test (such as a U‐test), but nonparametric tests are less powerful than parametric tests, and their use can result in false negative findings. In panel B, the same data are log transformed, and the Y axis uses the log scale. Here, the SEM is no longer proportional to the mean, and the values are Gaussian distributed. It is appropriate to show the SEM. A t‐test correctly identifies a statistically significant difference between groups. This transformation unsettles some investigators as it appears to be a manipulation of data. However, in nature, many variables are log‐Gaussian distributed. Sound (decibels) and acidity (pH) are units on a log scale, used because the distribution is log Gaussian. In pharmacology, the pA2 and even the relationship between a response and a drug concentration are log‐Gaussian. This is why we express agonist and antagonist ‘affinity’ values as pKA and pKB, respectively, not K
A and K
B, and similarly so for EC50 or IC50 that should be expressed as pEC50 and pIC50. It should be no surprise that many other variables in biology are log‐Gaussian distributed (e.g. the number of ectopic beats occurring in experimental myocardial infarction). The key issue here is that authors and peer reviewers should look at figures to ensure that data like those in the left‐hand part of the figure are not included in a paper ‐ if they are the data should be re‐analysed.
Comment in
-
Some comments on the update to BJP guidance on experimental design and analysis.Br J Pharmacol. 2018 Sep;175(18):3638-3639. doi: 10.1111/bph.14442. Br J Pharmacol. 2018. PMID: 30144043 Free PMC article. No abstract available.
References
Publication types
MeSH terms
Grants and funding
LinkOut - more resources
Full Text Sources
Other Literature Sources
