

In search of appropriate measures of periodontal status: The Periodontal Profile Phenotype (P3 ) system
- PMID: 29520827
- PMCID: PMC6125155
- DOI: 10.1002/JPER.17-0424
In search of appropriate measures of periodontal status: The Periodontal Profile Phenotype (P3 ) system
Abstract
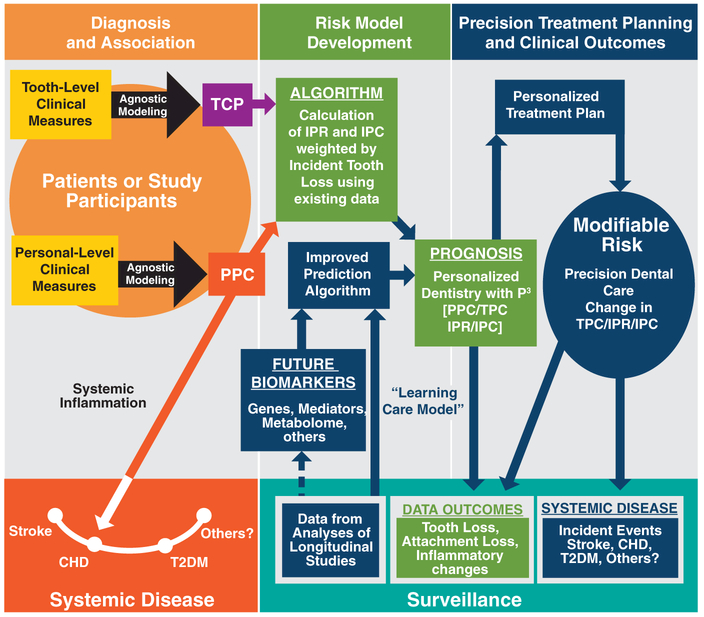
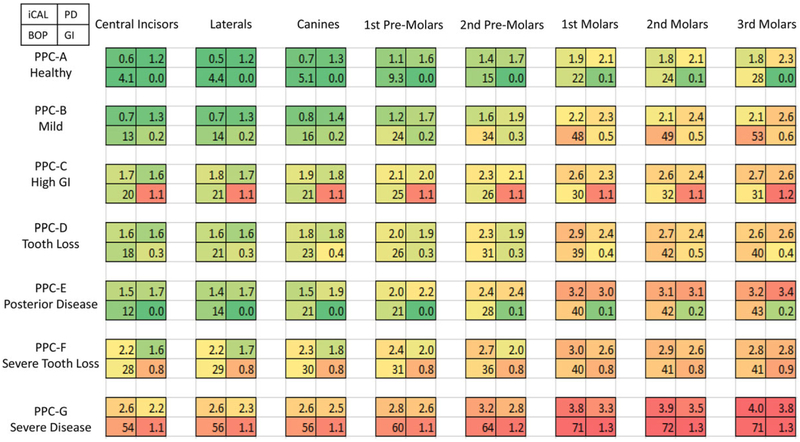
Background: This paper focuses on Periodontal Profile Class (PPC), a component of the Periodontal Profile Phenotype (P3 ) System that may be more representative of the periodontitis phenotype than current case definitions of periodontitis. Data illustrate the unique aspects of the PPC compared with other commonly used periodontal classification indices.
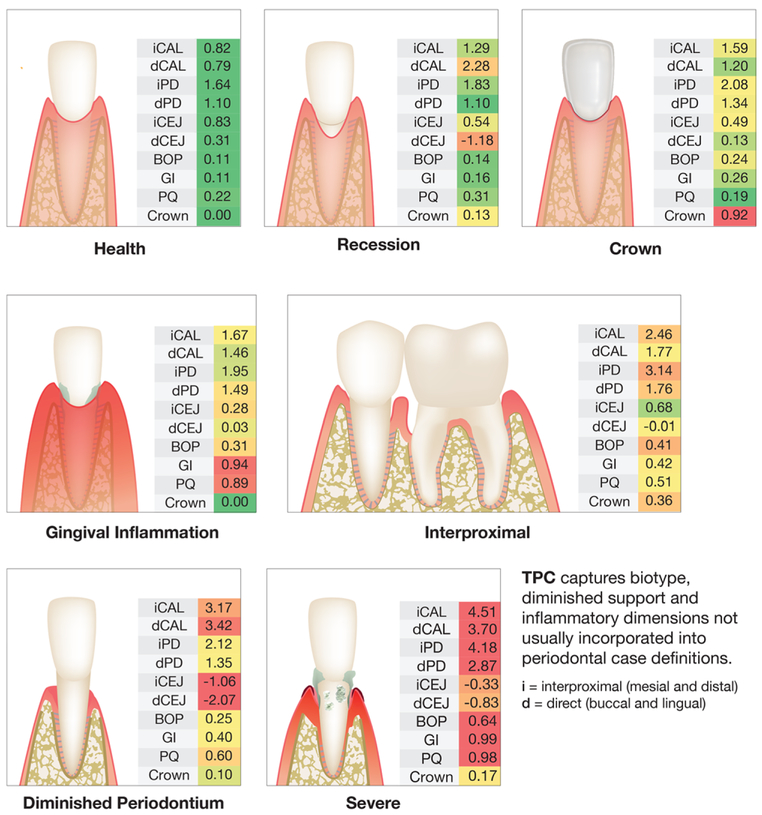
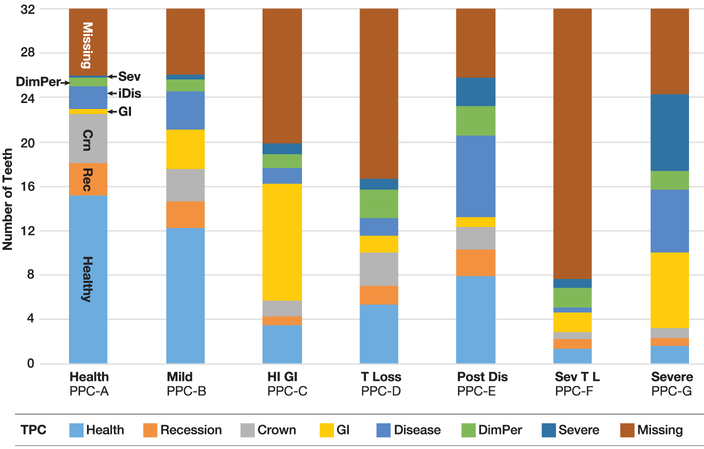
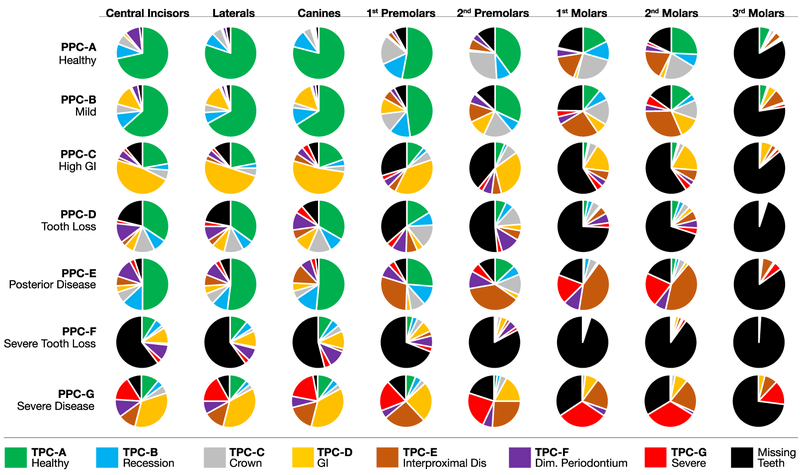
Methods: Latent Class Analysis (LCA) identified discrete classes of individuals grouped by tooth-level clinical parameters. The analysis defined seven distinct periodontal profile classes (PPC A through G) and seven distinct tooth profile classes (TPC A through G). This LCA classification was an entirely data-derived agnostic process without any preconceived presumptions of what constituted disease.
Results: Comparing the PPC with the Centers for Disease Control/American Academy of Periodontology (CDC/AAP) and European indices, the PPC is unique in that it contains four disease classes not traditionally used. Less than half of individuals classified as Healthy by both the CDC/AAP and European indices were Healthy using the PPC. About 25% of those classified as Severe by CDC/AAP and European indices were PPC-Severe. The remainder spread out over the High Gingival Index, Posterior Disease, Tooth Loss, and Severe Tooth Loss phenotypes.
Conclusions: The PPC classification provides a significant departure from the traditional clinical case status indices that have been used, but has resulted in clinical phenotypes that are quite familiar to most clinicians who take notice of the distribution of missing teeth, areas of recession, diminished periodontal support, and other aspects of the dentition while conducting a periodontal examination. The mutually exclusive categories provided by the PPC system provide periodontal clinical summaries that can be an important component of precision dentistry.
Keywords: Diagnosis; epidemiology; gingivitis; periodontitis.
© 2018 American Academy of Periodontology.
Figures
References
-
- The ARIC investigators. The Atherosclerosis Risk in Communities (ARIC) Study: design and objectives. Am J Epidemiol 1989;129:687–702. - PubMed
-
- Eke PI, Thornton-Evans GO, Wei L, Borgnakke WS, Dye BA. Accuracy of NHANES periodontal examination protocols. J Dent Res 2010;89:1208–1213. - PubMed
-
- Dye BA, Li X, Lewis BG, Iafolla T, Beltran-Aguilar ED, Eke PI. Overview and quality assurance for the oral health component of the National Health and Nutrition Examination Survey (NHANES), 2009–2010. J Public Health Dent 2014;74:248–256. - PubMed
Publication types
MeSH terms
Grants and funding
LinkOut - more resources
Full Text Sources
Other Literature Sources
Research Materials
Miscellaneous
