. 2018 Apr;244(4):445-459.
doi: 10.1002/path.5035. Epub 2018 Mar 9.

Protein kinase C zeta suppresses low- or high-grade colorectal cancer (CRC) phenotypes by interphase centrosome anchoring

Affiliations

Protein kinase C zeta suppresses low- or high-grade colorectal cancer (CRC) phenotypes by interphase centrosome anchoring

Ravi Kiran Deevi et al. J Pathol. 2018 Apr.

Abstract

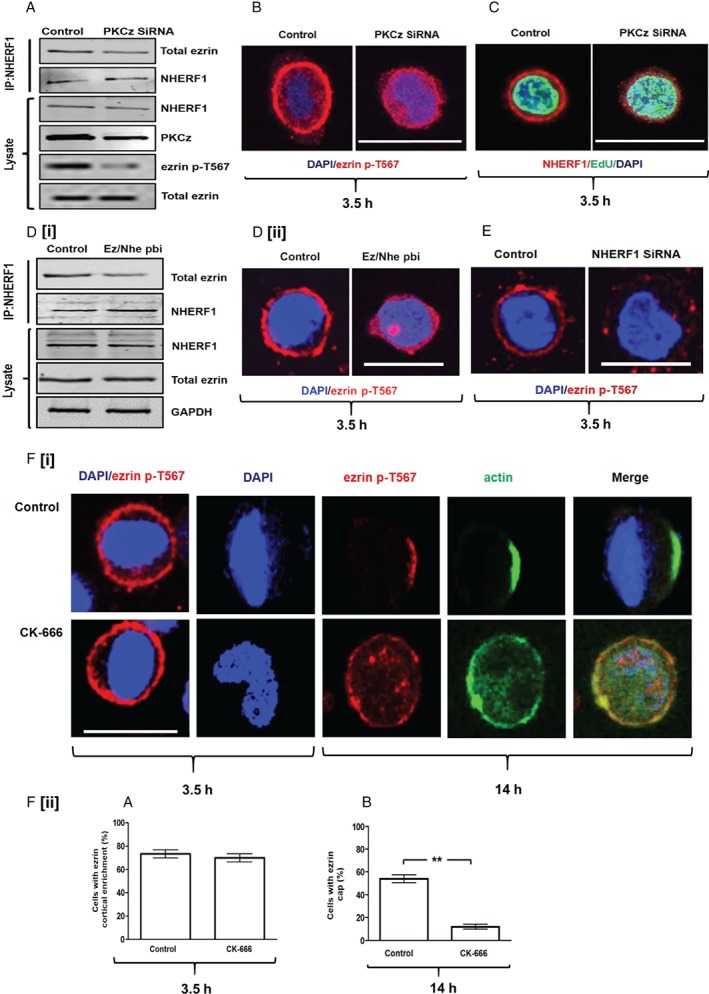
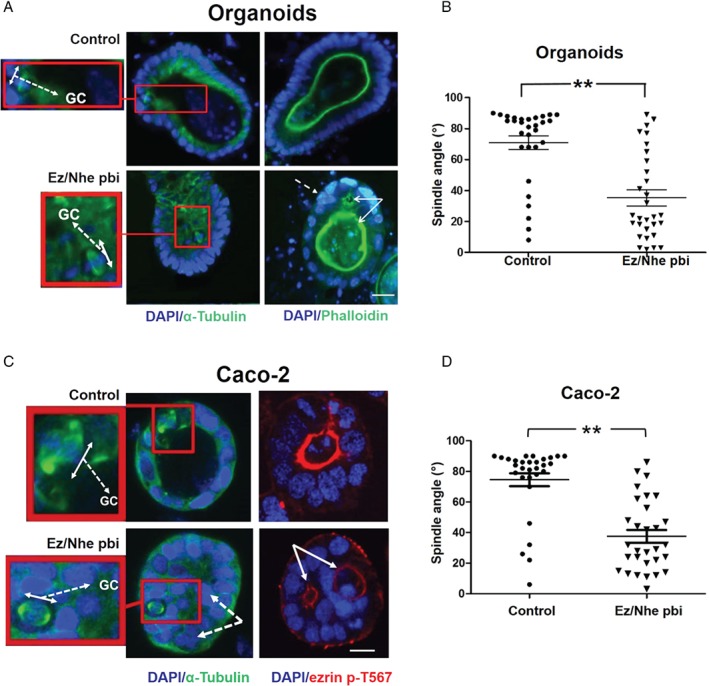
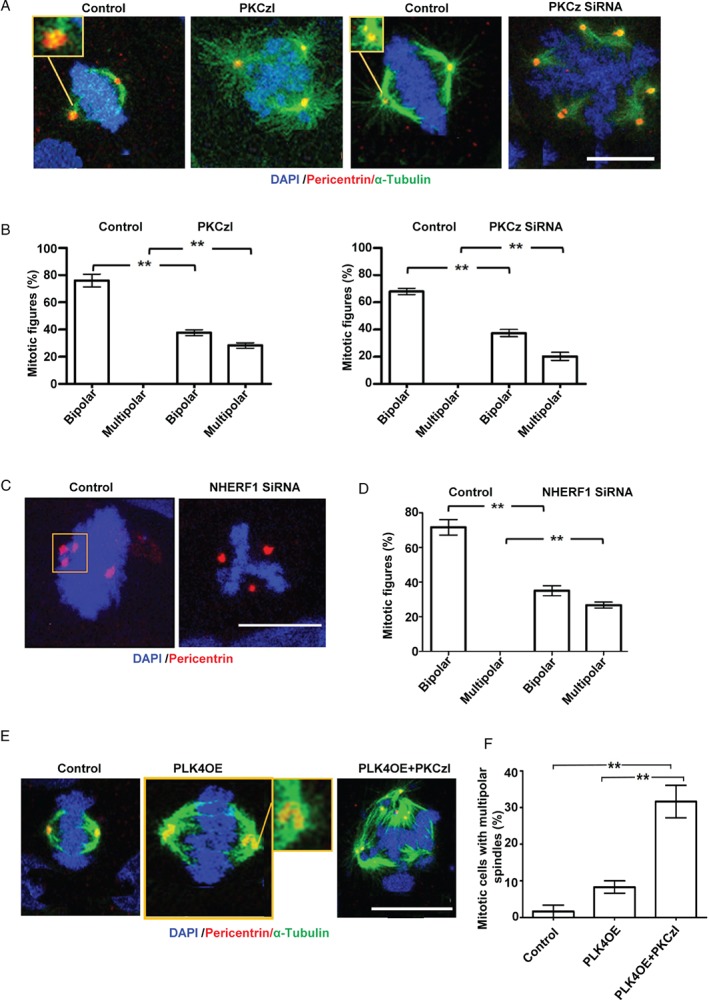
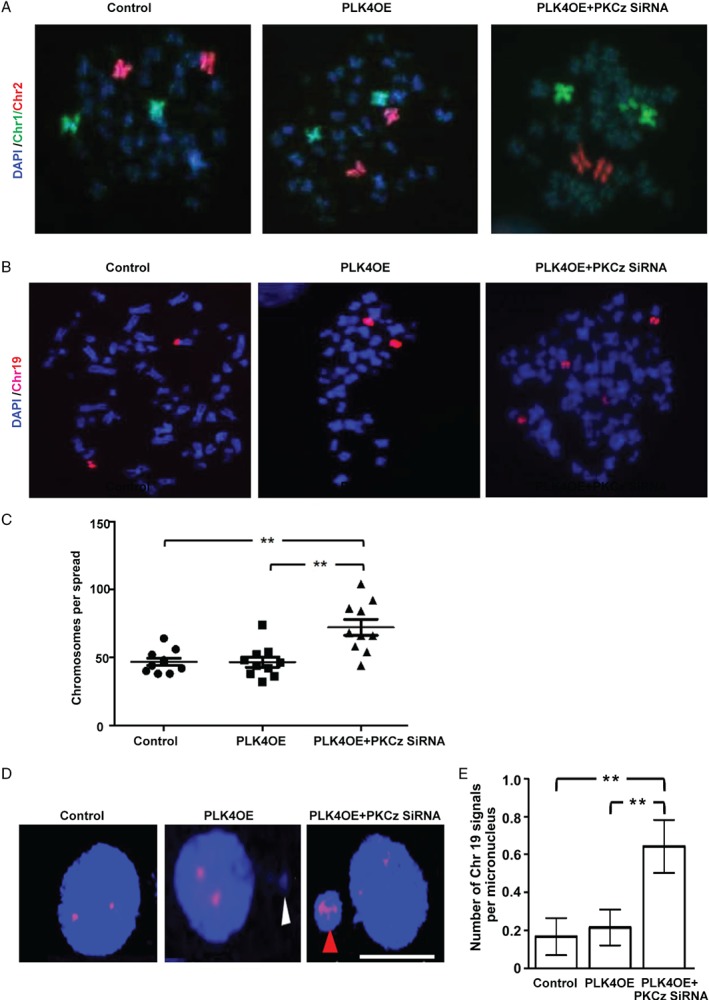
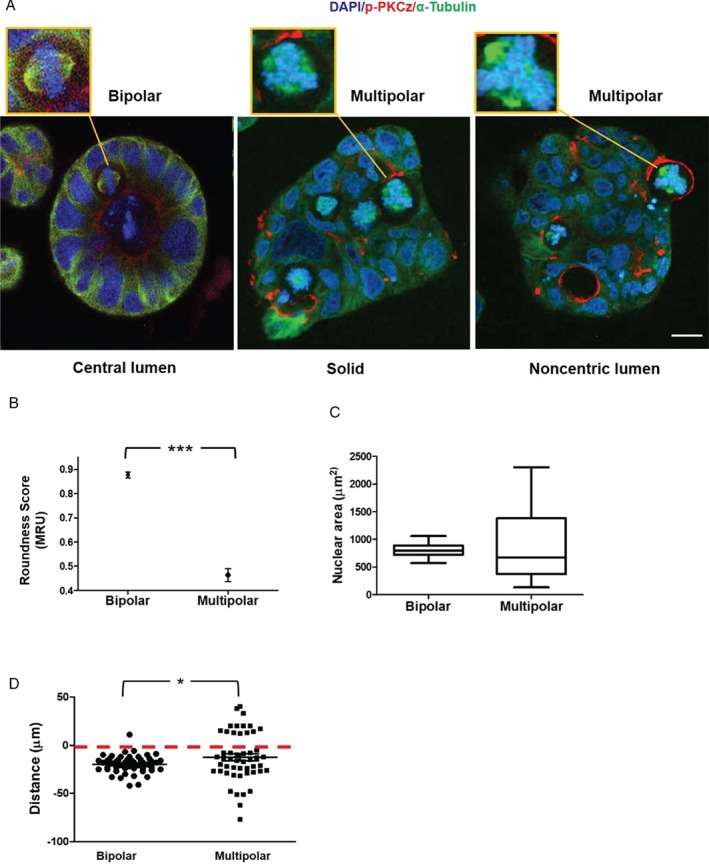
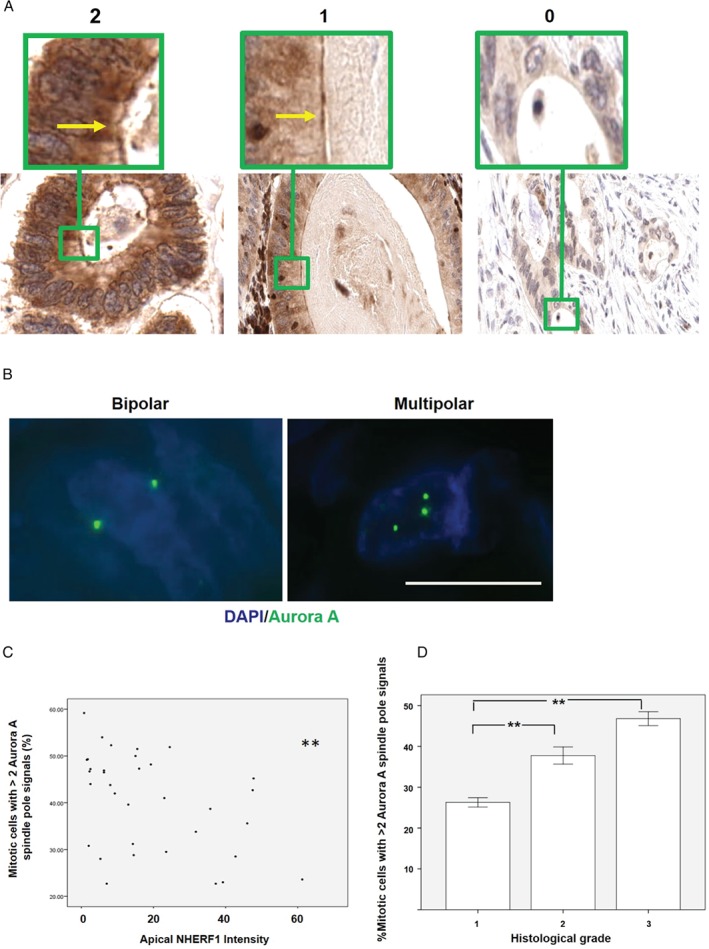
Histological grading provides prognostic stratification of colorectal cancer (CRC) by scoring heterogeneous phenotypes. Features of aggressiveness include aberrant mitotic spindle configurations, chromosomal breakage, and bizarre multicellular morphology, but pathobiology is poorly understood. Protein kinase C zeta (PKCz) controls mitotic spindle dynamics, chromosome segregation, and multicellular patterns, but its role in CRC phenotype evolution remains unclear. Here, we show that PKCz couples genome segregation to multicellular morphology through control of interphase centrosome anchoring. PKCz regulates interdependent processes that control centrosome positioning. Among these, interaction between the cytoskeletal linker protein ezrin and its binding partner NHERF1 promotes the formation of a localized cue for anchoring interphase centrosomes to the cell cortex. Perturbation of these phenomena induced different outcomes in cells with single or extra centrosomes. Defective anchoring of a single centrosome promoted bipolar spindle misorientation, multi-lumen formation, and aberrant epithelial stratification. Collectively, these disturbances induce cribriform multicellular morphology that is typical of some categories of low-grade CRC. By contrast, defective anchoring of extra centrosomes promoted multipolar spindle formation, chromosomal instability (CIN), disruption of glandular morphology, and cell outgrowth across the extracellular matrix interface characteristic of aggressive, high-grade CRC. Because PKCz enhances apical NHERF1 intensity in 3D epithelial cultures, we used an immunohistochemical (IHC) assay of apical NHERF1 intensity as an indirect readout of PKCz activity in translational studies. We show that apical NHERF1 IHC intensity is inversely associated with multipolar spindle frequency and high-grade morphology in formalin-fixed human CRC samples. To conclude, defective PKCz control of interphase centrosome anchoring may underlie distinct categories of mitotic slippage that shape the development of low- or high-grade CRC phenotypes. © 2018 The Authors. The Journal of Pathology published by John Wiley & Sons Ltd on behalf of Pathological Society of Great Britain and Ireland.

Keywords: centrosome; chromosomal instability; colorectal neoplasms; protein kinase C; spindle apparatus.


Figures

Figure 1
Figure 1
Dynamics of ezrin cap formation. (A) Co‐immunoprecipitation (CoIP) assays of total ezrin binding to NHERF1 in Caco‐2 cells transfected by control non‐targeting (NT) siRNA or PKCz siRNA. (B) Ezrin p‐T567 cortical recruitment in Caco‐2 cells transfected by control (NT) or PKCz siRNA. Assays at 3.5 h after plating. (C) NHERF1 cortical recruitment in Caco‐2 cells transfected by control (NT) or PKCz siRNA. For all cortical recruitment studies, cells were synchronized in G0/G1. At 3.5 h, most cells expressed the S‐phase marker EdU. Fifty EdU‐expressing cells were randomly selected and assessed in triplicate for each experimental condition. (D[i]) Co‐immunoprecipitation assays of total ezrin/NHERF1 interaction in Caco‐2 cells treated with a scrambled peptide (control) or the ezrin/NHERF1 peptide binding inhibitor (Ez/Nhe pbi). (D[ii]) Confocal assays of ezrin p‐T567 cortical enrichment in Caco‐2 cells treated with scrambled peptide (control) or Ez/Nhe pbi at 3.5 h after plating. (E) Confocal assays of ezrin p‐T567 cortical enrichment in Caco‐2 cells transfected by control non‐targeting (NT) siRNA versus NHERF1 siRNA KD at 3.5 h after plating. (F[i]) CK‐666 treatment (100 μm 36) effects on ezrin cortical recruitment at 3.5 h (column 1) and on ezrin and actin cortical cap formation at 14 h (columns 2–5). (F[ii]) (A) Summary effects of CK‐666 versus vehicle only control on ezrin p‐T567 cortical recruitment at 3.5 h (p = NS) and (B) on ezrin cap formation at 14 h (**p = 0.01). Analysis by paired Student's t‐test. Staining: DAPI (blue), ezrin p‐T567 (red), NHERF1 (red), EdU (green), actin (green). Scale bar = 20 μm.
Figure 2
Figure 2
Effects of ezrin/NHERF1 interaction on multicellular morphogenesis. (A) Intestinal organoids. The left and right panels were stained to show mitotic spindle architecture and lumen formation, respectively. The left panels show bipolar spindle orientation in control and Ez/Nhe pbi‐treated organoids. High‐power spindle views (insets with red border) show the orientation angles (interrupted white arrows) of spindle planes (double‐headed white arrows) towards gland centres (GC). The right panels show lumen formation and epithelial configurations in control versus Ez/Nhe pbi‐treated organoids. Multiple lumens and early epithelial stratification are indicated by solid and interrupted white arrows, respectively, in Ez/Nhe pbi‐treated organoid cultures. (B) Summary spindle angles relative to GCs in control versus Ez/Nhe pbi‐treated organoids shown in A. **p < 0.01; paired Student's t‐test (n = 30 mitotic cells per experimental group). (C) Organotypic 3D Caco‐2 cultures. The left and right panels are stained to show mitotic spindle architecture and lumen formation, respectively. The left panels show bipolar spindle orientation in control and Ez/Nhe pbi‐treated Caco‐2 cultures. High‐power spindle views (insets with red border) show orientation angles (interrupted white arrows) of spindle planes (double‐headed white arrows) towards gland centres (GC). The right panels show lumen formation and epithelial configurations in control versus Ez/Nhe pbi‐treated Caco‐2 cultures. Multiple lumens and epithelial stratification are indicated by solid and interrupted white arrows, respectively, in Ez/Nhe pbi‐treated Caco‐2 cultures. (D) Summary spindle angles relative to GCs in control versus Ez/Nhe pbi‐treated Caco‐2 cultures shown in C. **p < 0.01. Analyses by paired Student's t‐test (n = 30 mitotic cells per experimental group). Staining: DAPI (blue), α‐tubulin (green), phalloidin (green), ezrin p‐T567 (red). Scale bar = 20 μm. Assays at 4 days of culture.
Figure 3
Figure 3
Effects of PKCz on mitotic spindle architecture in cells with extra centrosomes. (A) Centrosome clustering (insets with yellow borders) and spindle architecture in control, PKCzI‐treated (1 μm) or PKCz siRNA‐transfected Caco‐2 cells. (B) Summary mitotic spindle architecture data in control versus PKCzI‐treated Caco‐2 cells shown in A (bipolar: **p = 0.001; multipolar: **p = 0.002) and in control (NT siRNA) versus PKCz siRNA‐transfected Caco‐2 cells shown in A (**p = 0.002 for bipolar and multipolar). (C) Centrosome clustering (inset) in control versus NHERF1 siRNA‐transfected Caco‐2 cells. (D) Summary spindle architecture data in control versus NHERF1 siRNA‐transfected Caco‐2 cells shown in C (bipolar: **p = 0.002; multipolar: **p = 0.001). (E) Centrosome clustering (insets) and spindle architecture in control, PLK4OE, and PLK4OE + PKCzI‐treated Caco‐2 cells. (F) Summary multipolar spindle architecture data in control, Caco‐2 versus PLK4OE versus PLK4OE + PKCzI‐treated cells shown in E; Caco‐2 versus PLK4OE versus PLK4OE + PKCzI‐treated cells shown in E, **p < 0.001; control versus PLK4OE = NS, ANOVA, Tukey's post hoc test (n = 100 mitotic cells in triplicate, expressed as %). Monopolar or indeterminate mitotic figures were counted but not analysed. Staining: DAPI (blue), pericentrin (red), α‐tubulin (green). Scale bars = 20 μm.
Figure 4
Figure 4
Effects of PKCz on chromosome segregation in cells with extra centrosomes. (A) Chromosome (Chr) 1 (green) and 2 (red) signals in control Caco‐2 transfected with empty vector only versus PLK4OE versus PLK4OE + PKCz siRNA‐transfected Caco‐2 cells. Chromosome fluorophores were counterstained against the DAPI DNA stain (blue). Note 2 × Chr1 and 2 × Chr2 signals in control and PLK4OE cells but 3 × Chr1 signals in Caco‐2 PLK4OE + PKCz siRNA‐transfected cells. We analysed 20 spreads per experimental condition. We found >2 Chr1 and/or >2 Chr2 signals in 1/20 control Caco‐2 and Caco‐2 PLK4OE spreads each. However, 4/20 Caco‐2 PLK4OE‐PKCz siRNA spreads showed >2 Chr1 and/or >2 Chr2 signals on FISH assay. (B) Chromosome 19 (red) signals in control Caco‐2 versus PLK4OE versus PLK4OE + PKCz siRNA‐transfected Caco‐2 cells (n = 30 cells per spread). We found >2 Chr19 signals in 9/30 control Caco‐2, 10/30 PLK4OE, and 14/30 Caco‐2 PLK4OE + PKCz siRNA‐transfected Caco‐2 cells. (C) Total chromosome number per spread in control Caco‐2 versus PLK4OE versus PLK4OE + PKCz siRNA‐transfected Caco‐2 cells, **p < 0.01; ANOVA; Tukey's post hoc test; control Caco‐2 versus PLK4OE = NS (n = 10 spreads per experimental condition). (D) Chromosome 19 (red) signals and micronuclei in control Caco‐2 versus PLK4OE versus PLK4OE + PKCz siRNA‐transfected Caco‐2 cells. Micronuclei lacking or containing a Chr19 signal are indicated by white or red arrowheads, respectively. (E) Summary of Chr19 signals per micronucleus in control Caco‐2 versus PLK4OE versus PLK4OE + PKCz siRNA‐transfected Caco‐2 cells, **p = 0.011; ANOVA with Tukey's post hoc test (Caco‐2 control versus Caco‐2 PLK4OE = NS). Scale bar = 20 μm.
Figure 5
Figure 5
Relationships between mitotic spindle geometry and multicellular morphology in 3D organotypic CRC cultures. (A) Confocal assays of spindle architecture (insets) and multicellular morphology in 3D organotypic cultures. Control Caco‐2 cultures with appropriately orientated bipolar spindles (left panel) had regular 3D morphology with single central lumens surrounded by a uniform apical membrane and columnar epithelial monolayers. SiRNA knockdown of PKCz in 3D Caco‐2 PLK4OE cultures induced multipolar spindle formation and solid cell‐filled 3D structures with dispersed apical membrane foci. These cultures either lacked any lumen (middle panel) or had aberrant noncentric lumens lying outwith gland centres, surrounded by atypical epithelium (right panel). Cells with multipolar spindles extended across the basal interface with extracellular matrix (ECM) more frequently than cells with bipolar spindles (see D). (B) Nuclear ‘roundness’ scores in glands with bipolar versus multipolar spindles. ***p < 0.001; paired Student's t‐test. A score of 1 MRU denotes a perfect circle 70 (n = 60 cells from glands containing bipolar or multipolar spindles). (C) Range of nuclear size in glands with bipolar versus multipolar spindles (p < 0.01; Levene's test; n = 30 bipolar or multipolar cells). (D) Summary extension of cells with bipolar or multipolar spindles across the ECM interface (denoted by red interrupted line). Distances between spindle midpoints and the ECM interface were assessed. Positive or negative values were assigned for direction of extensions into or away from the ECM, respectively. Positive distance values (into the ECM) in multipolar versus bipolar spindles = 14/50 versus 1/50; *p = 0.03; paired Student's t‐test. Staining: DAPI blue, for nuclear DNA; p‐PKC red, for apical membranes, α‐tubulin green, for microtubules. Assays at 4 days of 3D culture.
Figure 6
Figure 6
Translational studies in archival colorectal cancer. (A) IHC assay of NHERF1 apical expression in archival CRC. Sections at 50× objective magnification with scores of 2, 1, and 0, respectively. Apical localization of NHERF1 is indicated by yellow arrows in high‐power insets (green borders). (B) Cells with 2 or >2 Aurora A spindle pole signals in archival CRC sections indicative of bipolar or multipolar spindles, respectively 46. Objective magnification ×63. Staining: DAPI (blue), Aurora A (green). (C) Relationship between multipolar spindle formation (mitotic cells with >2 Aurora A spindle pole signals) and apical NHERF1 intensity (r = − 0.452); **p = 0.007; Pearson's test; Aurora A spindle pole signals assessed by IF in 180 ± 72 mitotic cells per tumour section in 35 CRCs. (D) Relationship between multipolar spindle frequency and cancer grade, **p = 0.005. ANOVA; Tukey's post hoc test. Multipolar spindles assessed as % of all mitotic figures. Scale bar = 20 μm.

Similar articles

Cited by

References

    1. Arnold M, Sierra MS, Laversanne M, et al Global patterns and trends in colorectal cancer incidence and mortality. Gut 2017; 66 : 683–691. - PubMed
    1. Nicholl ID, Dunlop MG. Molecular markers of prognosis in colorectal cancer. J Natl Cancer Inst 1999; 91 : 1267–1269. - PubMed
    1. Jass JR, Atkin WS, Cuzick J, et al The grading of rectal cancer: historical perspectives and a multivariate analysis of 447 cases. Histopathology 1986; 10 : 437–459. - PubMed
    1. Ueno H, Hase K, Hashiguchi Y, et al Site‐specific tumor grading system in colorectal cancer: multicenter pathologic review of the value of quantifying poorly differentiated clusters. Am J Surg Pathol 2014; 38 : 197–204. - PubMed
    1. Walther A, Houlston R, Tomlinson I. Association between chromosomal instability and prognosis in colorectal cancer: a meta‐analysis. Gut 2008; 57 : 941–950. - PubMed

Publication types

MeSH terms