. 2018 Mar 9;16(9):1595-1615.
doi: 10.1111/pbi.12898. Online ahead of print.

A Vitis vinifera basic helix-loop-helix transcription factor enhances plant cell size, vegetative biomass and reproductive yield

Affiliations

A Vitis vinifera basic helix-loop-helix transcription factor enhances plant cell size, vegetative biomass and reproductive yield

Sung Don Lim et al. Plant Biotechnol J. .

Abstract

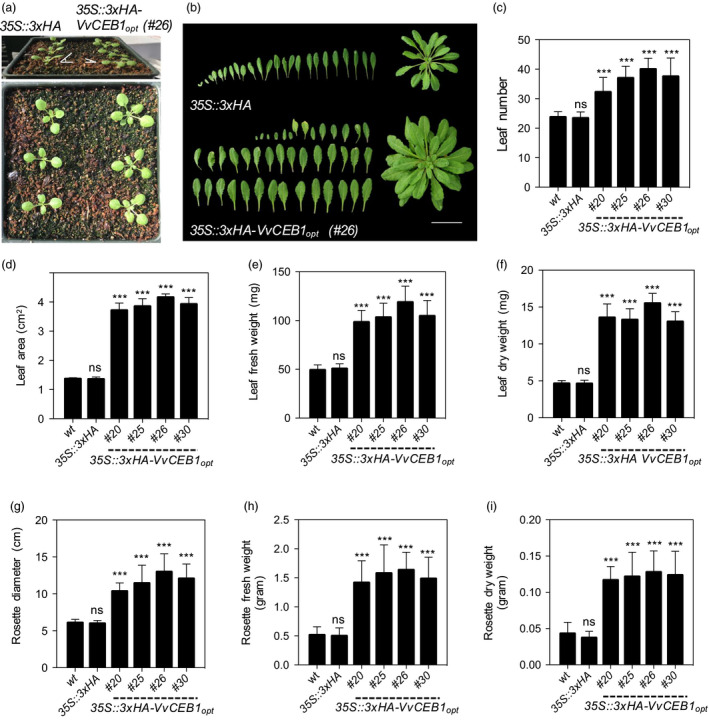
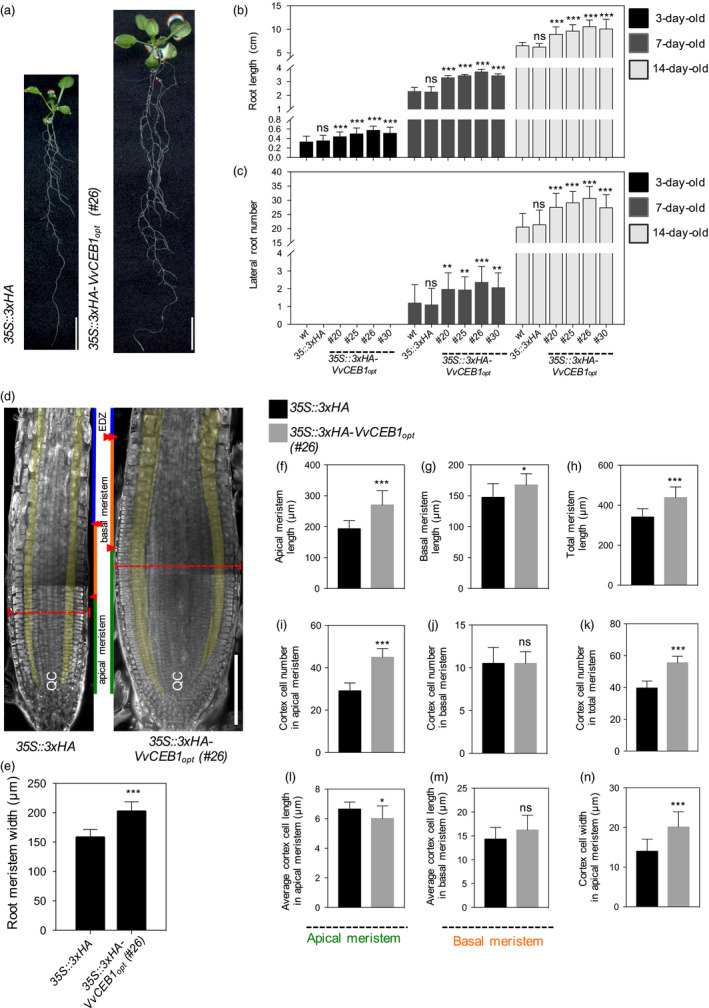
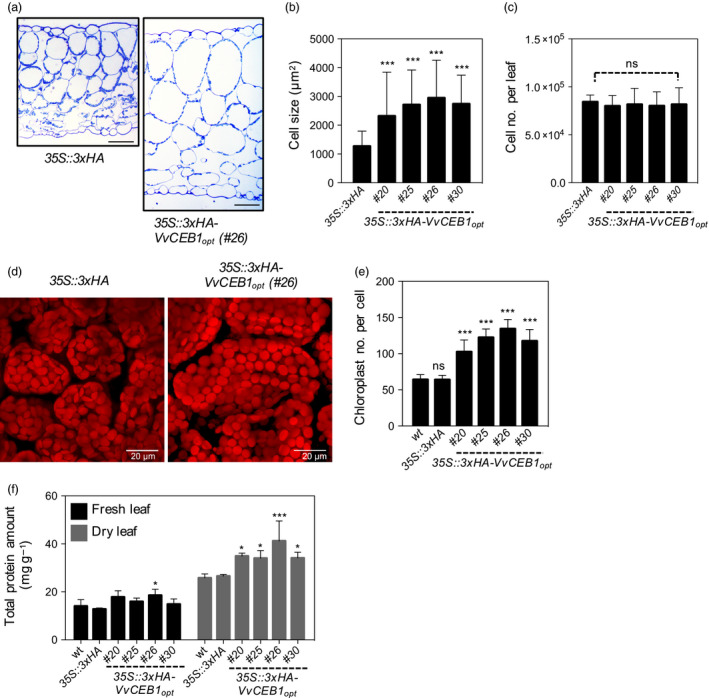
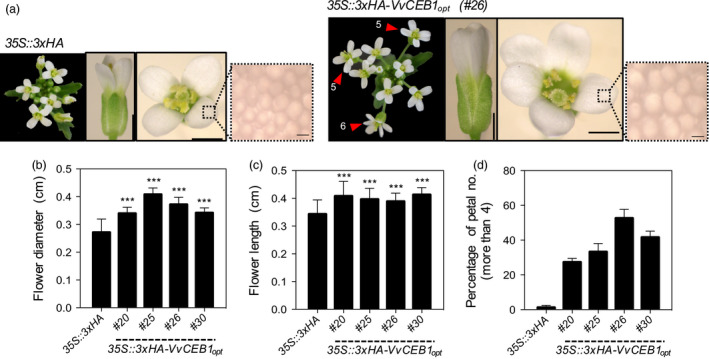
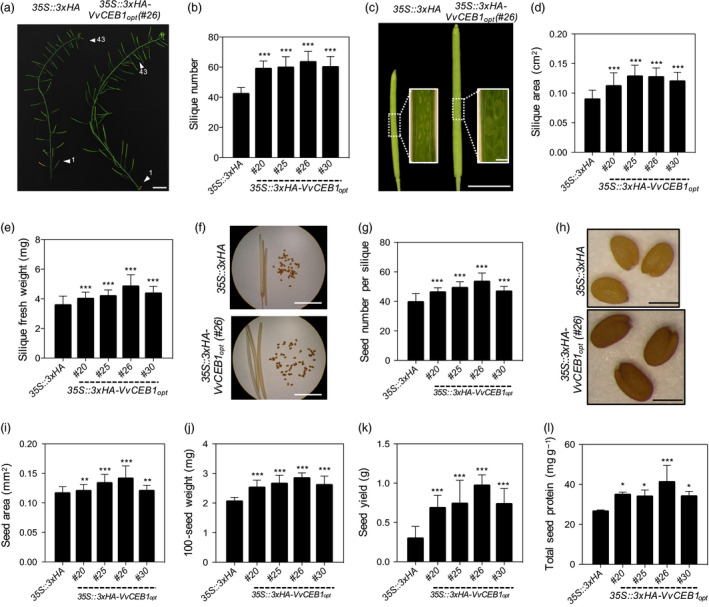
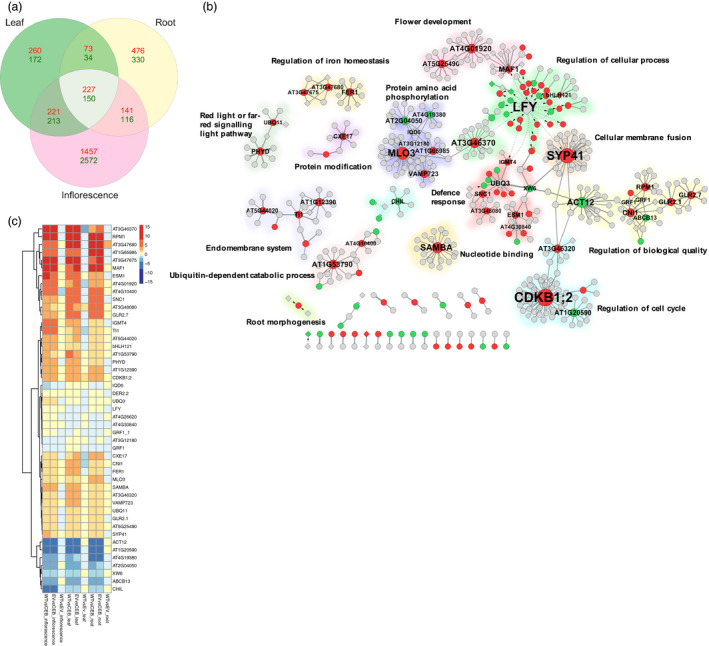
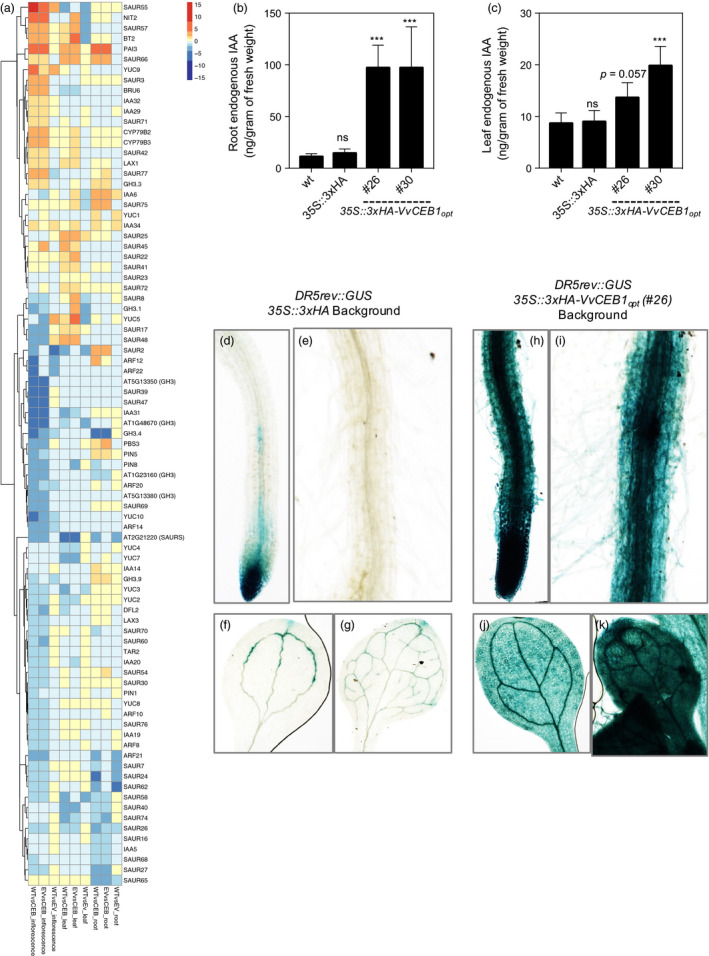
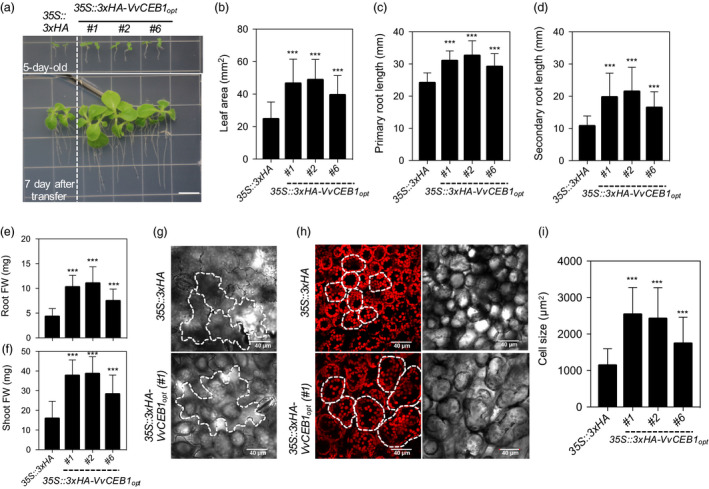
Strategies for improving plant size are critical targets for plant biotechnology to increase vegetative biomass or reproductive yield. To improve biomass production, a codon-optimized helix-loop-helix transcription factor (VvCEB1opt ) from wine grape was overexpressed in Arabidopsis thaliana resulting in significantly increased leaf number, leaf and rosette area, fresh weight and dry weight. Cell size, but typically not cell number, was increased in all tissues resulting in increased vegetative biomass and reproductive organ size, number and seed yield. Ionomic analysis of leaves revealed the VvCEB1opt -overexpressing plants had significantly elevated, K, S and Mo contents relative to control lines. Increased K content likely drives increased osmotic potential within cells leading to greater cellular growth and expansion. To understand the mechanistic basis of VvCEB1opt action, one transgenic line was genotyped using RNA-Seq mRNA expression profiling and revealed a novel transcriptional reprogramming network with significant changes in mRNA abundance for genes with functions in delayed flowering, pathogen-defence responses, iron homeostasis, vesicle-mediated cell wall formation and auxin-mediated signalling and responses. Direct testing of VvCEB1opt -overexpressing plants showed that they had significantly elevated auxin content and a significantly increased number of lateral leaf primordia within meristems relative to controls, confirming that cell expansion and organ number proliferation were likely an auxin-mediated process. VvCEB1opt overexpression in Nicotiana sylvestris also showed larger cells, organ size and biomass demonstrating the potential applicability of this innovative strategy for improving plant biomass and reproductive yield in crops.

Keywords: Arabidopsis thaliana; auxin; basic helix-loop-helix transcription factor; biomass production; cell expansion; delayed flowering.


Conflict of interest statement

The authors have no conflict of interests to declare.

Figures

Figure 1
Figure 1
Vv CEB1opt overexpression increases biomass in Arabidopsis. (a) Seedling images (1‐week‐old) of the 35S::3xHA empty‐vector control line and VvCEB1 opt ‐overexpressing line (#26). (b) Leaf and rosette images (4‐week‐old) of the 35S::3xHA empty‐vector line and VvCEB1 opt ‐overexpressing line (#26). Scale bar, 5 cm. (c) Comparison of leaf number (= 15). (d) Leaf area of fifth leaf (= 10). (e) Leaf fresh weight (= 12). (f) Leaf dry weight (= 12). (g) Rosette diameter (= 20). (h) Rosette fresh weight (= 12). (i) Rosette dry weight (= 12). Values represent means ± SD, ns = non‐significant, ***< 0.001, one‐way anova with Dunnett's multiple comparison test.
Figure 2
Figure 2
Vv CEB1opt overexpression increases root biomass in Arabidopsis. (a) Root images of 35S::3xHA empty‐vector control line and VvCEB1 opt ‐overexpressing line (#26). Scale bar, 1 cm. (b) Comparison of primary root length (= 30). (c) Lateral root number (= 30). (d) Images of root meristems of 35S::3xHA empty‐vector control line and VvCEB1 opt ‐overexpressing line (#26). Orange broken lines indicate root meristem widths. Green, orange and blue lines represent the lengths of the apical meristem, the basal meristem and the elongation/differentiation zone, respectively. Single and double arrowheads indicate the borders of the apical meristem and basal meristem, respectively (Hacham et al., 2011). The cortex cell layers are pseudo‐coloured in yellow. QC indicates the quiescent centre. Scale bar, 150 μm. (e) Comparison of root meristem width (= 16). Quantification of (f) apical meristem length, (g) basal meristem length and (h) total meristem length (= 12). Quantification of (i) cortical cell number in apical meristem zone, (j) cortical cell number in basal meristem zone and (k) total cortical cell number (= 12). Average cortical cell number in (l) apical meristem zone and (m) basal meristem zone (= 12). (n) Cortical cell width in apical meristem zone (= 120). Values represent means ± SD, ns = non‐significant, *< 0.05, **< 0.01 and ***< 0.001, one‐way anova with Dunnett's multiple comparison test (b and c) and Student's t‐test (e–n).
Figure 3
Figure 3
Vv CEB1opt overexpression increases cell size in Arabidopsis. (a) Transverse sections of leaves from the 35S::3xHA empty‐vector control line and VvCEB1 opt ‐overexpressing line (#26). Scale bar, 100 μm. (b) Palisade mesophyll cell size (= 110). (c) Mesophyll cell number per fifth fully expanded leaf (= 10). (d) Images of palisade mesophyll cells and chloroplasts of 35S::3xHA empty‐vector control line and Vv CEB1opt‐overexpressing line (#26). Scale bar, 20 μm. (e) Chloroplast number per palisade mesophyll cell (= 30). (f) Total protein amount of fifth leaves on a fresh or dry weight basis (= 4). Values represent means ± SD, ns = non‐significant, *< 0.05, **< 0.01 and ***< 0.001, one‐way anova with Dunnett's multiple comparison test.
Figure 4
Figure 4
Vv CEB1opt overexpression increases flower size and number of petals and sepals in Arabidopsis. (a) Representative images of the inflorescence apex, flower and petal epidermis cell (left to right) of the 35S::3xHA empty‐vector control and VvCEB1 opt ‐overexpressing lines (#26). Magnified images represent petal epidermal cells. Numbers indicate number of flower petals >4. Scale bars indicate 0.1, 0.1 cm and 10 μm (left to right), respectively. (b) Flower diameter was measured top view petal tip‐to‐petal tip (= 63). (c) Flower length was measured side view (= 63). (d) Percentage of flowers with petal numbers >4 (= 3). Values represent means ± SD, ***< 0.001, one‐way anova with Dunnett's multiple comparison test.
Figure 5
Figure 5
VvCEB1opt overexpression increases size of reproductive structures and seed yield in Arabidopsis. (a) Representative images of primary inflorescence stem of the 35S::3xHA empty‐vector control line and the VvCEB1 opt ‐overexpressing line (#26). Arrowheads indicate 1st and 43rd silique from rosette leaf. Scale bar, 1.5 cm. (b) Silique number within primary inflorescence (= 20). (c) Representative images of fully developed siliques of the 35S::3xHA empty‐vector control line and VvCEB1 opt ‐overexpressing line (#26). Scale bar, 0.5 cm. Scale bar in inset images, 0.5 mm. (d) Silique area (= 50). (e) Silique fresh weight (= 40). (f) Representative images of seed number per dried silique of the 35S::3xHA empty‐vector control line and VvCEB1 opt ‐overexpressing line (#26). Scale bar, 0.5 cm. (g) Seed number per silique (= 30). (h) Representative seed images of the 35S::3xHA empty‐vector control line and VvCEB1 opt ‐overexpressing line (#26). Scale bar, 0.5 mm. (i) Seed area (= 100). (j) 100‐seed weight (= 30). (k) Seed yield per plant (= 10). (i) Total seed protein (= 4). Values represent means ± SD, *< 0.05, **< 0.01 and ***< 0.001, one‐way anova with Dunnett's multiple comparison test.
Figure 6
Figure 6
Functional network analysis of the mRNA gene expression in VvCEB1opt‐overexpressing lines compared with control lines. (a) Three‐way Venn diagram analysis of RNA‐Seq reads revealed distinct expression patterns between leaves, roots and inflorescence tissues. Numbers of genes that are differentially expressed between the Col‐0 wild‐type and 35S::3xHA empty‐vector control lines and the VvCEB1 opt ‐overexpressing line (#26) as determined by two or more methods (e.g. DESeq2, edgeR, ROTS and voom) with ≥twofold increase (red) or decrease (green) in relative transcript abundances and a false discovery rate (FDR) of less than 0.001. (b) Protein–protein and transcriptional regulatory network of differentially expressed genes shared among leaves, roots and inflorescences as determined by edgeR. Gene nodes with increased, decreased or unchanged mRNA expression are indicated by red, green or grey circles, respectively. The node size indicates the degree of connectivity of nodes. Nodes indicated by diamonds represent TFs. The edges shown in solid or dotted lines represent protein–protein or regulatory interactions, respectively. Arrows indicate activation, and short bars represent repression. Network modules enriched for gene ontology biological process terms are highlighted with different colours. (c) Heat map of hierarchical clustering analysis of networked genes with high connectivity (≥4) based on their topology coefficients representing similarities in gene expression profiles across all organ types as determined by edgeR. The colour scale indicates log2‐fold changes in mRNA abundance.
Figure 7
Figure 7
Vv CEB1opt overexpression increased auxin accumulation in Arabidopsis. (a) Heat map of hierarchical clustering analysis of manually curated genes with functions related to auxin biosynthesis, perception, transport and response. Indole‐3‐acetic acid (IAA) content in (b) roots and (c) leaves of wild‐type (wt), 35S::3xHA empty‐vector (EV) and 35S::VvCEB1 opt lines (= 5). Values represent means ± SD, ns = non‐significant, ***P < 0.01, one‐way anova with Dunnett's multiple comparison test. Expression of DR5rev::GUS in 35S::3xHA empty‐vector (EV) line: (d) root tip, (e) mature root region and root hairs, (f) cotyledon and (g) 1st leaf of EV control plant. Expression of DR5rev::GUS in Ox‐VvCEB1 opt line (#26): (h) root tip, (i) mature root region and root hairs, (j) cotyledon and (k) 1st leaf of 10‐day‐old seedlings.
Figure 8
Figure 8
Vv CEB1opt overexpression increases overall plant size by increasing cell size in N. sylvestris (flowering tobacco). (a) Representative images of the 35S::3xHA empty‐vector (EV) line and the 35S::3xHA‐VvCEB1 opt transgenic tobacco plants. Seeds (T1) were grown for 5 days on half‐strength MS medium containing kanamycin (200 mg/L) and transferred to kanamycin‐free half‐strength MS medium (top panel) and grown for 7 days (lower panel). Bar = 1 cm. (b) Quantification of the 1st leaf area (= 40). (c) Quantification of primary root length (= 40). (d) Quantification of the secondary root length (= 40). (e) Quantification of the root fresh weight (FW) (= 30). (f) Quantification of the shoot fresh weight (= 30). (g) Lower epidermis cell(s) of the EV and the VvCEB1 opt ‐overexpressing lines. White dotted lines indicate the shape of cells. (h) Palisade mesophyll cell(s) and chlorophyll autofluorescence of the EV and the VvCEB1 opt ‐overexpressing lines. White dotted lines indicate the shape of cells. (i) Quantification of the palisade mesophyll cell size (= 60). Values represent means ± SD and ***P < 0.001, one‐way anova with Dunnett's multiple comparison test.

Similar articles

Cited by

References

    1. Arumuganathan, K. and Earle, E. D. (1991) Estimation of nuclear DNA content of plants by flow cytometry. Plant Mol. Biol. Rep. 9, 229–241.
    1. Bader, G. D. and Hogue, C. W. (2003) An automated method for finding molecular complexes in large protein interaction networks. BMC Bioinformatics 4, 2. - PMC - PubMed
    1. Bardou, P. , Mariette, J. , Escudié, F. , Djemiel, C. and Klopp, C. (2014) jvenn: an interactive Venn diagram viewer. BMC Bioinformatics 15, 293. - PMC - PubMed
    1. Barragán, V. , Leidi, E.O. , Andrés, Z. , Rubio, L. , De Luca, A. , Fernández, J.A. , Cubero, B. et al. (2012) Ion exchangers NHX1 and NHX2 mediate active potassium uptake into vacuoles to regulate cell turgor and stomatal function in Arabidopsis . Plant Cell, 24, 1127–1142. - PMC - PubMed
    1. Bauer, P. , Ling, H. and Guerinot, M. (2007) FIT, the FER‐like iron deficiency induced transcription factor in Arabidopsis . Plant Physiol. Biochem. 45, 260–261. - PubMed

LinkOut - more resources