. 2018 Apr 17;90(8):5032-5039.
doi: 10.1021/acs.analchem.7b04713. Epub 2018 Mar 30.

Accurate, Sensitive, and Precise Multiplexed Proteomics Using the Complement Reporter Ion Cluster

Affiliations

Accurate, Sensitive, and Precise Multiplexed Proteomics Using the Complement Reporter Ion Cluster

Matthew Sonnett et al. Anal Chem. .

Abstract

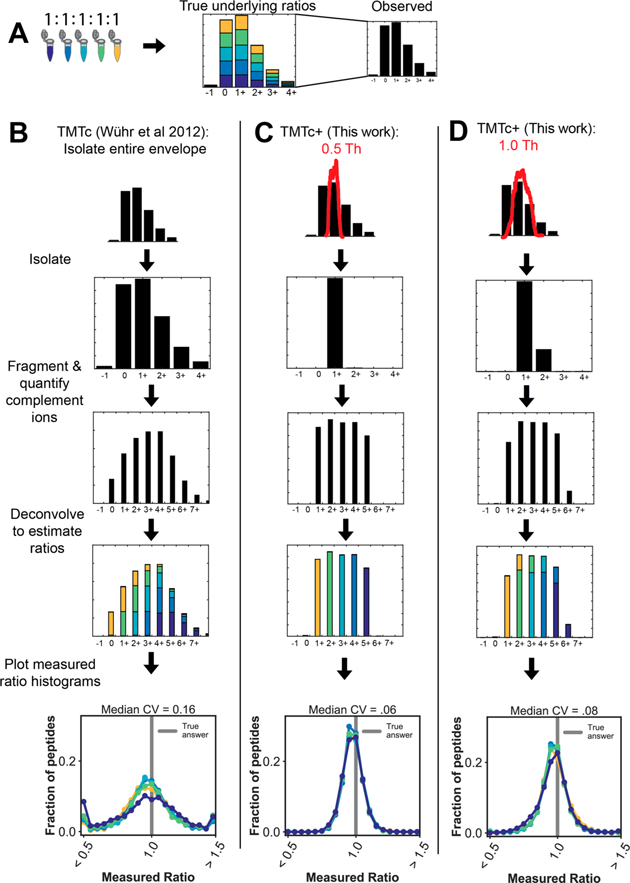
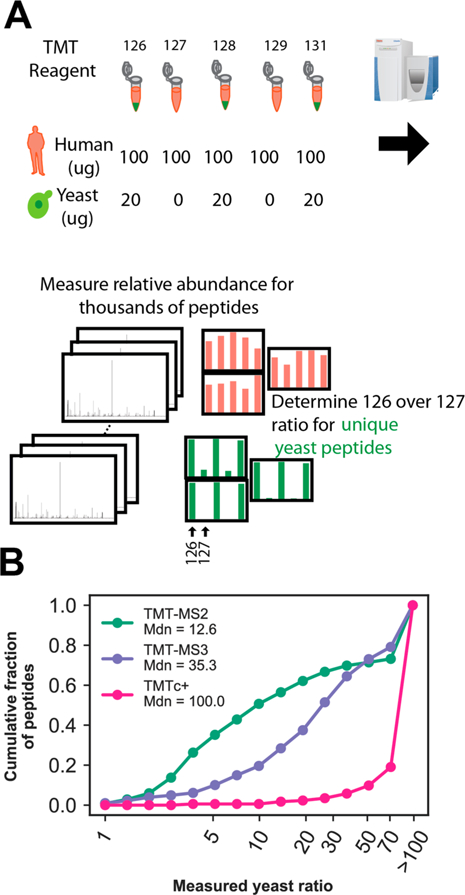
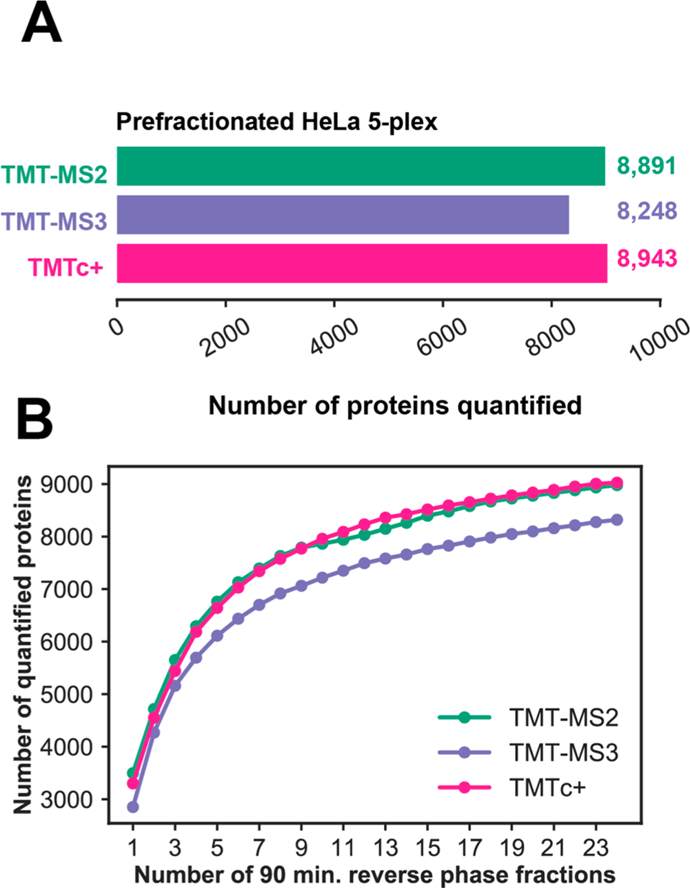
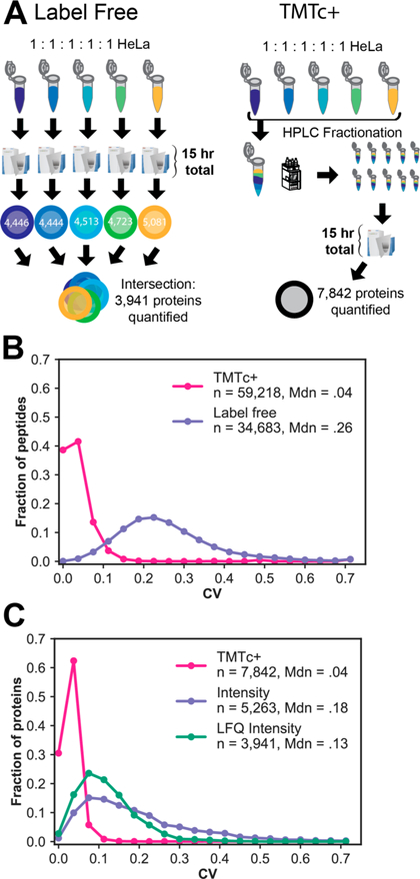
Quantitative analysis of proteomes across multiple time points, organelles, and perturbations is essential for understanding both fundamental biology and disease states. The development of isobaric tags (e.g., TMT) has enabled the simultaneous measurement of peptide abundances across several different conditions. These multiplexed approaches are promising in principle because of advantages in throughput and measurement quality. However, in practice, existing multiplexing approaches suffer from key limitations. In its simple implementation (TMT-MS2), measurements are distorted by chemical noise leading to poor measurement accuracy. The current state-of-the-art (TMT-MS3) addresses this but requires specialized quadrupole-iontrap-Orbitrap instrumentation. The complement reporter ion approach (TMTc) produces high accuracy measurements and is compatible with many more instruments, like quadrupole-Orbitraps. However, the required deconvolution of the TMTc cluster leads to poor measurement precision. Here, we introduce TMTc+, which adds the modeling of the MS2-isolation step into the deconvolution algorithm. The resulting measurements are comparable in precision to TMT-MS3/MS2. The improved duty cycle and lower filtering requirements make TMTc+ more sensitive than TMT-MS3 and comparable with TMT-MS2. At the same time, unlike TMT-MS2, TMTc+ is exquisitely able to distinguish signal from chemical noise even outperforming TMT-MS3. Lastly, we compare TMTc+ to quantitative label-free proteomics of total HeLa lysate and find that TMTc+ quantifies 7.8k versus 3.9k proteins in a 5-plex sample. At the same time, the median coefficient of variation improves from 13% to 4%. Thus, TMTc+ advances quantitative proteomics by enabling accurate, sensitive, and precise multiplexed experiments on more commonly used instruments.


Conflict of interest statement

The authors declare no competing financial interest.

Figures

Figure 1.
Figure 1.
Modeling the isolation step in the deconvolution algorithm increases measurement precision. (A) Five different TMT reagents are used to barcode five identical samples of peptides from a HeLa lysate. An example of the isotopic envelope of an intact peptide (precursor) is shown. The true underlying ratios are shown in color, but the mass spectrometer is blind to the barcoding. Only what is shown in black is observed. Note that in the MS1 before any fragmentation has occurred that the true ratio of 1:1:1:1:1 underlies each peak of the envelope. (B) In the published form of TMTc, the entire monoisotopic envelope is first isolated and then fragmented. The peaks corresponding to the complement reporter ions are identified, and the relative abundances are determined. The simultaneous fragmentation of multiple peaks from the precursor convolves the data. Intuition for this convolvement is provided in Figure S2. Using the known distribution of the precursor isotopic envelope , the amount of signal in each mass offset that belongs to each condition can be estimated using a least-squares optimization. This process is done for thousands of peptides, and the resulting histograms of the measured ratio are shown, resulting in a median CV of 16%. (C) With TMTc+ the shape of a much narrower (e.g., 0.5 Th) isolation window red) is measured and used. The shape and position of this window is incorporated into the deconvolution algorithm. With narrower isolation windows deconvolution becomes easier and precision is gained. In the extreme case where only a single peak from the envelope is isolated, the TMTc+ algorithm has to only calculate away isotopic impurities from the TMT-tag. The median CV on the peptide level improves to 6%. (D) TMTc+ can accommodate isolation windows of any size as long as their shape has been measured. In the case where a 1.0 Th window is used (red), a small amount of the M+2 peak is isolated in addition to the M+1 peak. Using the shape of this moderately sized isolation window, the ratios can be deconvolved, and a significant improvement in precision (median CV of 8%) is still observed relative to when the entire isotopic envelope is isolated with previously published TMTc.
Figure 2.
Figure 2.
Signal to noise comparison between TMTc+, TMT-MS2, and TMT-MS3. (A) A yeast/human standard was designed to assay the chemical signal-to-noise of TMTc+ relative to other multiplexed proteomics methods in use. Yeast (green) is only labeled with three of the five TMT reagents used, whereas human (pink) is labeled with all five. The ratio of 126 TMT/127 TMT for unique yeast peptides is used to assay the chemical signal-to-noise. A minimum S/FTNoise of 1000 (∼5000 charges) was required for the peptide to be included in the analysis to have sufficient ion statistics. A perfect measurement shows an infinite change. (B) Cumulative histogram of measured yeast ratios for unique yeast peptides using TMT-MS2, TMT-MS3, and TMTc+ from a 90 min reverse phase fractionated sample. Bins are indicated with a circle. Due to restraints on ion counting statistics, any measured ratio larger than 100 was plotted as >100.
Figure 3.
Figure 3.
Comparison of sensitivity for different multiplexed proteomics methods. (A) Number of proteins quantified at a 1% FDR on the protein level after analyzing 24 90-min reverse phase fractionated samples of a 1:1:1:1:1 TMT tagged HeLa standard. TMTMS2 and MultiNotch-MS3 measurements were filtered to an isolation specificity >75% as previously described.,, However, this was not necessary for TMTc+. (B) Number of proteins quantified at a 1% FDR on the protein level as a function of the number of 90-min reverse phase fractionated samples analyzed with each method.
Figure 4.
Figure 4.
Comparison of TMTc+ with label-free proteomics. (A) A sample of digested HeLa peptides was either labeled with five different TMT reagents and combined to be analyzed by TMTc+ or analyzed in succession via one-shot label-free proteomics for the same amount of instrument time (15 h total). An additional 3901 proteins are quantified in all five samples using TMTc+. (B) Distribution of coefficients of variation at the peptide level with each method. TMTc+ (pink) quantifies an additional 24 535 peptides relative to label-free (purple) and has a median CV of 4% relative to a median CV of 26% with label-free quantification. (C) Peptide measurements were aggregated to the protein level (1% FDR) either by summing counts of ions in each sample for TMTc+ (pink) or by two different established methods for label-free (green and purple). TMTc+ quantifies thousands of additional proteins compared to both quantitative label-free approaches and has a lower median CV (4%) relative to the label-free approaches (13% and 18%, respectively).

References

    1. Sidoli S; Kulej K; Garcia BA J. Cell Biol 2017, 216, 21–24. - PMC - PubMed
    1. Chick JM; Kolippakkam D; Nusinow DP; Zhai B; Rad R; Huttlin EL; Gygi SP Nat. Biotechnol 2015, 33, 743–749. - PMC - PubMed
    1. Cox J; Hein MY; Luber CA; Paron I; Nagaraj N; Mann M Mol. Cell. Proteomics 2014, 13, 2513–2526. - PMC - PubMed
    1. Thompson A; Schafer J; Kuhn K; Kienle S; Schwarz J; Schmidt G; Neumann T; Hamon C Anal. Chem 2003, 75, 1895–1904. - PubMed
    1. McAlister GC; Huttlin EL; Haas W; Ting L; Jedrychowski MP; Rogers JC; Kuhn K; Pike I; Grothe RA; Blethrow JD; Gygi SP Anal. Chem 2012, 84, 7469–7478. - PMC - PubMed

Publication types