. 2018 Mar 9;18(3):831.
doi: 10.3390/s18030831.

An Experimental Study on Static and Dynamic Strain Sensitivity of Embeddable Smart Concrete Sensors Doped with Carbon Nanotubes for SHM of Large Structures

Affiliations

An Experimental Study on Static and Dynamic Strain Sensitivity of Embeddable Smart Concrete Sensors Doped with Carbon Nanotubes for SHM of Large Structures

Andrea Meoni et al. Sensors (Basel). .

Abstract

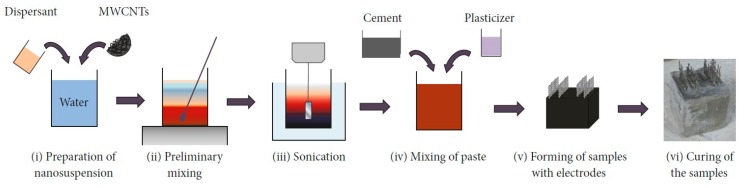
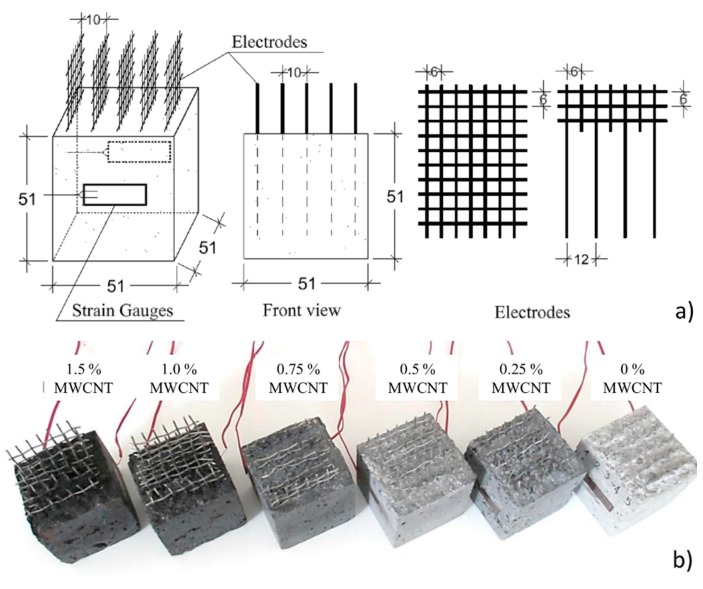
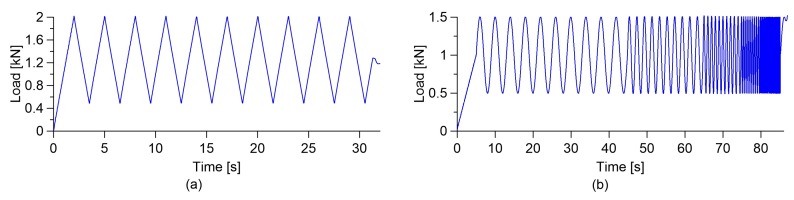
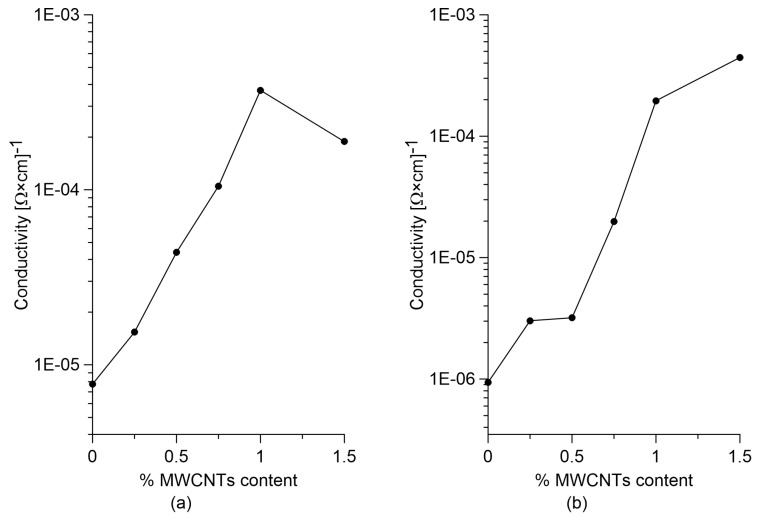
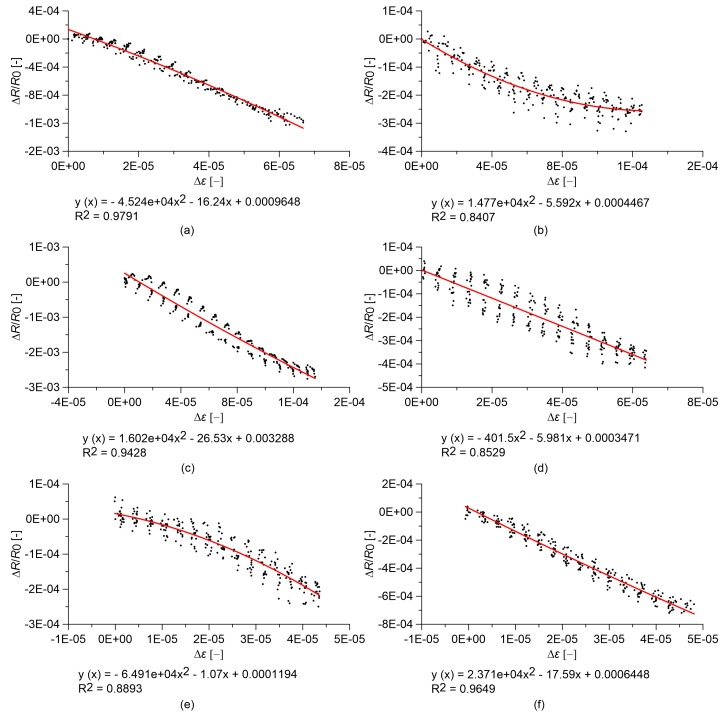
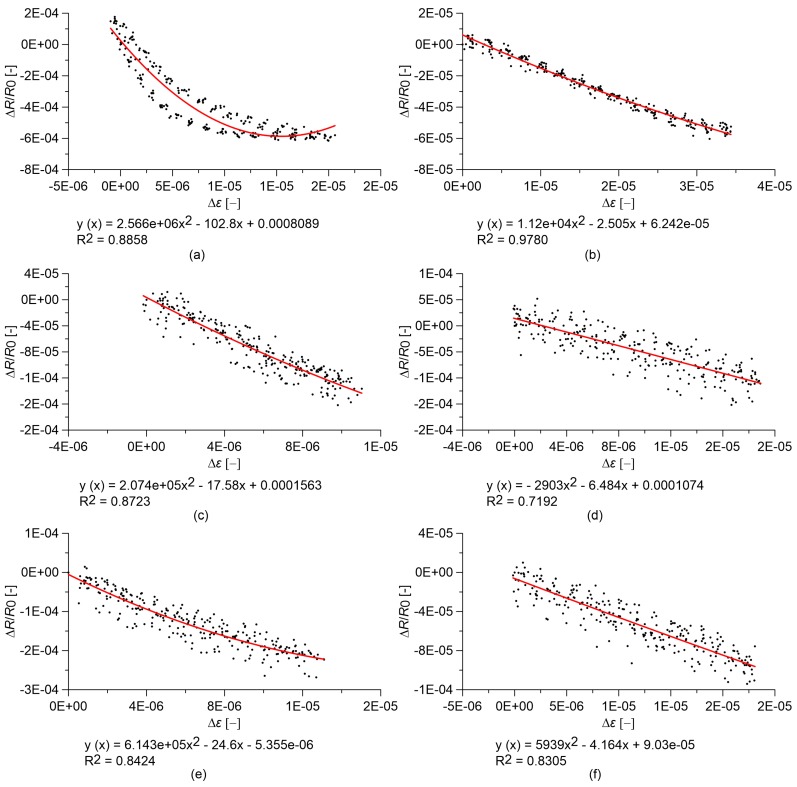
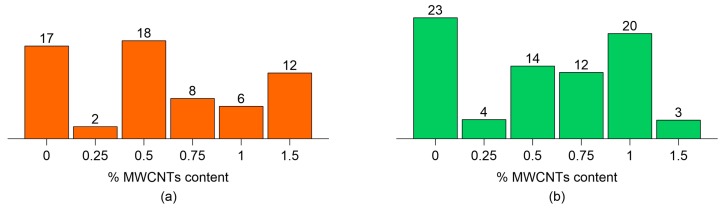
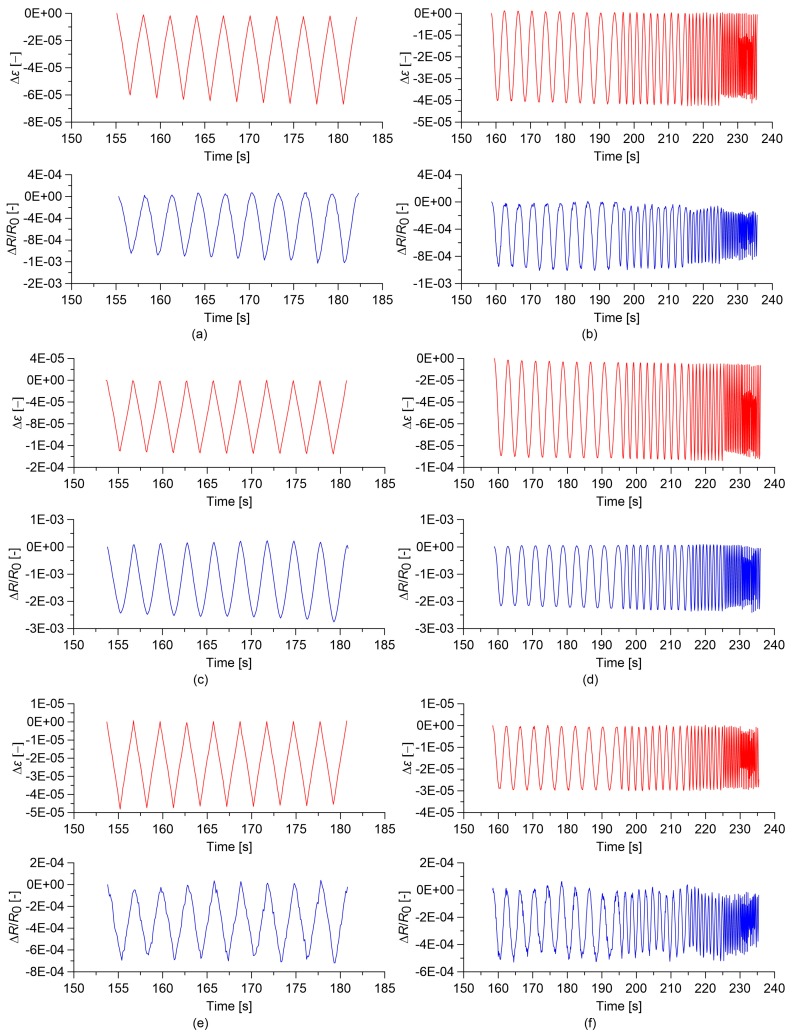
The availability of new self-sensing cement-based strain sensors allows the development of dense sensor networks for Structural Health Monitoring (SHM) of reinforced concrete structures. These sensors are fabricated by doping cement-matrix mterials with conductive fillers, such as Multi Walled Carbon Nanotubes (MWCNTs), and can be embedded into structural elements made of reinforced concrete prior to casting. The strain sensing principle is based on the multifunctional composites outputting a measurable change in their electrical properties when subjected to a deformation. Previous work by the authors was devoted to material fabrication, modeling and applications in SHM. In this paper, we investigate the behavior of several sensors fabricated with and without aggregates and with different MWCNT contents. The strain sensitivity of the sensors, in terms of fractional change in electrical resistivity for unit strain, as well as their linearity are investigated through experimental testing under both quasi-static and sine-sweep dynamic uni-axial compressive loadings. Moreover, the responses of the sensors when subjected to destructive compressive tests are evaluated. Overall, the presented results contribute to improving the scientific knowledge on the behavior of smart concrete sensors and to furthering their understanding for SHM applications.

Keywords: carbon nanotubes; cement-based materials; self-sensing materials; smart concrete sensors; strain sensitivity; structural health monitoring.


Conflict of interest statement

The authors declare no conflict of interest.

Figures

Figure 1
Figure 1
Preparation procedure of paste and concrete samples with carbon nanotubes.
Figure 2
Figure 2
(a) Geometry of specimens and electrodes (dimensions are in mm); (b) Picture of samples with 1.5, 1.0, 0.75, 0.5, 0.25 and 0% (from left to right) MWCNTs.
Figure 3
Figure 3
(a) Quasi-static uniaxial load; (b) Sine-weep dynamic uniaxial load.
Figure 4
Figure 4
Electrical conductivity variation for different MWCNTs content in (a) cured paste samples; and (b) concrete samples.
Figure 5
Figure 5
Relative change in electrical resistance versus applied strain of nanocomposite cement paste specimens under quasi-static compression loads. In the plots, R0 is the electrical resistance value with a preload of 0.5 kN, and equations of quadratic regression lines are reported: cured paste with (a) 0.00% MWCNTs; (b) 0.25% MWCNTs; (c) 0.50% MWCNTs; (d) 0.75% MWCNTs; (e) 1.00% MWCNTs; (f) 1.50% MWCNTs.
Figure 6
Figure 6
Relative change in electrical resistance versus applied strain of nanocomposite concrete specimens under quasi-static compression loads. In the plots, R0 is the electrical resistance value with a preload of 0.5 kN, and equations of quadratic regression lines are reported: concrete with (a) 0.00% MWCNTs; (b) 0.25% MWCNTs; (c) 0.50% MWCNTs; (d) 0.75% MWCNTs; (e) 1.00% MWCNTs; (f) 1.50% MWCNTs.
Figure 7
Figure 7
Gauge factor as a function of MWCNT content for (a) cured paste specimens; and (b) concrete specimens.
Figure 8
Figure 8
Time histories of the relative change in electrical resistance, ΔR/R0, and of the applied strain, Δε, obtained from the electromechanical tests. In the plots, R0 is the electrical resistance value with a preload of 0.5 kN: (a) Quasi-static load applied on cured paste with 0.00% MWCNTs;(b) Sine-sweep dynamic load applied on cured paste with 0.00% MWCNTs; (c) Quasi-static load applied on cured paste with 0.50% MWCNTs; (d) Sine-sweep dynamic load applied on cured paste with 0.50% MWCTs; (e) Quasi-static load applied on cured paste with 1.50% MWCNTs; (f) Sine-sweep dynamic load applied on cured paste with 1.50% MWCNTs.
Figure 9
Figure 9
Time histories of the relative change in electrical resistance, ΔR/R0, and of the applied strain, Δε, obtained from the electromechanical tests. In the plots, R0 is the electrical resistance value with a preload of 0.5 kN: (a) Quasi-static load applied on concrete with 0.00% MWCTs; (b) Sine-sweep dynamic load applied on concrete with 0.00% MWCNTs; (c) Quasi-static load applied on concrete with 0.50% MWCNTs; (d) Sine-sweep dynamic load applied on concrete with 0.50% MWCNTs; (e) Quasi-static load applied on concrete with 1.00% MWCNTs; (f) Sine-sweep dynamic load applied on concrete with 1.00% MWCNTs.
Figure 10
Figure 10
Relative change in electrical resistance versus applied strain of nanocomposite cured paste specimens. In the plots, R0 is the electrical resistance value with a preload of 0.5 kN. Comparison between results obtained under sine-sweep dynamic compression loads and those obtained under quasi-static compression loads: cured paste with (a) 0.00% MWCNTs; (b) 0.50% MWCNTs; (c) 1.50% MWCNTs.
Figure 11
Figure 11
Relative change in electrical resistance versus applied strain of nanocomposite concrete specimens. In the plots, R0 is the electrical resistance value with a preload of 0.5 kN. Comparison between results obtained under sine-sweep dynamic compression loads and those obtained under quasi-static compression loads: concrete with (a) 0.00% MWCNTs; (b) 0.50% MWCNTs; (c) 1.00% MWCNTs.
Figure 12
Figure 12
Comparison between stress and relative change in electrical resistance versus relative applied strain for paste specimens obtained from axial destructive tests (the circle indicates the peak stress point). Cured paste with (a) 0.00% MWCNTs and (b) 0.50% MWCNTs.
Figure 13
Figure 13
Comparison between stress and relative change in electrical resistance versus relative applied strain for concrete specimens obtained from destructive tests (the circle indicates the peak stress point). Concrete with (a) 0.00% MWCNTs and (b) 1.00% MWCNTs.

References

    1. Dodds J.S., Meyers F.N., Loh K.J. Piezoelectric characterization of PVDF-TrFE thin films enhanced with ZnO nanoparticles. IEEE Sens. J. 2012;12:1889–1890. doi: 10.1109/JSEN.2011.2182043. - DOI
    1. Rathod V.T., Jain A. Ultrasonic guided wave sensitivity of piezopolymer films subjected to thermal exposure. ISSS J. Micro Smart Syst. 2018:1–10. doi: 10.1007/s41683-018-0019-1. - DOI
    1. Kavitha S., Daniel R.J., Sumangala K. High performance MEMS accelerometers for concrete SHM applications and comparison with COTS accelerometers. Mech. Syst. Signal. Process. 2016;66:410–424. doi: 10.1016/j.ymssp.2015.06.005. - DOI
    1. Ramakrishnan M., Rajan G., Semenova Y., Farrell G. Overview of fiber optic sensor technologies for strain/temperature sensing applications in composite materials. Sensors. 2016;16:99. doi: 10.3390/s16010099. - DOI - PMC - PubMed
    1. Zhou X., Xi L., Lee J. Reliability-centered predictive maintenance scheduling for a continuously monitored system subject to degradation. Reliab. Eng. Syst. Safety. 2007;92:530–534. doi: 10.1016/j.ress.2006.01.006. - DOI

LinkOut - more resources