. 2018 Mar 9;14(3):e1006914.
doi: 10.1371/journal.ppat.1006914. eCollection 2018 Mar.

Lung macrophage scavenger receptor SR-A6 (MARCO) is an adenovirus type-specific virus entry receptor

Affiliations

Lung macrophage scavenger receptor SR-A6 (MARCO) is an adenovirus type-specific virus entry receptor

Nicole Stichling et al. PLoS Pathog. .

Abstract

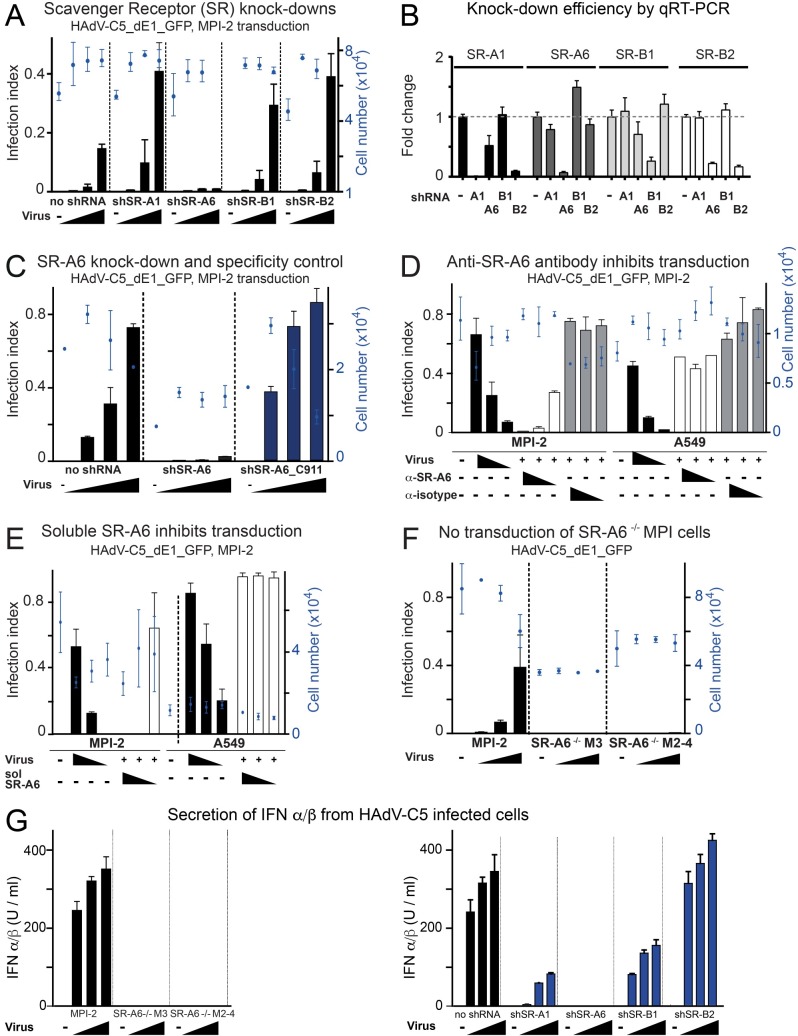
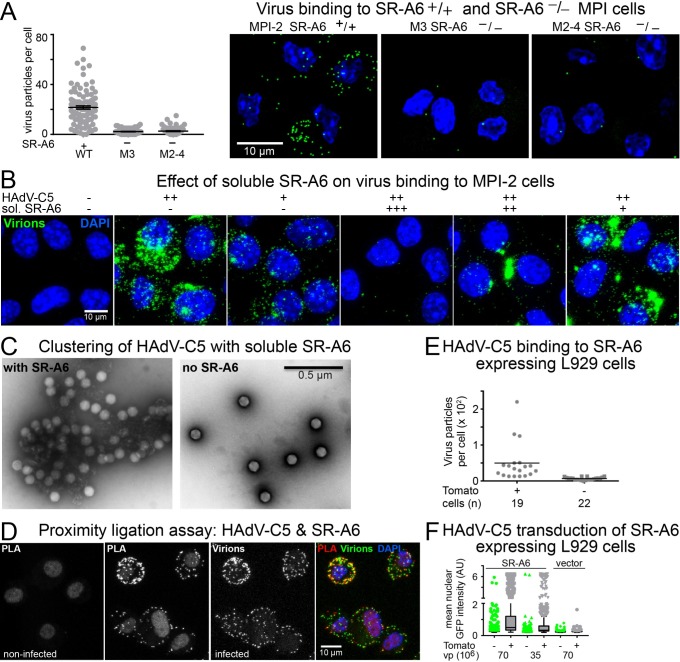
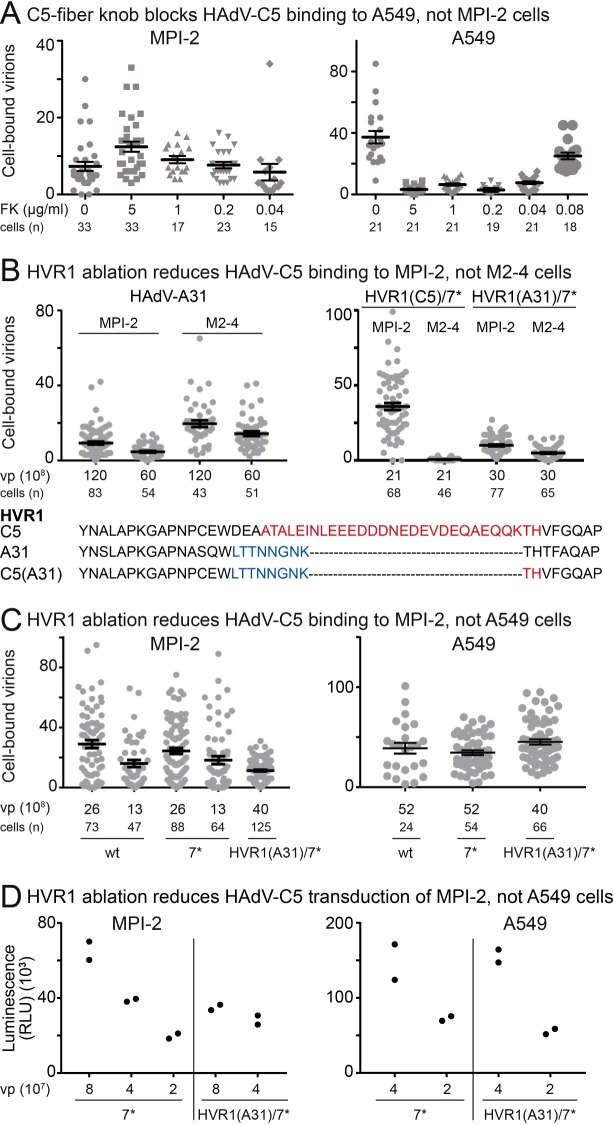
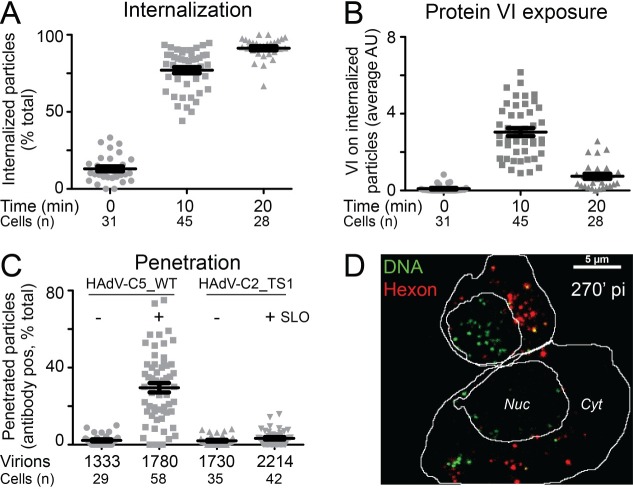
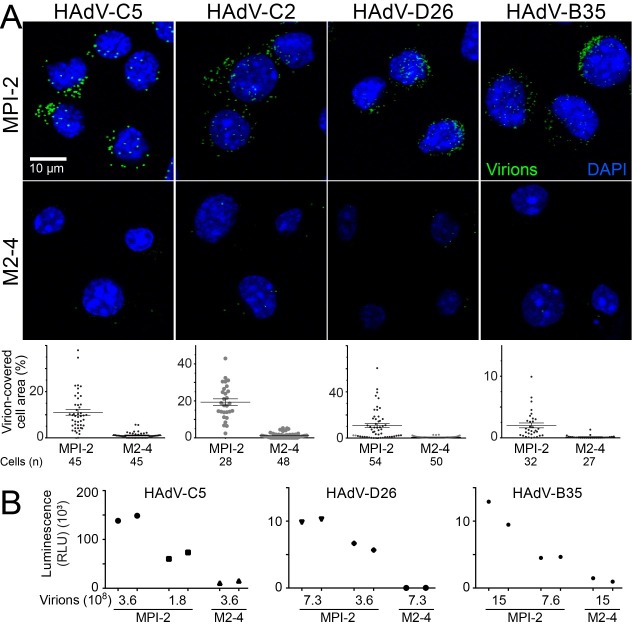
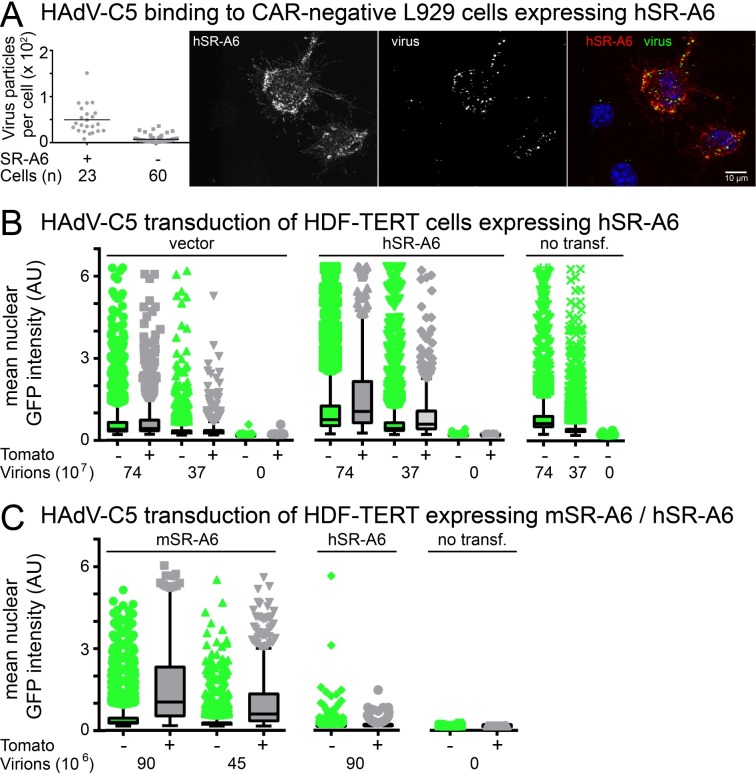
Macrophages are a diverse group of phagocytic cells acting in host protection against stress, injury, and pathogens. Here, we show that the scavenger receptor SR-A6 is an entry receptor for human adenoviruses in murine alveolar macrophage-like MPI cells, and important for production of type I interferon. Scavenger receptors contribute to the clearance of endogenous proteins, lipoproteins and pathogens. Knockout of SR-A6 in MPI cells, anti-SR-A6 antibody or the soluble extracellular SR-A6 domain reduced adenovirus type-C5 (HAdV-C5) binding and transduction. Expression of murine SR-A6, and to a lower extent human SR-A6 boosted virion binding to human cells and transduction. Virion clustering by soluble SR-A6 and proximity localization with SR-A6 on MPI cells suggested direct adenovirus interaction with SR-A6. Deletion of the negatively charged hypervariable region 1 (HVR1) of hexon reduced HAdV-C5 binding and transduction, implying that the viral ligand for SR-A6 is hexon. SR-A6 facilitated macrophage entry of HAdV-B35 and HAdV-D26, two important vectors for transduction of hematopoietic cells and human vaccination. The study highlights the importance of scavenger receptors in innate immunity against human viruses.


Conflict of interest statement

The authors have declared that no competing interests exist.

Figures

Fig 1
Fig 1. SR-A6 is required for HAdV-C5 infection of murine alveolar macrophage-like MPI-2 cells.
A) Transduction assay with HAdV-C5_dE1_GFP in MPI-2 cells expressing shRNAs against the scavenger receptors SR-A1, SR-A6, SR-B1 and SR-B2. Three different input amounts of HAdV-C5_dE1_GFP (~9765–39000 virus particles per cell) were used for the transduction. Transduction efficiency was scored at 20 h pi by measuring GFP signal intensity over nucleus, and is expressed as infection index (number of GFP positive nuclei/total number of nuclei). The values represent mean values from three technical replicates ± standard deviations. B) qRT-PCR control of knockdown efficiencies in shRNA-expressing cells. Transcripts analyzed are indicated on the upper part of the panel, and the annotation on x-axis indicates shRNA-expressing cell lysates used for analyses. The transcript levels are normalized to the wild type MPI-2 cells by three or two house-keeping genes. C) Transduction assay with HAdV-C5_dE1_GFP on MPI-2 cells expressing shRNA against SR-A6 or a control, non-targeting SR-A6_C911 shRNA. D) Transduction assay with HAdV-C5_dE1_GFP on MPI-2 and A549 cells after pre-incubation of cells with three different concentrations of anti-SR-A6 antibody ED31 or an isotype-matched control antibody. E) Transduction assay with HAdV-C5_dE1_GFP on MPI-2 and A549 cells after pre-incubation of virus with three different amounts of soluble mouse SR-A6. Input virus ~16700 virus particles per cell with the soluble SR-A6. F) Transduction assay with HAdV-C5_dE1_GFP on wild type MPI-2 and two independent SR-A6-/- MPI-cell lines. G) Secretion of IFN α/β from wild type, SR-A6 knock-out or scavenger receptor shRNA-expressing MPI-2 cells upon HAdV-C5 infection. Culture medium was collected from virus-infected cells 24h pi and titrated on a reporter cell line expressing the Firefly luciferase gene under the control of an IFN-inducible Mx2 promoter.
Fig 2
Fig 2. SR-A6 facilitates virus binding to MPI-2 cells.
A) Binding of Alexa-Fluor488-labeled HAdV-C5 to parental MPI-2 cells or the mSR-A6-/- M3 and M2-4 cell lines. Virus was added to cells at +4°C for 60 min (moi ~ 2540 virus particles per cell) and cells were shifted to 37°C for 5min before analysis. The plot shows number of bound virus particles per cell, one dot representing one cell. Error bars represent the means ± SEMs. The difference between SR-A6-positive and SR-A6 knockout cells was statistically significant (P<0.0001, Kolmogorov-Smirnov test). The right-hand panel shows representative images from the three cell lines analyzed. Images are maximum projections of confocal stacks. Virus particles are shown in green and nuclei (DAPI) in blue. Scale bar = 10 μm. B) Effect of preincubation of HAdV-C5 with three different amounts of soluble extracellular domain of mouse SR-A6. Input virus ~44600 virus particles per cell with the soluble SR-A6. The soluble form of SR-A6 in a concentration-dependent manner either suppressed virus binding to cells or caused virus to bind to cells in clustered forms. Scale bar = 10 μm. C) Representative negative stain EM images of HAdV-C5 incubated in the presence or absence of soluble, partially trimeric SR-A6. Scale bar = 0.5 μm. D) Proximity ligation assay indicates co-localization of virus and SR-A6 at the cell surface. Alexa-Fluor488-conjugated HAdV-C5 was added to cells at 4°C for 60 min (moi ~1370 virus particles per cell), and proximity ligation assay was performed with anti-Alexa-Fluor488 antibodies and anti-SR-A6 ED31 antibody. Images shown represent maximum projections of confocal stacks. PLA indicates signal from the proximity ligation assay, virus panel shows the Alexa-Fluor488-labeled virus particles and the overlay panel demonstrates the overlap of PLA and virus signals. Nuclei (DAPI stain) are in blue. Scale bar = 10 μm. E) Exogenous expression of murine SR-A6 in L-929 cells (low level of CAR expression) promotes binding of HAdV-C5 to the cells. SR-A6 was expressed in the cells from a bi-cistronic mRNA which also directed the synthesis of Tomato from an internal translation initiation site. Alexa-Fluor488- labeled HAdV-C5 particles were bound to transfected L-929 cells at 4°C. Fixed samples were imaged by confocal microscopy. Virus particles associated with Tomato-positive and–negative cells were scored from maximum projections of confocal stacks. The plot shows number of virus particles per cell, one dot representing one cell. Horizontal bars represent mean values. Number of cells analyzed is indicated. The difference between Tomato-positive and -negative cells was statistically significant (P<0.0001, Kolmogorov-Smirnov test). F) Exogenous expression of murine SR-A6 in L-929 cells promotes HAdV-C5-mediated gene transduction. Transfected L-929 cells were infected with two different amounts of HAdV-C5_dE1_GFP, and nuclear GFP signals were scored at 24h post infection by microscopy. The plot shows mean nuclear GFP intensities for Tomato-positive and–negative cells as Tukey box plots. More than 700 cells were analyzed for each sample.
Fig 3
Fig 3. HVR1 on hexon controls binding of HAdV-C5 to MPI-2 cells.
A) Pre-incubation of cells with soluble HAdV-C5 fiber knobs (FK) does not inhibit binding of HAdV-C5 to MPI-2 cells, whereas binding of the virus to the CAR-positive A549 cells is suppressed in a dose-dependent manner. Cells were first pre-incubated with the indicated amounts of FKs and Atto565-labeled HAdV-C5 was then added to the cells at 4°C for 60 min (moi ~ 20000 and 38000 virus particles/cell for MPI-2 and A549, respectively). After removal of unbound viruses and fixation, cells were imaged by confocal microscopy and cell-associated virus particles were scored from maximum projections of confocal stacks. The plot shows number of bound virus particles per cell, one dot representing one cell. Error bars represent the means ± SEMs. Number of cells analyzed is indicated. The difference between MPI-2 FK 0 and 5 μg/ml or 1 μg/ml samples was statistically significant (P = 0.002 and P = 0.032, respectively, Kolmogorov-Smirnov test). B) HAdV-A31 (with a truncated HVR1) binds better to SR-A6 negative M2-4 than MPI-2 cells, and HVR1 swap HAdV-C5_HVR1(A31)/HVR7* shows reduced binding to MPI-2 cells compared to HAdV-C5. The HVR1 swap was engineered into a virus backbone that carried single amino acid changes in hexon HVR7 (HVR7*), which prevent coagulation factor X binding to the virus. The experiment was carried out as described in (C). The difference between HAdV-C5_HVR1(A31)/HVR7* MPI-2 and M2-4 results, as well as that of HAdV-A31 results, is statistically significant (P<0.0001, Kolmogorov-Smirnov test). The HVR1 amino acid sequences of HAdV-C5 (highlighted in red), HAdV-A31 (blue) and HAdV-C5_HVR1(A31)/HVR7* (blue, red) are shown in single letter code. C) HVR1 ablation reduces HAdV-C5 binding to MPI-2 cells but not A549 cells. Indicated amounts (vp) of unlabeled wild type HAdV-C5, HAdV-C5_HVR7* and HAdV-C5_HVR1(A31)/HVR7* were added to ~ 1.6×10⁵ cells at 4°C for 60 min and after removal of unbound virus, cells were switched to 37°C for 10 min before fixation. Viruses were detected by immunostaining with an anti-hexon 9C12 antibody and secondary Alexa-Fluor488-conjugated antibody. Samples were imaged by confocal microscopy and cell-associated virus particles were scored from maximum projections of confocal stacks. The plot shows number of bound virus particles per cell, one dot representing one cell. Error bars represent the means ± SEMs. Number of cells analyzed is indicated. The difference between HVR1(A31)/HVR7* and the wild type or HVR7* viruses was statistically significant in MPI-2 cells (P = 0.0091 and P = 0.0006 for the vp 13×108 samples, respectively, Kolmogorov-Smirnov test), whereas differences in A549 cells were not statistically significant. D) Swap of hexon HVR1 with that of HAdV-A31 reduces HAdV-C5 gene transduction in MPI-2 cells, but not in A549 cells. Cells (~4×10⁴) were infected with the indicated amounts of HAdV-C5_HVR7* and HAdV-C5_HVR1(A31)/HVR7* viruses and the activity of firefly luciferase expressed from the viral genomes was used to estimate the transduction efficiencies at 24 h pi. The plot shows results from two technical replicates.
Fig 4
Fig 4. Characterization of HAdV-C5 entry into MPI-2 cells.
A) Internalization of HAdV-C5 into MPI-2 cells and B) exposure of viral membrane lytic protein VI on internalized virus. Atto565-labeled HAdV-C5 were added to MPI-2 cells at 4°C (moi ~13600 virus particles per cell) for 60 min. Unbound particles were washed away, and cells were shifted to 37°C for the indicated times. Intact cells were then incubated with 9C12 anti-hexon antibodies at 4°C to tag surface-associated viruses, and after fixation, cells were permeabilized and stained for protein VI. Secondary Alexa Fluor680-conjugated anti-mouse and Alexa-Fluor488-conjugated anti-rabbit antibodies were used to detect 9C12 and anti-protein VI antibodies, respectively. Nuclei were stained with DAPI, and samples were imaged by confocal microscopy. Virus particles lacking the 9C12 signal were scored as internalized particles and (A) shows percentage of internalized virus particles per cell at the different time points. One dot represents one cell. (B) shows mean average protein VI signal on internalized particles. One dot represents one cell. Error bars represent the means ± SEMs. Number of cells analyzed is indicated. C) SR-A6-facilitated entry supports efficient penetration of HAdV-C5 into the cytoplasm. Alexa-Fluor488-conjugated HAdV-C5 were added to MPI-2 cells at 4°C for 60 min (moi ~7300 virus particles per cell). Unbound viruses were washed away and cells were shifted to 37°C for 45 min. Cell surface and cytoplasmic particles were tagged with anti-Alexa-Fluor488 antibodies after perforation of the plasma membrane with streptolysin O (SLO). The anti-Alexa-Fluor488 antibodies in turn were visualized by secondary Alexa-Fluor594 antibodies. Control cells were incubated with antibodies without SLO treatment to specifically mark virus particles at the plasma membrane. The plot shows percentage of virus particles positive for the anti-Alexa-Fluor488 antibodies, one dot representing one cell. The majority of antibody-positive particles in the SLO-treated HAdV-C wild type (wt) sample represent cytoplasmic virus, since the no-SLO control indicated only few particles at the cell surface. Virus particles in the endosomes are inaccessible to the antibodies, and the endosomes stayed intact in the assay, since parallel samples infected with the penetration deficient HAdV-C2-TS1 mutant virus displayed only low number of antibody-positive particles. Error bars represent the means ± SEMs. Numbers of cells and virus particles analyzed are indicated. D) Tracking of incoming virus genome. EdC-labeled HAdV-C5 particles (moi ~ 7300 virus particles per cell) were internalized into MPI-2 cells at 37°C for 30 min and, after removal of unbound virus, the samples were incubated for further 270 min before fixation. The virus capsids were visualized by anti-hexon 9C12 and Alexa-Fluor594-conjugated secondary antibodies, and click-reaction with Alexa-Fluor488-conjugated azide was carried out to mark the virus genomes. The image represents maximum projection of image stack from central parts of the cells. Nuclear area and cell outline are indicated. In the majority of cells, the virus genome was separated from the capsid at this time point and concentrated over the nuclear area, as exemplified by the upper cell in the image. A fraction of cells displayed significant amounts of capsid-free virus DNA also in the cytoplasm, as exemplified by the lower cell in the image. Scale bar = 5 μm.
Fig 5
Fig 5. SR-A6 facilitates binding of HAdV-C2, HAdV-D26 and HAdV-B35 to MPI-2 cells.
A) Alexa-Fluor488-labeled virus particles were added to wild type MP1-2 or to the SR-A6 knockout M2-4 cells as described in the legend to Fig 2A. Images shown are maximum projections of confocal stacks. Virus particles are pseudo-colored green and nuclei (DAPI) blue. Scale bar = 10 μm. The plots show quantification of virus binding efficiency, expressed as percentage of cell area covered by virus particles. Error bars represent the means ± SEMs, and number of cells analyzed is indicated. The difference in virus binding to MPI-2 and M2-4 cells was statistically significant for all viruses (P<0.0001, Kolmogorov-Smirnov test). B) SR-A6 facilitates HAdV-D26 and HAdV-B35 virus transduction. Wild type MPI-2 and the SR-A6 knockout M2-4 cells (~8×10⁴) were infected with indicated amounts of recombinant virus vectors carrying the Firefly luciferase gene, and the luciferase enzyme activity in cell extracts was used to estimate the virus transduction efficiencies at 20.5 h pi. The plot shows results from two technical replicates.
Fig 6
Fig 6. High surface expression of human SR-A6 facilitates HAdV-C5 infection.
A) Exogenous expression of human SR-A6 in L-929 cells (low CAR expression) promotes binding of HAdV-C5 to the cells. L-929 cells were transfected with a plasmid directing the synthesis of human SR-A6 from the cytomegalovirus major immediate early promoter and transfected cells were identified by immunostaining with anti-human SR-A6 antibody PLK1. Alexa-Fluor488-labeled HAdV-C5 particles were added to transfected L-929 cells at 4°C for 60 min. Fixed samples were imaged by confocal microscopy and virus particles associated with PLK1-positive and PLK1-negative cells were scored from maximum projections of confocal stacks. The plot shows number of virus particles per cell, one dot representing one cell. Horizontal bars represent mean values. Number of cells analyzed is indicated. The difference between PLK1-positive and -negative cells was statistically highly significant (P<0.0001, Kolmogorov-Smirnov test). The right-hand panel shows a representative image as a maximum projection of confocal stacks. In the overlay panel virus particles are shown in green, SR-A6-positive cells in red and nuclei (DAPI) in blue. Scale bar = 10 μm. B) Exogenous expression of human SR-A6 in HDF-TERT cells boosts HAdV-C5-mediated gene transduction. SR-A6 was expressed in the cells from a plasmid that directed synthesis of the protein from a bi-cistronic SR-A6-IRES-Tomato mRNA. Transfected HDF-TERT cells were infected with two different amounts of HAdV-C5_dE1_GFP, and nuclear GFP signals were scored at 30 h post infection (pi) by microscopy. Non-transfected cells or cells transfected with an empty vector were used as controls. The mean nuclear GFP intensities of Tomato-positive and Tomato-negative cells are shown as Tukey box plots. The difference between Tomato-positive and Tomato-negative cells in the SR-A6 transfection was statistically highly significant with a P-value <0.0001 (Kolmogorov-Smirnov test), whereas the difference in empty vector transfections did not reach P<0.0001 significance levels. Over 300 Tomato-positive cells and more than 5000 Tomato-negative cells were scored for each sample. C) Mouse SR-A6 expression in HDF-TERT cells leads to higher HAdV-C5_dE1_GFP infection efficiency than human SR-A6 expression. Both mouse (mSR-A6) and human (hSR-A6) proteins were expressed from bi-cistronic SR-A6-IRES-Tomato mRNAs. The mean nuclear GFP intensities of Tomato-positive and Tomato-negative cells are shown as Tukey box plots. Over 500 Tomato-positive cells and more than 4500 Tomato-negative cells were scored for each sample.

References

    1. Shi C, Pamer EG. Monocyte recruitment during infection and inflammation. Nat Rev Immunol. 2011;11(11):762–74. doi: 10.1038/nri3070 ; PubMed Central PMCID: PMCPMC3947780. - DOI - PMC - PubMed
    1. Davies LC, Jenkins SJ, Allen JE, Taylor PR. Tissue-resident macrophages. Nat Immunol. 2013;14(10):986–95. doi: 10.1038/ni.2705 ; PubMed Central PMCID: PMCPMC4045180. - DOI - PMC - PubMed
    1. Price JV, Vance RE. The Macrophage Paradox. Immunity. 2014;41(5):685–93. Epub 2014/12/18. doi: 10.1016/j.immuni.2014.10.015 . - DOI - PubMed
    1. Ginhoux F, Schultze JL, Murray PJ, Ochando J, Biswas SK. New insights into the multidimensional concept of macrophage ontogeny, activation and function. Nat Immunol. 2016;17(1):34–40. doi: 10.1038/ni.3324 . - DOI - PubMed
    1. Verschoor CP, Puchta A, Bowdish DM. The macrophage. Methods Mol Biol. 2012;844:139–56. Epub 2012/01/21. doi: 10.1007/978-1-61779-527-5_10 . - DOI - PubMed

Publication types

MeSH terms