. 2018 Sep:70:50-71.
doi: 10.1016/j.matbio.2018.03.004. Epub 2018 Mar 6.

Paradoxical roles of ATF6α and ATF6β in modulating disease severity caused by mutations in collagen X

Affiliations

Paradoxical roles of ATF6α and ATF6β in modulating disease severity caused by mutations in collagen X

M Forouhan et al. Matrix Biol. 2018 Sep.

Abstract

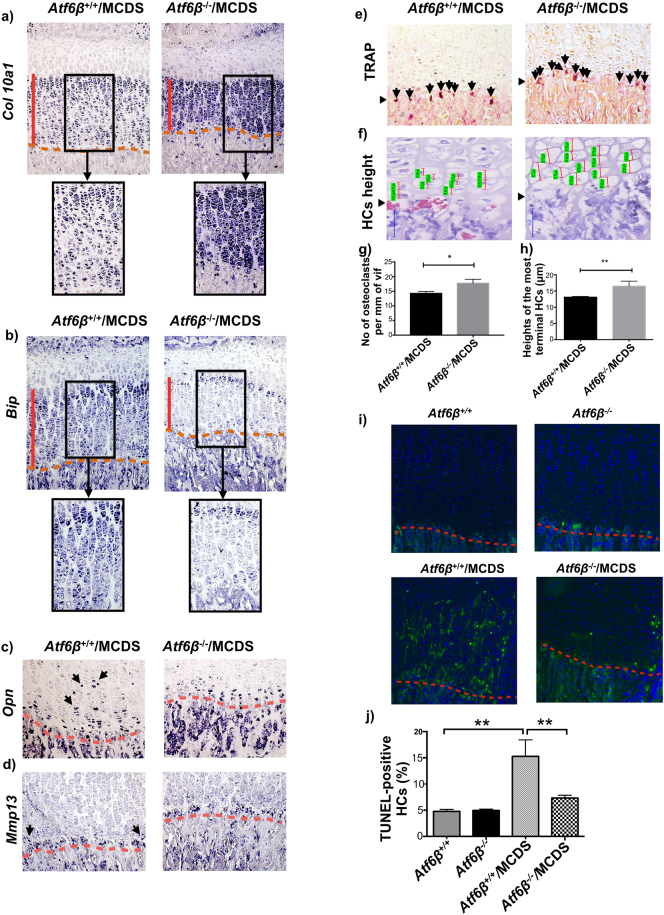
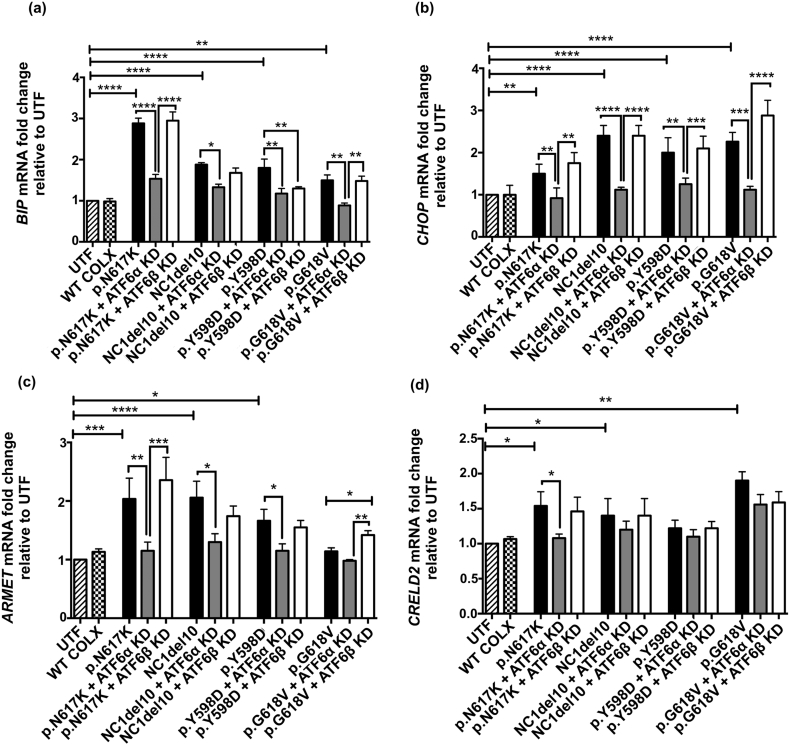
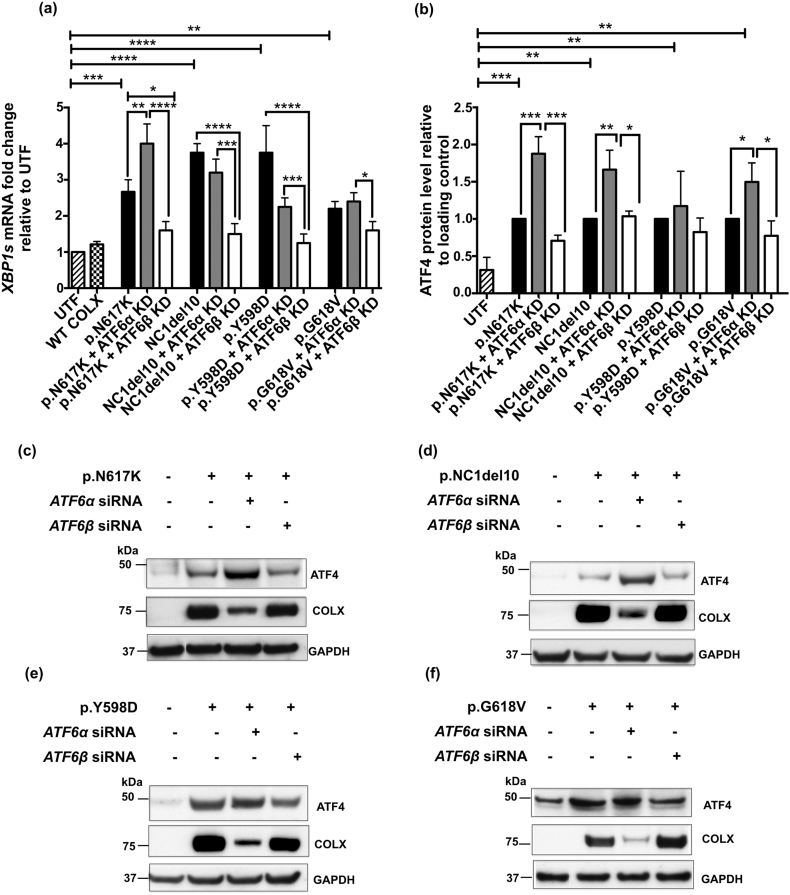
Whilst the role of ATF6α in modulating the unfolded protein response (UPR) has been well documented, the function of its paralogue ATF6β is less well understood. Using knockdown in cell culture and gene ablation in mice we have directly compared the roles of ATF6α & β in responding to the increased ER stress induced by mutant forms of type X collagen that cause the ER stress-associated metaphyseal chondrodysplasia type Schmid (MCDS). ATF6α more efficiently deals with the disease-associated ER stress in the absence of ATF6β and conversely, ATF6β is less effective in the absence of ATF6α. Furthermore, disease severity in vivo is increased by ATF6α ablation and decreased by ATF6β ablation. In addition, novel functions for each paralogue are described including an ATF6β-specific role in controlling growth plate chondrocyte proliferation. The clear demonstration of the intimate relationship of the two ATF6 isoforms and how ATF6β can moderate the activity of ATF6α and vice versa is of great significance for understanding the UPR mechanism. The activities of both ATF6 isoforms and their separate roles need consideration when deciding how to target increased ER stress as a means of treating MCDS and other ER stress-associated diseases.


Figures

Fig. 1
Fig. 1
Effects of ATF6α and ATF6β knockdown in cells expressing p.N617K MCDS-causing mutant form of collagen X protein. The expression of either ATF6α or ATF6β was knocked-down in HeLa cells using siRNAs. These cells were then transiently transfected with expression constructs encoding either the wild type collagen X or p.N617K mutant form of the protein. 48 h post transfection, (a) RNA was extracted and analysed with real time qPCR for the expression of (a) BIP, (b) CHOP, (c) ARMET and (d) CRELD2 and (e) the spliced XBP1, XBP1s. Mean ± SEM (n = 5). *p < 0.05, **p < 0.01, ***p < 0.001, ****p < 0.0001. Untransfected cells (UTF) served as controls. (f) Cell lysates were extracted and immunoblotted using an anti- ATF4 antibody. The level of ATF4 protein was quantified relative to GAPDH loading control. Values represent Mean ± SEM from three independent experiments. ***p < 0.001, ****p < 0.0001 as determined by ANOVA. UTF: Untransfected cells. Typical western blots for ATF4 and collagen X proteins in ATF6α or ATF6β siRNA-mediated knocked down cells expressing N671K.
Fig. 2
Fig. 2
Effects of Atf6α ablation on the growth plate pathology associated with MCDS. (a) H & E staining of tibial growth plat. (b) Widths of hypertrophic zones at three weeks of age. Mean ± SEM (N) (**p < 0.01 compared to Atf6α+/+/MCDS, ****p < 0.001 compared to Atf6α+/+). Immunohistochemistry for (c) collagen X, (d) Bip, and (e) Creld2 in three week old mice with specified genotypes. The vertical black lines delineate the hypertrophic zones. (f) Images represent immunohistochemistry for BrdU performed on tibial growth plate sections of three week old MCDS mice that were either wild type of knockout for Atf6α. (g) Percentage of BrdU labelled nuclei (black stained) calculated against the total number of cells in the proliferative zone. Mean ± SEM (n = 5). (h) A representative western blots of rib growth plate extracts at three weeks of age for Bip and Creld2. Coomassie blue stained gel was used as loading control. (i & j) Quantification of Bip and Creld2 from three independent analysis. All statistical analysis by ANOVA (**p < 0.01, ***p < 0.001 and ****p < 0.0001
Fig. 3
Fig. 3
Effects of Atf6α ablation on chondrocytes differentiation. Tibial growth plates from three week old mice with specified genotypes were analysed for the expression of mRNAs encoding (a) Col10a1, (b) Bip, (C) Osteopontin, and (d) Mmp13. The presence of transcript is indicated by the dark blue staining. The hypertrophic zone is indicated by the vertical red line and the vascular invasion front by the yellow dashes. (e) TRAP staining for osteoclasts (arrows) at the vascular invasion front (arrow head). The number of osteoclast per mm of vif is represented in the table h. (f) Snapshot of measurement of height of the most terminal hypertrophy chondrocytes (HCs) for each specific genotype. HCs are indicated by the red vertical lines and their corresponding measurements are highlighted in green. (arrow head = vif). Table (h) represents the average heights of the most terminal HCs. (g) TUNEL assay on tibial growth plate sections of three week old animals with specific genotypes. (Green stained cells = apoptotic cells, blue-stained cells = DAPI, red dotted lines = vascular invasion front). Table (h) shows the number of apoptotic HCs as a percentage of the total number of chondrocytes within HZ. (h) Mean ± SEM (N) (*p < 0.05 and **p < 0.01 compared to Atf6α+/+/MCDS, #p < 0.01 and # #p < 0.001 compared to ATF6α+/+). All statistical analysis by ANOVA. (For interpretation of the references to colour in this figure legend, the reader is referred to the web version of this article.)
Fig. 4
Fig. 4
Effects of Atf6α ablation on the activities of PERK and IRE1 signalling pathways. (a) Total RNA from three pooled ribs growth plate extracts of 21-day old mice were extracted and subjected to qPCR with XBP1 primers. Gel shows three independent samples for each genotype. Upper bands on the gel indicates Xbp1(U) with the size of 205 bp and lower band is Xbp1s (size = 179 bp). (b) A typical western blots of rib growth plate extracts at three weeks of age for Atf4. Coomassie blue stained gel was used as loading control. (C) The average rate of Xbp1 splicing from five independent samples for each genotype. (d) Quantification of Atf4 from five independent analyses (*p < 0.05, **p < 0.01, ***p < 0.001, ****p < 0.0001).
Fig. 5
Fig. 5
Effects of Atf6β ablation on the skeletal development and body weight of three week old mice. (a) A representative X-ray radiograph image for three-week old male mice (top row) and female mice (bottom row) with the specified genotypes. White scale bar = 100 μm (b) Mean ± SEM (N). *p < 0.05 and ***p < 0.001 when compared to Atf6β+/+mice. All statistical analysis by ANOVA.
Fig. 6
Fig. 6
Analysis of growth plate in three week old Atf6β−/− mice. (a) H & E staining of tibial growth plate and immunohistochemistry for (b) collagen X, (c) Bip, and (d) Creld2. The vertical black lines delineate the hypertrophic zones. Grey dashed lines indicated vascular invasion front. In situ hybridisation for (e) Col10a1, (f) Bip (g) osteopontin, and (h) Mmp13 mRNAs. The presence of transcript is indicated by the dark blue staining. HZ is shown by the vertical red lines. (i) 5-bromo-29-deoxyuridine (BrdU) labelling of proliferative cells in the growth plate. Positive cells stained black. (j) Snapshots of height measurement in the most terminal hypertrophic chondrocytes (HCs). Hypertrophic chondrocytes are indicated by red vertical lines and their corresponding measurements are highlighted in green. Scale bar = 50 μm. (k) TRAP staining for osteoclasts (arrows). Closed arrow head = vascular invasion front. (l) Mean ± SEM (N = 5). **p < 0.01 as determined by ANOVA.
Fig. 7
Fig. 7
Effects of Atf6β ablation on the growth plate pathology associated with MCDS. (a) H & E staining of tibial growth plate in three week old MCDS mice that were either wild type or knockout for Atf6β. (b) Widths of hypertrophic zones at three weeks of age. Mean ± SEM (N) (**p < 0.01 as determined by ANOVA). Immunohistochemistry for (c) collagen X, (d) Bip, and (e) Creld2. The vertical black lines delineate the hypertrophic zones The black boxed photomicrographs represent an expanded view of the indicated areas within hypertrophic zones in the sections from specified genotypes. The intracellular accumulation of collagen X (black arrows) is only apparent in the upper hypertrophic zone in Atf6β−/−/MCDS sample. The yellow horizontal arrow in the expanded view of Atf6β−/−/MCDS sample indicates the transition region in which; (c) intracellular accumulation of collagen X protein is resolved and collagen X protein is secreted (d) Bip is down-regulated. (f) A representative western blots of rib growth plate extracts at three weeks of age for BiP and CRELD2. Coomassie blue stained gel was used as loading control. (g & h) Quantification of Bip and Creld2 from three independent analysis (***p < 0.001). (For interpretation of the references to colour in this figure legend, the reader is referred to the web version of this article.)
Fig. 8
Fig. 8
Effects of Atf6β ablation on chondrocytes differentiation. In situ hybridisation for (a) collagen X, (b) Bip, (C) Osteopontin (black arrows), and (d) Mmp13 (black arrows) in tibial growth plate sections from three week old MCDS mice with specified genotypes The presence of transcript is indicated by the dark blue staining. The hypertrophic zone is indicated by the vertical red line and the vascular invasion front by the red dashes. The black boxed photomicrographs represent an expanded view of the indicated areas within hypertrophic zones in the sections from specified genotypes. (e) TRAP staining for osteoclasts (arrows) at the vascular invasion front (arrow head). (f) Snapshot of measurement of height of the most terminal hypertrophy chondrocytes (HCs) for each specific genotype. HCs are indicated by the red vertical lines and their corresponding measurements are highlighted in green. (arrow head = vif). (g) The number of osteoclast per mm of vif. Mean ± SEM (5). *p < 0.05. (h) The average heights of the most terminal HCs. Mean ± SEM (5). **p < 0.01 (i) TUNEL assay on tibial growth plate sections of three week old mice with specific genotypes. (Green stained cells = apoptotic cells, blue-stained cells = DAPI, red dotted lines = vascular invasion front). Table (j) The number of apoptotic HCs as a percentage of the total number of chondrocytes within HZ. Mean ± SEM (N ≥ 3). **p < 0.01. (k) qPCR for Chop on ribs growth plate extracts of three week old mice. Mean ± SEM (3). ****p < 0.0001 as determined by one way ANOVA. (For interpretation of the references to colour in this figure legend, the reader is referred to the web version of this article.)
Fig. 9
Fig. 9
Effects of Atf6β ablation on the activities of PERK and IRE1 signalling pathways. (a) Total RNA from three pooled ribs growth plate extracts of 21-day old mice were extracted and subjected to qPCR with XBP1 primers. Three independent samples for each genotype are shown. Upper bands on the gel indicates Xbp1(U) with the size of 205 bp and lower band is Xbp1s (size = 179 bp). (−RT = minus reverse transcriptase control). (b) A typical western blots of rib growth plate extracts at three weeks of age for Atf4. Coomassie blue stained gel was used as loading control. (c) The average rate of Xbp1 splicing from three independent samples for each genotype. (d) Quantification of Atf4 from three independent experiments (**p < 0.01, ****p < 0.0001).
S1 Fig
S1 Fig
Confirming efficiency and specificity of knockdown for ATF6α and ATF6β in cells expressing different MCDS-causing mutant forms of collagen X protein. The expression of either ATF6α or ATF6β was knocked down in HeLa cells using siRNAs. The siRNA-mediated ATF6α or ATF6β knockdown cells were then transiently transfected with expression constructs encoding either the wild type collagen X or one of the following four MCDS-causing mutant forms of the protein: p.N617K, p.G618V, p.Y598D, and NC1del10. 48 h post transfection, RNA was extracted and analysed with real time qPCR for the expression of (a) ATF6α, (b) ATF6βand (g) COL10A1. The level of ATF6α and ATF6β mRNAs relative to β-actin was normalised against the untransfected cells. The level of COL10A1 mRNA relative to β-actin was normalised against the cells expressing the wild type collagen X. Mean ± SEM (n = 5). *p < 0.05, **p < 0.01, ***p < 0.001, ****p < 0.0001. All data were analysed for statistical significance by ANOVA. Typical western blots for ATF6α and ATF6β proteins in ATF6α or ATF6β siRNA-mediated knocked down cells expressing (c) N671 K (d) NC1del10, (e) Y598D, and (f) G618 V mutants forms of collagen X.
S2 Fig
S2 Fig
Effects of ATF6α and ATF6β knockdown on general markers of ER stress in cells expressing different MCDS-causing mutant forms of collagen X protein. The expression of either ATF6α or ATF6β was knocked down in HeLa cells using siRNAs. The siRNA-mediated ATF6α or ATF6β knockdown cells were then transiently transfected with expression constructs encoding either the wild type collagen X or one of the following four MCDS-causing mutant forms of the protein: p.N617K, p.G618V, p.Y598D, and NC1del10. 24 h after transfection of the MCDS constructs, cell lysates were extracted and analysed with qPCR for mRNA of (a) BIP, (b) CHOP, (c) ARMET and (d) CRELD2. Mean ± SEM (n = 5). *p < 0.05, **p < 0.01, ***p < 0.001, ****p < 0.0001. Untransfected cells (UTF) served as controls.
S3 Fig
S3 Fig
ATF6 independent measure of ER stress induced by four different MCDS-causing mutations in cells that were knocked down either for ATF6α or ATF6β. The expression of either ATF6α or ATF6β was knocked-down in HeLa cells using siRNAs. These cells were then transiently transfected with expression constructs encoding either the wild type collagen X or one of the four MCDS-causing mutant forms of the protein: p.N617K, p.G618V, p.Y598D, and NC1del10. 24 h after transfection of the MCDS constructs (a) RNA was extracted and analysed with real time qPCR for the expression of the spliced XBP1, XBP1s. The level of XBP1s relative to β-actin was normalised against the untransfected cells. Mean ± SEM (n = 5); and (b) cell lysates were prepared and immunoblotted using an anti- ATF4 antibody. The level of ATF4 protein relative to GAPDH loading control was standardised to the cells expressing the same type of MCDS-causing collagen X mutation. Values represent Mean ± SEM from three independent experiments. *p < 0.05, **p < 0.01, ***p < 0.001, ****p < 0.0001 as determined by ANOVA. UTF: Untransfected cells. Typical western blots for ATF4 and collagen X proteins in ATF6α or ATF6β siRNA-mediated knocked down cells expressing (c) N671 K (d) NC1del10, (e) Y598D, and (f) G618 V mutants forms of collagen X.
S4 Fig
S4 Fig
Characterisation of three week old mice that were knockout for Atf6α. (a) H & E staining of tibial growth plate from mice with specified genotype at three weeks of age (RZ = resting zone, PZ = Proliferative zone, and HZ = hypertrophic zone). (b) Measurement of widths of proliferative and hypertrophic zones. Mean ± SEM (N). (c) A typical X-ray image from three week old mice that were either wild type or knockout for Atf6α. White scale bar = 100 μm (f). Body measurements at three weeks of age. Mean ± SEM (N).
S5 Fig
S5 Fig
Effects of Atf6β ablation on the skeletal development and body weight of three week old MCDS mice. (a) A representative X-ray radiograph image for three-week old male (top row) and female (bottom row) MCDS mice with the specified genotypes. White scale bar = 100 μm (b) Mean ± SEM (N). *p < 0.05,**p < 0.01, and ***p < 0.001 when compared to Atf6β+/+/MCDS. All statistical analysis by ANOVA.
S6 Fig
S6 Fig
Analysis of mouse ribs growth plate extracts for the expression of Bip, Chop, and Creld2 mRNAs in the absence of Atf6α or Atf6β. Total RNA from at least two pooled ribs growth plate extracts of 21-day old mice were extracted and analysed with qPCR for mRNA of (a & d) Bip, (b & e) Chop, and (c & f) Creld2. Mean ± SEM (n ≥ 3). *p < 0.05, **p < 0.01, ***p < 0.001, ****p < 0.0001.

Similar articles

Cited by

References

    1. Boot-Handford R.P., Briggs M.D. The unfolded protein response and its relevance to connective tissue diseases. Cell Tissue Res. 2010 Jan;339(1):197–211. - PMC - PubMed
    1. Parmar V.M., Schroder M. Sensing endoplasmic reticulum stress. Adv. Exp. Med. Biol. 2012;738:153–168. - PubMed
    1. Dufey E., Sepulveda D., Rojas-Rivera D., Hetz C. Cellular mechanisms of endoplasmic reticulum stress signaling in health and disease. 1. An overview. Am. J. Phys. Cell Phys. 2014 Oct 1;307(7):C582–94. - PubMed
    1. Patterson S.E., Dealy C.N. Mechanisms and models of endoplasmic reticulum stress in chondrodysplasia. Dev. Dyn. 2014 Jul;243(7):875–893. - PubMed
    1. Bateman J.F., Wilson R., Freddi S., Lamande S.R., Savarirayan R. Mutations of COL10A1 in Schmid metaphyseal chondrodysplasia. Hum. Mutat. 2005 Jun;25(6):525–534. - PubMed

Publication types

MeSH terms

Supplementary concepts