. 2018 May 10:277:89-101.
doi: 10.1016/j.jconrel.2018.03.006. Epub 2018 Mar 6.

Transferrin-targeted, resveratrol-loaded liposomes for the treatment of glioblastoma

Affiliations

Transferrin-targeted, resveratrol-loaded liposomes for the treatment of glioblastoma

Aditi Jhaveri et al. J Control Release. .

Abstract

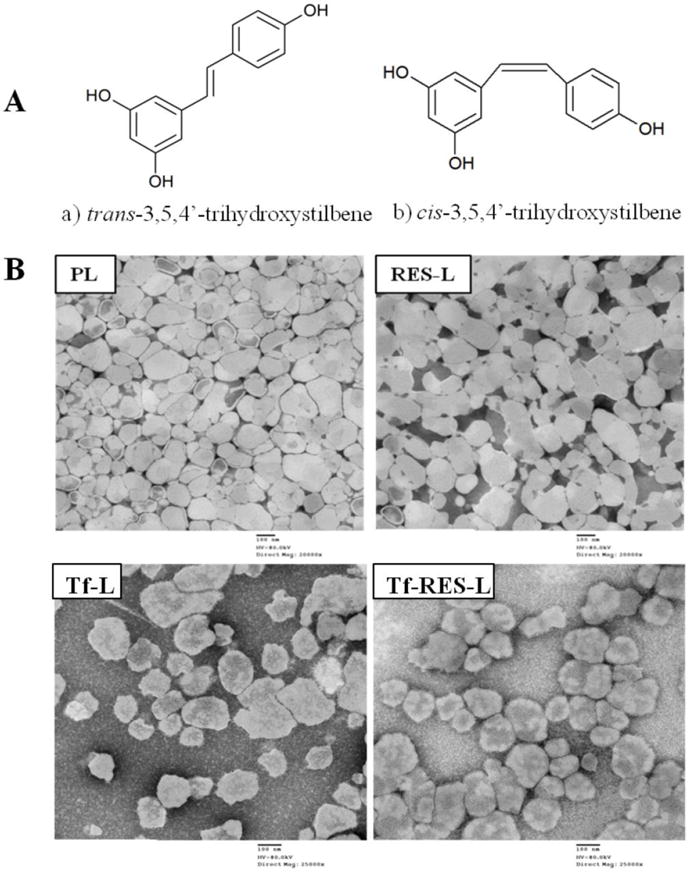
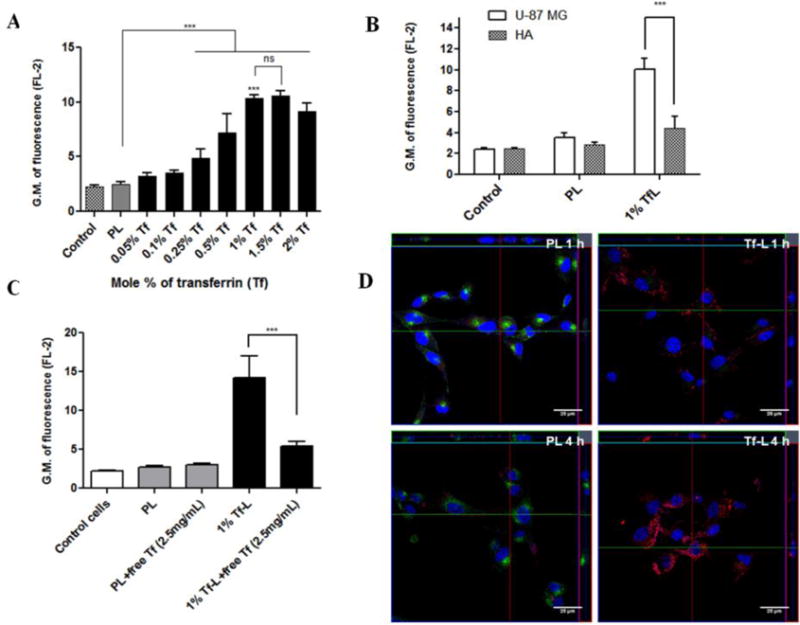
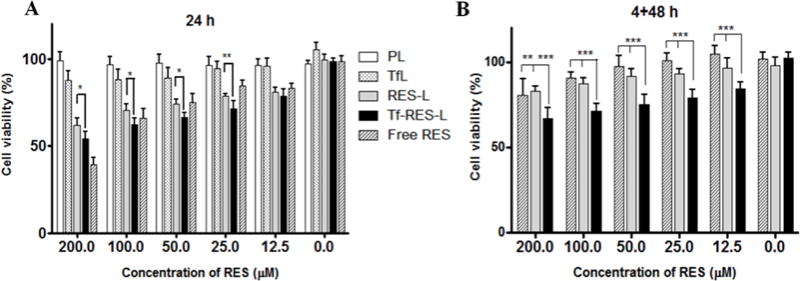
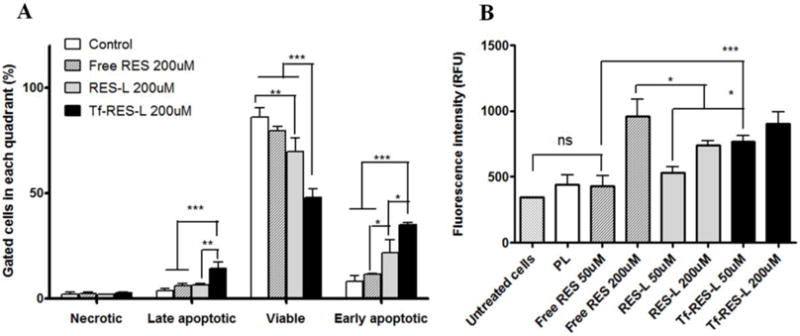
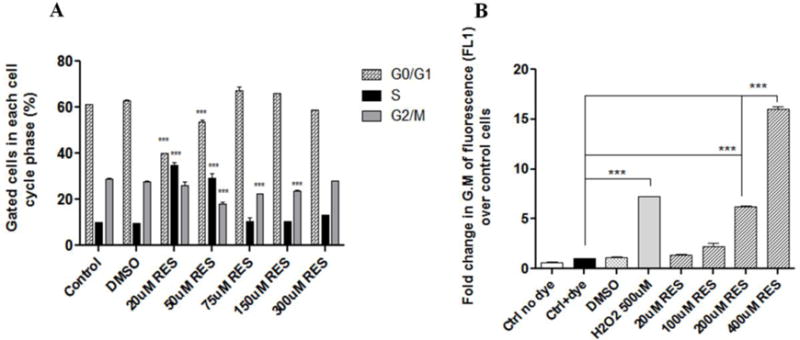
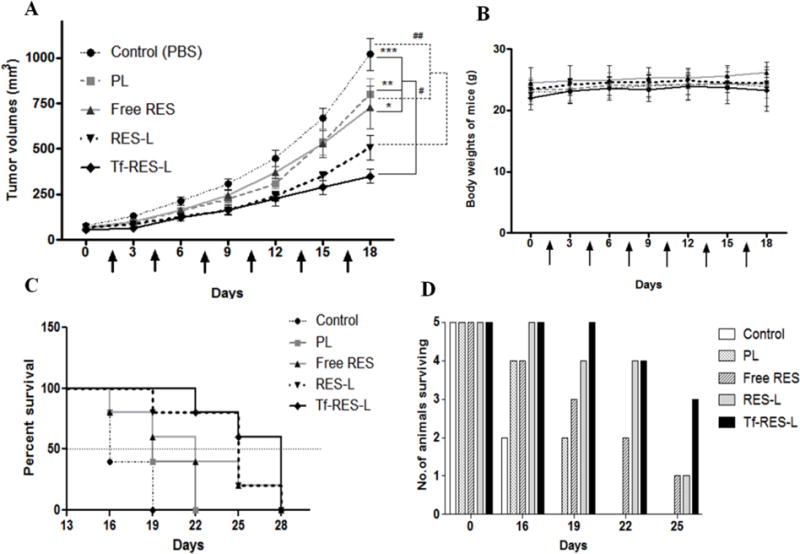
Glioblastomas (GBMs) are highly aggressive brain tumors with a very grim prognosis even after multi-modal therapeutic regimens. Conventional chemotherapeutic agents frequently lead to drug resistance and result in severe toxicities to non-cancerous tissues. Resveratrol (RES), a natural polyphenol with pleiotropic health benefits, has proven chemopreventive effects in all the stages of cancer including initiation, promotion and progression. However, the poor physico-chemical properties of RES severely limit its use as a free drug. In this study, RES was loaded into PEGylated liposomes (RES-L) to counter its drawbacks as a free drug. Since transferrin receptors (TfRs) are up-regulated in GBM, the liposome surface was modified with transferrin moieties (Tf-RES-L) to make them cancer cell-specific. The liposomal nanomedicines developed in this project were aimed at enhancing the physico-chemical properties of RES and exploiting the passive and active targeting capabilities of liposomes to effectively treat GBM. The RES-L were stable, had a good drug-loading capacity, prolonged drug-release in vitro and were easily scalable. Flow cytometry and confocal microscopy were used to study the association with, and internalization of, Tf-L into U-87 MG cells. The Tf-RES-Ls were significantly more cytotoxic and induced higher levels of apoptosis accompanied by activation of caspases 3/7 in GBM cells when compared to free RES or RES-L. The ability of RES to arrest cells in the S-phase of the cell cycle, and selectively induce production of reactive oxygen species in cancer cells were probably responsible for its cytotoxic effects. The therapeutic efficacy of RES formulations was evaluated in a subcutaneous xenograft mouse model of GBM. A tumor growth inhibition study and a modified survival study showed that Tf-RES-Ls were more effective than other treatments in their ability to inhibit tumor growth and improve survival in mice. Overall, the liposomal nanomedicines of RES developed in this project exhibited favorable in vitro and in vivo efficacies, which warrant their further investigation for the treatment of GBMs.

Keywords: Cancer; Drug delivery; Glioblastoma; Liposomes; Resveratrol; Targeting; Transferrin.


Conflict of interest statement

Conflicts of interest: None

Figures

Figure 1
Figure 1. Chemical structure of resveratrol and TEM images
(A) Stereoisomers of resveratrol (a&b). The trans isomer is the biologically active form of the drug (B) Transmission electron microscopy (TEM) images of PL and RES-L at 20000X direct magnification and of Tf- L and Tf-RES-L at 25,000X direct magnification (Scale bar 100 nm).
Figure 2
Figure 2. Cell association and internalization of Tf-L
(A) U-87 MG cells were treated with Rh- labeled Tf-L with varying Tf densities (0.05-2 mol %) on their surface for 4 h. (B) U-87 MG and HA were treated with Rh-labeled PL and 1%Tf-L for 4 h. (C) U-87 MG cells were treated with Rh-labeled Tf-L for 4 h either with or without pre-treatment with free Tf (2.5 mg/ml) for 30 min to study the competitive inhibition of Tf-L uptake. Data are plotted as geometric mean of fluorescence in the FL-2 channel (mean ±SD) from at least three independent observations. (D) U-87 MG cells were treated with Rh-labeled PL and 1% Tf-L at a final lipid concentration of 0.1 mg/ml for 1 h (top panel) or 4 h (bottom panel) respectively. Nucleus was stained with Hoechst 33342, and Tf-Alexa Fluor 680® was used as the endosomal marker. The cells were analyzed by confocal microscopy. Scale bar, 25 μm. Representative orthogonal projections of PL and Tf-L treated cells at 1 h and 4 h showing XY, YZ and XZ planes respectively. The main image shows the XY plane, the section to the right on the image represents the YZ plane and the section at the top of the image shows the XZ plane of the image.
Figure 3
Figure 3. Cytotoxicity of RES formulations
(A) U-87 MG cells were treated with free RES, RES-L or Tf-RES-L continuously for 24 h or for (B) 4 h followed by a wash and an additional 48 h, before assessment of cytotoxicity. PL and Tf-L were used as controls. Cells were treated with formulations containing 12.5-200 μM RES. Data are plotted as mean ±SD, averaged from triplicate wells in at least 3 independent experiments. One-way ANOVA was used to compare between groups, p < 0.05 was considered significant (*p<0.05, **p < 0.01, ***p< 0.001).
Figure 4
Figure 4. Apoptosis and caspase 3/7 activity in U-87 MG cells
(A) U-87 MG cells were treated with RES formulations for 24 h before staining with AnV- Alexa Fluor 488® and PI and analyzed by flow cytometry. Untreated cells served as controls. The fluorescence of PI was recorded in the FL-3 channel and that of AnV was recorded in the FL-1 channel. Cells labeled with one or both the compounds were analyzed using a quadrant plot. (B) U-87 MG cells were treated with formulations for 24 h. After removal of the drug containing media, caspase reagent was added to the cells. The fluorescence was read after 4 h. The fluorescent product generated was proportional to the amount of caspase-3/7 cleavage activity of the sample. Data are represented as mean ± SD, from three separate studies. One-way ANOVA was used to compare between groups, p < 0.05 was considered significant (* p< 0.05, **p < 0.01, ***p< 0.001).
Figure 5
Figure 5. Effect of RES on cell cycle and ROS generation in U-87 MG cells
(A) Cells were treated with free RES in DMSO (0-300 μM) for 24 h. Following treatments, cells were collected and processed for cell-cycle analysis. All comparisons are with the control (untreated) cells. (B) Cells were treated with CM-H2DCFDA (1 μM) for 30 min, followed by treatments for 1 h with free RES (20-400 μM) to study the generation of ROS. Following the 1 h incubation, cells were processed for flow cytometry. Results are represented as fold change in the geometric mean of fluorescence (FL-1) over control cells (B). Data are plotted as mean ±SD, averaged from triplicate wells in at least 3 independent experiments. One-way ANOVA was used to compare between groups, p <0.05 was considered significant (***p< 0.001).
Figure 6
Figure 6. Effects of RES formulations on tumor growth inhibition and survival in U-87 MG tumor xenograft bearing mice
(A) The figure represents a line-graph for the tumor growth inhibition study. Arrows indicate the treatments, which were administered every third day. Statistical comparisons are shown at the end of the treatment period. The solid lines and * show comparison of the PBS, PL and free RES groups with the Tf-RES-L group, and the dashed lines and # show comparisons between the PBS and PL groups with the RES-L group. Tumor volumes are represented as Mean ± SEM for 5 animals per each treatment group. Two-tailed Student’s t- tests were used to compare between treatment groups and p < 0.05 was considered statistically significant (* p <0.05, ** p < 0.01and *** p < 0.001) (B) Body weights of mice recorded during the study. Data are represented as mean ± SD for each group of animals. (C) A modified survival analysis was carried out for all the mice that were included in the tumor-inhibition study (n=5 per group). The end point was a tumor volume of 1000 mm3. Kaplan-Meier survival curves were plotted for each treatment group and the data were analyzed using the Log-rank (Mantel-Cox) test, p < 0.05 was considered significant. (D) Column graph of the number of animals surviving in each treatment group during a 25-day period.

References

    1. Ostrom QT, Gittleman H, Liao P, Rouse C, Chen Y, Dowling J, Wolinsky Y, Kruchko C, Barnholtz-Sloan J. CBTRUS statistical report: primary brain and central nervous system tumors diagnosed in the United States in 2007-2011. Neuro Oncol. 2014;16(Suppl 4):iv1–63. - PMC - PubMed
    1. Stupp R, Hegi ME, Mason WP, van den Bent MJ, Taphoorn MJ, Janzer RC, Ludwin SK, Allgeier A, Fisher B, Belanger K, Hau P, Brandes AA, Gijtenbeek J, Marosi C, Vecht CJ, Mokhtari K, Wesseling P, Villa S, Eisenhauer E, Gorlia T, Weller M, Lacombe D, Cairncross JG, Mirimanoff RO. Effects of radiotherapy with concomitant and adjuvant temozolomide versus radiotherapy alone on survival in glioblastoma in a randomised phase III study: 5-year analysis of the EORTC-NCIC trial. Lancet Oncol. 2009;10:459–466. - PubMed
    1. Friedmann-Morvinski D. Glioblastoma heterogeneity and cancer cell plasticity. Crit Rev Oncog. 2014;19:327–336. - PubMed
    1. Liu A, Hou C, Chen H, Zong X, Zong P. Genetics and Epigenetics of Glioblastoma: Applications and Overall Incidence of IDH1 Mutation. Front Oncol. 2016;6:16. - PMC - PubMed
    1. Singh SK, Hawkins C, Clarke ID, Squire JA, Bayani J, Hide T, Henkelman RM, Cusimano MD, Dirks PB. Identification of human brain tumour initiating cells. Nature. 2004;432:396–401. - PubMed

Publication types

MeSH terms