

Alloxan-induced diabetes exacerbates coronary atherosclerosis and calcification in Ossabaw miniature swine with metabolic syndrome
- PMID: 29523165
- PMCID: PMC5845376
- DOI: 10.1186/s12967-018-1431-9
Alloxan-induced diabetes exacerbates coronary atherosclerosis and calcification in Ossabaw miniature swine with metabolic syndrome
Abstract
Background: There is a preponderance of evidence implicating diabetes with increased coronary artery disease (CAD) and calcification (CAC) in human patients with metabolic syndrome (MetS), but the effect of diabetes on CAD severity in animal models remains controversial. We investigated whether diabetes exacerbates CAD/CAC and intracellular free calcium ([Ca2+]i) dysregulation in the clinically relevant Ossabaw miniature swine model of MetS.
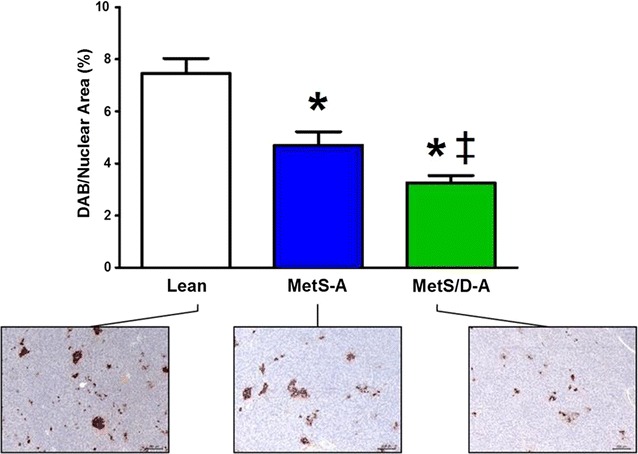
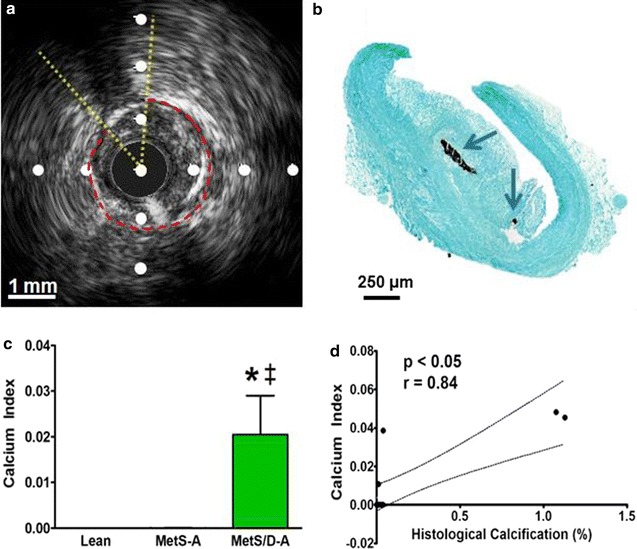
Methods: Sixteen swine, eight with alloxan-induced diabetes, were fed a hypercaloric, atherogenic diet for 6 months. Alloxan-induced pancreatic beta cell damage was examined by immunohistochemical staining of insulin. The metabolic profile was confirmed by body weight, complete blood panel, intravenous glucose tolerance test (IVGTT), and meal tolerance test. CAD severity was assessed with intravascular ultrasound and histology. [Ca2+]i handling in coronary smooth muscle (CSM) cells was assessed with fura-2 ratiometric imaging.
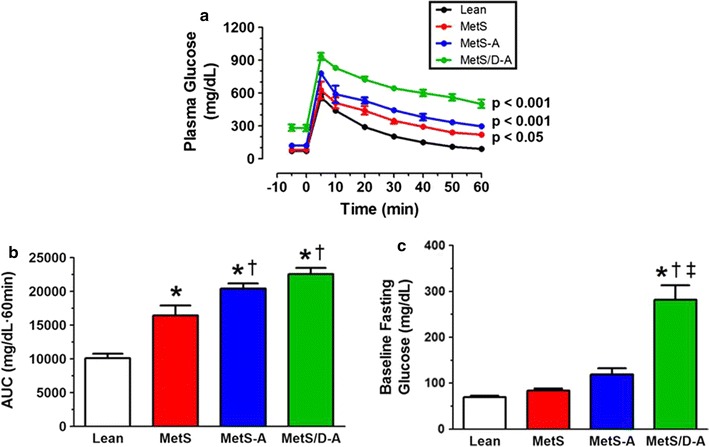
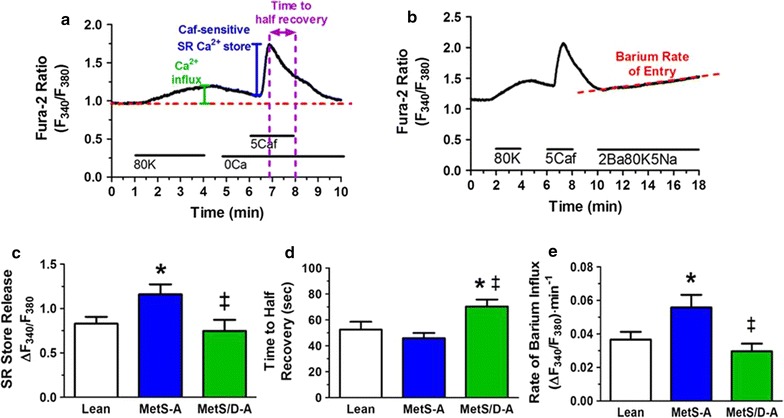
Results: Fasting and post-prandial blood glucose, total cholesterol, and serum triglycerides were elevated in MetS-diabetic swine. This group also exhibited hypoinsulinemia during IVGTT and less pancreatic beta cell mass when compared to lean and MetS-nondiabetic swine. IVUS analysis revealed that MetS-diabetic swine had greater percent wall coverage, percent plaque burden, and calcium index when compared to lean and MetS-nondiabetic swine. Fura-2 imaging of CSM [Ca2+]i revealed that MetS-nondiabetic swine exhibited increased sarcoplasmic reticulum Ca2+ store release and Ca2+ influx through voltage-gated Ca2+ channels compared to lean swine. MetS-diabetic swine exhibited impaired Ca2+ efflux.
Conclusions: Diabetes exacerbates coronary atherosclerosis and calcification in Ossabaw miniature swine with MetS, accompanied by progression of [Ca2+]i dysregulation in advanced CAD/CAC. These results recapitulate increased CAD in humans with diabetes and establish Ossabaw miniature swine as an animal model for future MetS/diabetes comorbidity studies.
Keywords: Atherosclerosis; Calcium dysregulation; Calcium index; Intravascular ultrasound; Metabolism; Obesity.
Figures


Similar articles
-
Effect of metabolic syndrome and aging on Ca2+ dysfunction in coronary smooth muscle and coronary artery disease severity in Ossabaw miniature swine.Exp Gerontol. 2018 Jul 15;108:247-255. doi: 10.1016/j.exger.2018.04.024. Epub 2018 May 3. Exp Gerontol. 2018. PMID: 29730333 Free PMC article.
-
Biphasic alterations in coronary smooth muscle Ca(2+) regulation in a repeat cross-sectional study of coronary artery disease severity in metabolic syndrome.Atherosclerosis. 2016 Jun;249:1-9. doi: 10.1016/j.atherosclerosis.2016.03.032. Epub 2016 Mar 26. Atherosclerosis. 2016. PMID: 27062403 Free PMC article.
-
Intracellular Ca2+ Dysregulation in Coronary Smooth Muscle Is Similar in Coronary Disease of Humans and Ossabaw Miniature Swine.J Cardiovasc Transl Res. 2022 Feb;15(1):167-178. doi: 10.1007/s12265-021-10153-5. Epub 2021 Jul 20. J Cardiovasc Transl Res. 2022. PMID: 34286469 Free PMC article.
-
Ca2+ regulatory mechanisms of exercise protection against coronary artery disease in metabolic syndrome and diabetes.J Appl Physiol (1985). 2011 Aug;111(2):573-86. doi: 10.1152/japplphysiol.00373.2011. Epub 2011 May 19. J Appl Physiol (1985). 2011. PMID: 21596923 Free PMC article. Review.
-
The metabolic syndrome, its component risk factors, and progression of coronary atherosclerosis.Arch Intern Med. 2010 Mar 8;170(5):478-84. doi: 10.1001/archinternmed.2009.551. Arch Intern Med. 2010. PMID: 20212186
Cited by
-
Camel milk ameliorates diabetes in pigs by preventing oxidative stress, inflammation and enhancing beta cell function.J Diabetes Metab Disord. 2022 Sep 16;21(2):1625-1634. doi: 10.1007/s40200-022-01112-1. eCollection 2022 Dec. J Diabetes Metab Disord. 2022. PMID: 36404858 Free PMC article.
-
Glycemic variability is associated with vascular calcification by the markers of endoplasmic reticulum stress-related apoptosis, Wnt1, galectin-3 and BMP-2.Diabetol Metab Syndr. 2019 Aug 19;11:67. doi: 10.1186/s13098-019-0464-4. eCollection 2019. Diabetol Metab Syndr. 2019. PMID: 31452690 Free PMC article.
-
The proteomic profile is altered but not repaired after bariatric surgery in type 2 diabetes pigs.Sci Rep. 2024 May 3;14(1):10235. doi: 10.1038/s41598-024-60022-9. Sci Rep. 2024. PMID: 38702370 Free PMC article.
-
Candidate SNP Markers of Atherogenesis Significantly Shifting the Affinity of TATA-Binding Protein for Human Gene Promoters show stabilizing Natural Selection as a Sum of Neutral Drift Accelerating Atherogenesis and Directional Natural Selection Slowing It.Int J Mol Sci. 2020 Feb 5;21(3):1045. doi: 10.3390/ijms21031045. Int J Mol Sci. 2020. PMID: 32033288 Free PMC article.
-
Effect of Age on Diabetogenicity of Alloxan in Ossabaw Miniature Swine.Comp Med. 2019 Apr 1;69(2):114-122. doi: 10.30802/AALAS-CM-18-000037. Epub 2019 Mar 20. Comp Med. 2019. PMID: 30894246 Free PMC article.
References
-
- Alexander CM, Landsman PB, Teutsch SM, Haffner SM, Third National H, Nutrition Examination S. National cholesterol education P: NCEP-defined metabolic syndrome, diabetes, and prevalence of coronary heart disease among NHANES III participants age 50 years and older. Diabetes. 2003;52:1210–1214. doi: 10.2337/diabetes.52.5.1210. - DOI - PubMed
Publication types
MeSH terms
Substances
Grants and funding
LinkOut - more resources
Full Text Sources
Other Literature Sources
Medical
Miscellaneous
