. 2018 Mar 20;48(3):542-555.e6.
doi: 10.1016/j.immuni.2018.02.012. Epub 2018 Mar 6.

Mitochondria-Endoplasmic Reticulum Contact Sites Function as Immunometabolic Hubs that Orchestrate the Rapid Recall Response of Memory CD8+ T Cells

Affiliations

Mitochondria-Endoplasmic Reticulum Contact Sites Function as Immunometabolic Hubs that Orchestrate the Rapid Recall Response of Memory CD8+ T Cells

Glenn R Bantug et al. Immunity. .

Abstract

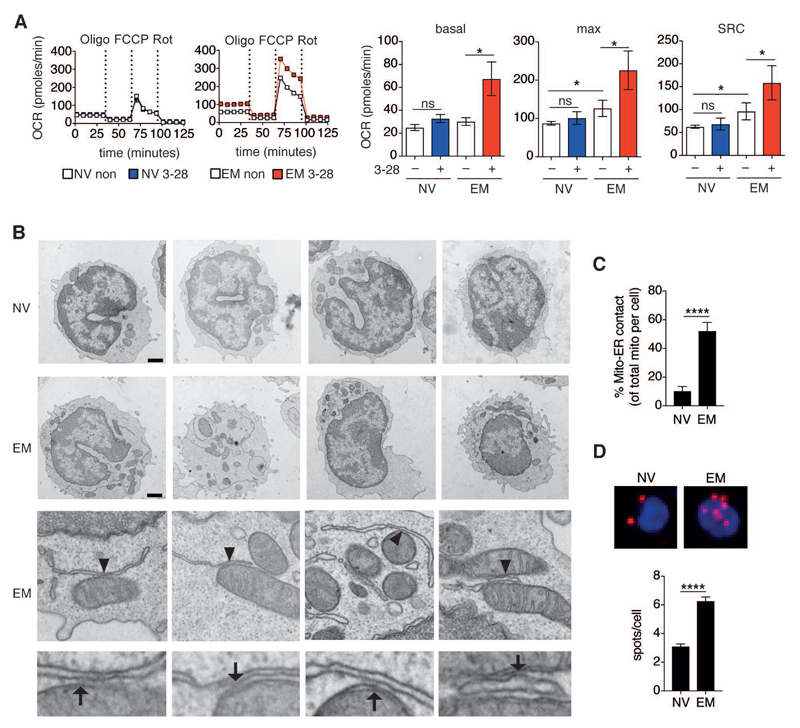
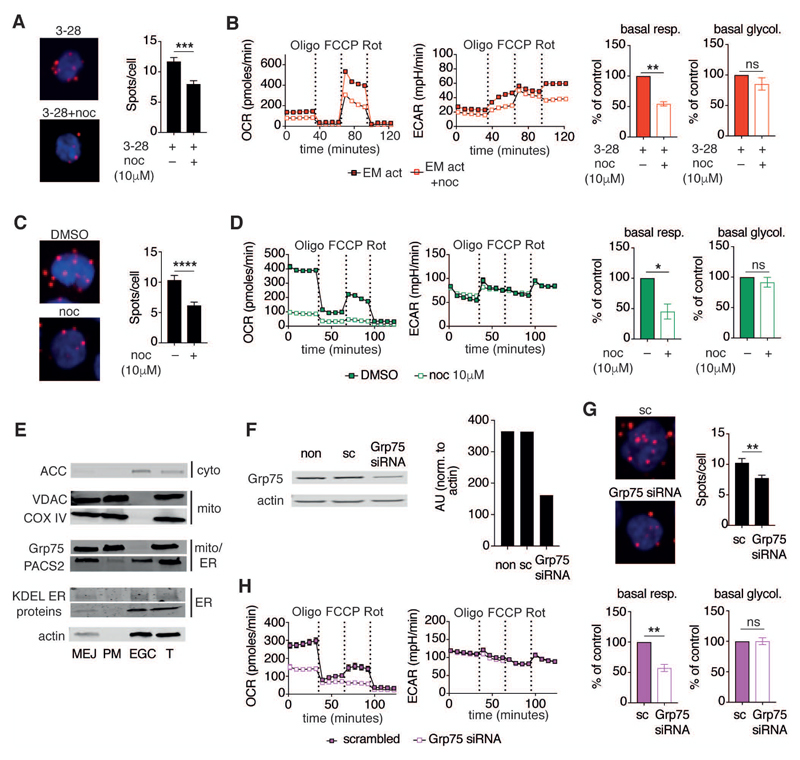
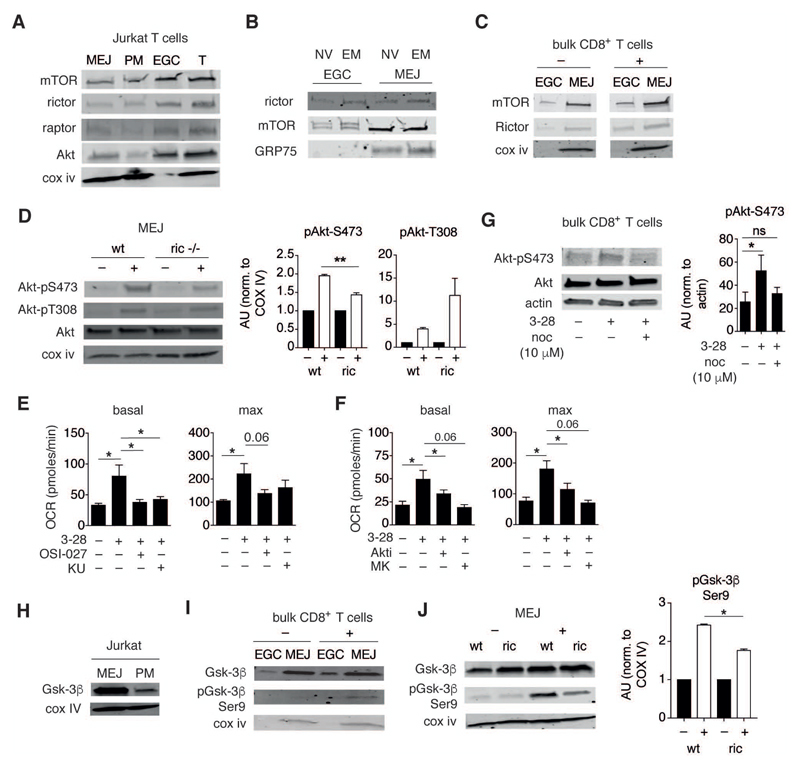
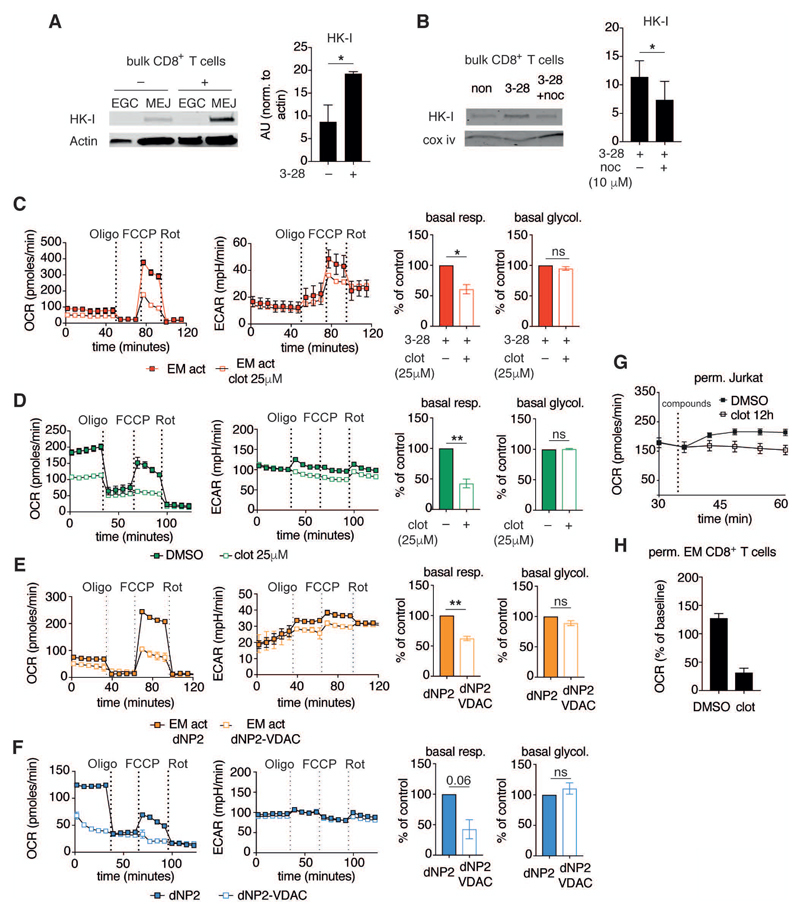
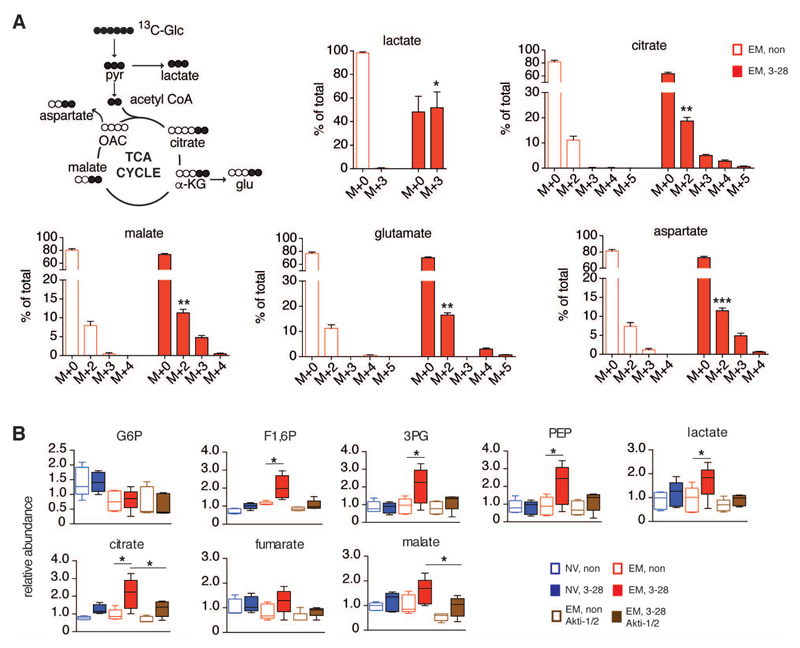
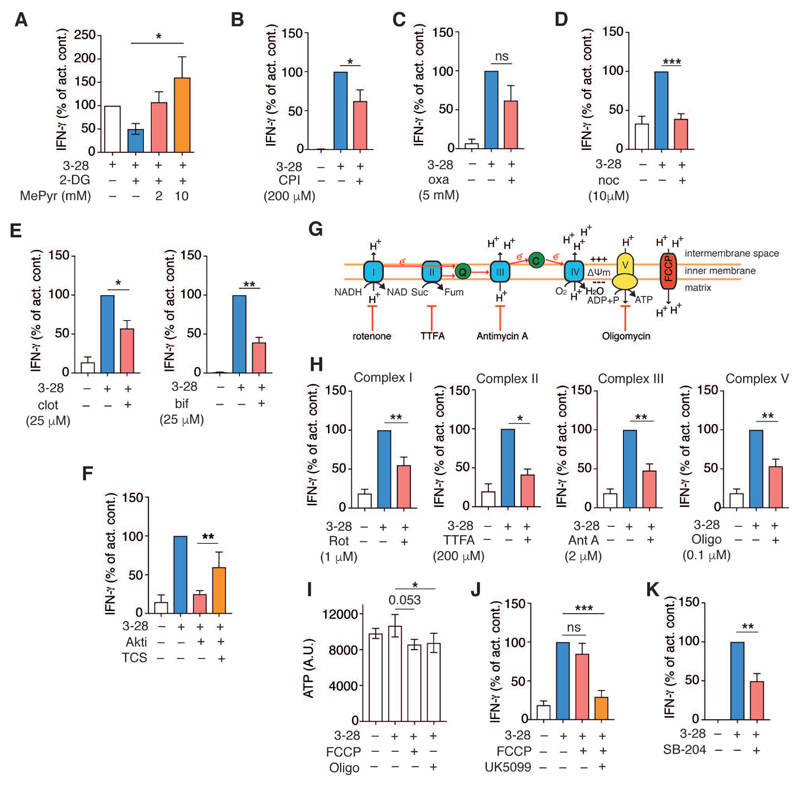
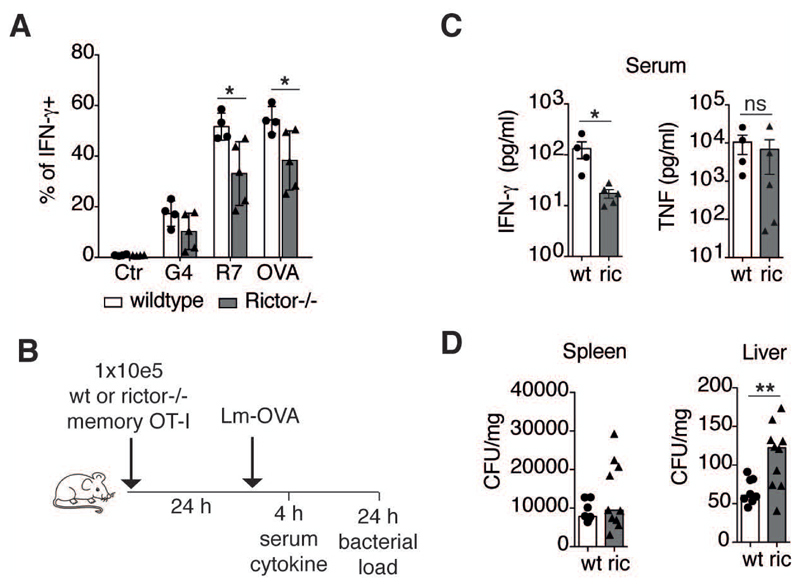
Glycolysis is linked to the rapid response of memory CD8+ T cells, but the molecular and subcellular structural elements enabling enhanced glucose metabolism in nascent activated memory CD8+ T cells are unknown. We found that rapid activation of protein kinase B (PKB or AKT) by mammalian target of rapamycin complex 2 (mTORC2) led to inhibition of glycogen synthase kinase 3β (GSK3β) at mitochondria-endoplasmic reticulum (ER) junctions. This enabled recruitment of hexokinase I (HK-I) to the voltage-dependent anion channel (VDAC) on mitochondria. Binding of HK-I to VDAC promoted respiration by facilitating metabolite flux into mitochondria. Glucose tracing pinpointed pyruvate oxidation in mitochondria, which was the metabolic requirement for rapid generation of interferon-γ (IFN-γ) in memory T cells. Subcellular organization of mTORC2-AKT-GSK3β at mitochondria-ER contact sites, promoting HK-I recruitment to VDAC, thus underpins the metabolic reprogramming needed for memory CD8+ T cells to rapidly acquire effector function.

Keywords: Akt; GSK3-beta; IFN-gamma; VDAC; endoplasmic reticulum; glycolysis; hexokinase; mTOR; memory CD8(+) T cells; mitochondria.


Figures

Figure 1
Figure 1. Effector memory CD8+ T cells selectively increase respiration upon activation and possess abundant mitochondria-associated ER membranes
(A) Left, representative mitochondrial perturbation assays of naïve (NV) and effector memory (EM) human CD8+ T cells left non-activated (non) or activated for 12 h with plate bound α-CD3 (5 μg/ml) and soluble α-CD28 (5 μg/ml) mAb (3-28). Mitochondrial perturbation was performed by sequential treatment with oligomycin (Oligo, 1 μM), FCCP (2 μM) and rotenone (Rot, 130 nM). Oxygen consumption rate (OCR) was measured by metabolic flux analysis. Right, Summary bar graphs showing calculated basal respiration, maximal respiration (max) and spare respiratory capacity (SRC) in non-activated (–) or activated (+) NV and EM human CD8+ T cells (n = 6 donors). (B) Transmission electron microscopy images of human NV (top panel) and EM (middle and bottom panels) CD8+ T cells. Arrowheads mark mitochondria and ER contact sites that were digitally magnified in the bottom panel (representative of n = 3 donors). Arrows show electron dense regions of mitochondria–ER junctions. Scale bars = 1000 nm. C) Percentage of mitochondria–ER contact sites per cell in NV (n = 15) and EM (n = 13) CD8+ T cells (n = 3 donors). (D) Top, representative proximity ligation assay (PLA) images of freshly sorted NV (left) and EM (right) CD8+ T cells probed with α-IP3R1 and α-VDAC1 antibodies. Red spots indicate contact sites between mitochondria (α-VDAC) and ER (α-IP3R). Cells were counterstained with DAPI (blue). Bottom, quantitative analysis of PLA from 3 donors; NV (n = 72 cells) and EM (n = 73 cells). Data are presented as mean±SEM. Two-tailed paired Wilcoxon signed rank tests (A) and two-tailed unpaired Student’s t test (C,D) were used to compare groups. * P < 0.05, **** P < 0.0001, ns = not significant. See also Figure S1.
Figure 2
Figure 2. Dissociation of mitochondria–ER contacts diminishes mitochondrial respiration but not glycolysis
(A) Left, representative PLA images of EM CD8+ T cells activated for 12 h with α-CD3/α-CD28 (3-28) mAb as in Figure 1A and concomitantly treated with DMSO (top) or nocodazole (10 μM, bottom). Cells were stained as in Figure 1D. Right, representative summary bar graph of PLA from 1 of 3 donors treated with DMSO (n = 28 cells) or nocodazole (n = 23 cells). (B) Left, representative mitochondrial perturbation assay of EM CD8+ T cells activated as in Figure 1A or activated in the additional presence of nocodazole (10 μM). Right, bar graphs of basal respiration and glycolysis (n = 4 donors). (C) Left, representative PLA images of Jurkat T cells cultured in the presence of DMSO (top) or nocodazole (10 μM, bottom) for 12 h. Right, bar graph showing the number of detected mitochondria–ER junctions per cell in DMSO (n = 17) and nocodazole (n = 17) treated cells. Representative of n = 2 independent experiments. (D) Left, representative mitochondrial perturbation assay of Jurkat T cells cultured as in (C). Right, bar graphs of basal respiration and glycolysis of control and nocodazole treated Jurkat T cells (n = 3 independent experiments). (E) Immunoblot of cellular fractions and total cell lysates (T) from Jurkat T cells. Cells were separated into fractions containing mitochondria–ER junctions (MEJ), pure mitochondria (PM), and remaining supernatant from MEJ (containing the majority of ER, Golgi, and cytoplasm – EGC). Blots were probed with antibodies targeting ACC, VDAC, Cox iv, Grp75, PACS2, KDEL motifs, and actin. (F) Left, immunoblot analysis of lysates from non-transfected (non), scrambled siRNA (sc) transfected, and Grp75 siRNA (siRNA) transfected Jurkat T cells. Cells were cultured for 72 h after transfection. Blots were probed with Grp75 and actin antibodies. Right, quantification of Grp75 abundance in control and Grp75 siRNA transfected lysates normalized to actin (representative of n = 3 independent experiments). (G) PLA images (left) and quantification of mitochondria–ER contact abundance (right) of control (sc, n = 32) and Grp75 siRNA (n = 63) transfected cells (n = 2 independent experiments). (H) Left, representative mitochondrial perturbation assay of Jurkat T cells cultured for 72 h after transfection with scrambled (sc) and Grp75 targeted siRNA. Right, bar graphs of basal respiration and glycolysis from control (sc) and Grp75 siRNA transfected Jurkat T cells (n = 3 independent experiments). Data are presented as mean±SEM. Two-tailed unpaired (A,C,G), and paired (B,D,H) Student’s t tests were used to compare groups. * P < 0.05, ** P < 0.01, *** P < 0.001 **** P < 0.0001, ns = not significant. See also Figure S2.
Figure 3
Figure 3. mTORC2, Akt and Gsk-3β signaling components are present in mitochondria–ER junctions
(A) Immunoblots of MEJ, PM, and EGC fractions and total lysate (T) from Jurkat T cells. Blots were probed with mTOR, rictor, raptor, and Akt antibodies. Cox iv was used as loading and fraction-validation control (representative of n = 3 independent experiments). (B) Immunoblots of EGC and MEJ fractions from NV and EM human CD8+ T cells probed with antibodies specific for rictor and mTOR. GRP75 was used to validate the respective fractions (representative of n = 2 independent samples, each sample consisted of 4x10⁷ sorted cells, pooled from 2-4 donors). (C) Immunoblot analysis of EGC and MEJ fractions from bulk CD8+ T cells treated with non-loaded control beads (–) or activated with α-CD3/α-CD28 mAb loaded beads (+) for 2 h. Blots were probed with mTOR and rictor antibodies. Cox iv was used as fraction validation control (representative of n = 3 independent experiments). (D) Left, immunoblot analysis of MEJ fractions from wild type (wt) and rictor KO memory CD8+ T cells re-stimulated with OVA peptide for 1 h (+), or from non-activated counterparts (–). Blots were probed for total Akt, pAkt-S473, pAkt-T308, and Cox iv. Right, quantification was performed by normalization of targets to Cox iv. Bar graphs show fold change in Akt phosphorylation following activation relative to non-activated controls (n = 3 independent experiments). (E,F) Summary of metabolic flux analysis on EM CD8+ T cells activated and assayed as in Figure 1A. Cells were treated with inhibitors of mTOR (OSI-027, 10 μM, and KU0063794, 10 μM) (E), or Akt (Akti, 10 μM, and MK2206, 10 μM) (F). Bar graphs show basal and maximal respiration (n = 4-8 donors). (G) Immunoblot analysis of total cell lysates from EM CD8+ T cells activated for 2 h with α-CD3/α-CD28 mAb loaded beads only, or similarly activated in presence of nocodazole (10 μM). Bar graph shows Akt-Ser473 phosphorylation normalized to actin (n = 3 independent experiments). (H) Immunoblots of MEJ and PM fractions from Jurkat T cells. Blots were probed with Gsk-3β and Cox iv antibodies (representative of n = 3 independent experiments). (I) Immunoblots of MEJ and EGC fractions from bulk CD8+ T cells either left unstimulated (–) or activated (+) with α-CD3/α-CD28 mAb loaded beads for 2 h. Blots were probed for total Gsk-3β, pGsk-3β Ser9, and Cox iv (representative of n = 3 donors). (J) Left, immunoblot analysis of wt and rictor KO memory OT-I cells activated as in Figure 3D. MEJ fractions were probed for Gsk-3β, pGsk-3β Ser9 and Cox iv. Right, bar graphs display fold change in phosphoprotein levels relative to non-activated controls (n = 3 independent experiments). Data are presented as mean±SEM. Two-tailed paired Student’s t test (D,E,F,G,J) were used to compare groups. * P < 0.05, ** P < 0.01, ns = not significant. See also Figure S3.
Figure 4
Figure 4. HK-I binding to VDAC regulates mitochondrial metabolism
(A) Left, MEJ and EGC fractions from bulk human CD8+ T cells activated as in Figure 1A for 2 h. Immunoblots were probed for HK-I and actin. Right, summary bar graph of HK-I abundance in the mitochondria / mitochondria–ER junctions containing fraction normalized to actin (n = 3 donors). (B) Left, Immunoblot of MEJ fractions from bulk human CD8+ T cells activated as in (A), or activated in the presence of nocodazole (10 μM). Right, summary bar graph of HK-I abundance in the mitochondria / mitochondria–ER junctions fraction normalized to Cox iv (n = 3 donors). (C) Left, representative mitochondrial perturbation assay of human EM CD8+ T cells activated as in Figure 1A in presence of DMSO, or activated in the presence of clotrimazole for 12 h (25 μM). Right, summary bar graphs of basal respiration and glycolysis (n = 4 donors). (D) Left, representative mitochondrial perturbation assay using Jurkat T cells treated with DMSO or clotrimazole (25 μM) for 12 h. Right, summary bar graphs of basal respiration and glycolysis (n = 3 independent experiments). (E) Left, representative mitochondrial perturbation assay of human EM CD8+ T cells activated as in Figure 1A in presence of dNP2 peptide (5 µM), or activated in the presence of dNP2-VDAC peptide for 12 h (5 μM). Right, summary bar graphs of basal respiration and glycolysis (n = 3 donors). (F) Left, representative mitochondrial perturbation assay using Jurkat T cells treated with dNP2 peptide (5 µM) or dNP2-VDAC peptide (5 μM) for 12 h. Right, summary bar graphs of basal respiration and glycolysis (n = 3 independent experiments). (G) Oxygen consumption rates of permeabilized Jurkat T cells treated as in (D). Cells were permeabilized and respiration was assessed after addition of pyruvate, malate, and ADP (indicated as 'compounds' on the graph) (representative of n = 2 independent experiments). (H) Oxygen consumption of permeabilized human EM CD8+ T cells activated as in Figure 1A for 12 h. Cells were then permeabilized and treated with malate, pyruvate, oligomycin, and DMSO/clotrimazole (25 μM), and changes in OCR were assessed relative to pre-injection rates (representative of n = 2 donors). Data are presented as mean±SEM. Two-tailed paired Student’s t test (B,C,D,E,F) were used to compare groups. * P < 0.05, ** P < 0.01, ns = not significant. See also Figure S4.
Figure 5
Figure 5. Glucose is metabolized in the mitochondria of nascent activated EM CD8+ T cells
(A) Glucose-derived carbon labeling of glycolysis and tricarboxylic acid (TCA) cycle metabolites. EM CD8+ T cells were cultured under basal and activating (α-CD3/α-CD28 mAb loaded beads) conditions for 6 h in 13C-glucose containing media. Bar graphs display mass isotopologue distribution of incorporated 13C. M+0 bars represent fractions of metabolites with no 13C-glucose incorporation (n = 4-5 donors). (B) Glycolysis and TCA cycle metabolites in NV and EM CD8+ T cells stimulated with α-CD3/α-CD28 mAb loaded beads. Metabolites from EM CD8+ T cells (±activation) treated with Akti (10 μM) were further assessed. Box and whisker graphs reflect abundance of glucose-6-phosphate (G6P), fructose-1,6-bisphosphate (F1,6P), 3-phosphoglycerate (3PG), phosphoenolpyruvate (PEP), lactate, citrate, fumarate and malate in all samples tested (n = 5 donors). Data are represented as mean±SEM (A) and median±min/max (B). Two-tailed paired Student’s t test (A), and Anova contrasts (B), were used to compare groups. * P < 0.05, ** P < 0.01, *** P < 0.001. See also Figure S5.
Figure 6
Figure 6. Intact mitochondria–ER contacts and ETC function, but not mitochondrial ATP production, are required to support the early response of memory CD8+ T cells
(A) IFN-γ production by EM CD8+ T cells 12 h post-stimulation. The bar graph displays fold change in IFN-γ production relative to activation with α-CD3/α-CD28 mAb loaded beads alone, or in cells co-treated with 2-DG (1 mM) or 2-DG + MePyr (2 or 10 mM) (n = 3 donors). (B-E) IFN-γ production by EM CD8+ T cells following activation with α-CD3/α-CD28 mAb loaded beads for 12 h or activation in the presence of CPI-613 (PDH inhibitor, 200 μM) (B), (n = 6 donors); oxamate (Oxa, lactate dehydrogenase inhibitor, 5mM) (C), (n = 5 donors); nocodazole (noc) (10 μM) (D), (n = 9 donors); left, clotrimazole (clot) (25 μM), right, bifonazole (bif) (25 µM) (E), (clot, n = 6 donors; bif, n = 4 donors). (F) IFN-γ production by human EM CD8+ T cells activated as in (B). Cells were treated with Akti (10 μM) alone, or in combination with TCS-2002 (Gsk-3β inhibitor, 10 μM), (n = 9 donors). (G) Schematic representation of mitochondrial electron transport chain (ETC) complexes along with their respective inhibitors. (H) IFN-γ production by EM CD8+ T cells activated with α-CD3/α-CD28 mAb loaded beads for 12 h ± ETC inhibitors (n = 7-9 donors). (I) ATP measurement in EM CD8+ T cells with no stimulation or activated with α-CD3/α-CD28 mAb loaded beads ± FCCP (5 μM) or oligomycin (Oligo, 0.1 μM) for 12 h, (n = 5 donors). (J) IFN-γ production by EM CD8+ T cells activated as in (B) in the presence of the uncoupling agent FCCP (5 μM) ± UK5099 (10 µM) (n = 5-7 donors). (K) IFN-γ production by EM CD8+ T cells activated as in (B) in the presence of the ACLY inhibitor SB-204990 (3 µM) (n = 5 donors). Data are presented as mean±SEM. Two-tailed paired Student’s t tests were used throughout to compare groups. * P < 0.05, ** P < 0.01, *** P < 0.001, ns = not significant. See also Figure S6.
Figure 7
Figure 7. Rictor deficiency attenuates memory recall response, in vivo
(A) Frequency of IFN-γ producing cells from in vitro derived wt and rictor KO memory OT-I cells re-stimulated for 4 h with OVA, R7, or G4 peptide (n = 4-5 independent experiments). (B) Schematic diagram of adoptive transfer and infection strategy. (C) Serum IFN-γ and TNF levels 4 h after infection of mice with LmOVA. (n = 4-5 independent experiments). (D) Listeria monocytogenes CFU in spleen and liver at 24 h post-infection (n = 8-10 independent experiments). Each dot represents data obtained from cells isolated from one mouse, bars indicate mean±SEM. Two-tailed paired Student’s t test were used to compare groups. * P < 0.05, ** P < 0.01, ns = not significant. See also Figure S7.

Comment in

References

    1. Arbore G, West EE, Spolski R, Robertson AA, Klos A, Rheinheimer C, Dutow P, Woodruff TM, Yu ZX, O'Neill LA, et al. T helper 1 immunity requires complement-driven NLRP3 inflammasome activity in CD4(+) T cells. Science. 2016;352 aad1210. - PMC - PubMed
    1. Arzoine L, Zilberberg N, Ben-Romano R, Shoshan-Barmatz V. Voltage-dependent anion channel 1-based peptides interact with hexokinase to prevent its anti-apoptotic activity. The Journal of biological chemistry. 2009;284:3946–3955. - PubMed
    1. Bagchi S, Fredriksson R, Wallen-Mackenzie A. In Situ Proximity Ligation Assay (PLA) Methods Mol Biol. 2015;1318:149–159. - PubMed
    1. Balmer ML, Hess C. Feeling Worn Out? PGC1alpha to the Rescue for Dysfunctional Mitochondria in T Cell Exhaustion. Immunity. 2016;45:233–235. - PubMed
    1. Balmer ML, Ma EH, Bantug GR, Grahlert J, Pfister S, Glatter T, Jauch A, Dimeloe S, Slack E, Dehio P, et al. Memory CD8(+) T Cells Require Increased Concentrations of Acetate Induced by Stress for Optimal Function. Immunity. 2016;44:1312–1324. - PubMed

Publication types

MeSH terms

Substances