. 2018 May 11;122(10):1369-1384.
doi: 10.1161/CIRCRESAHA.117.312333. Epub 2018 Mar 9.

Lysosomal Cholesterol Hydrolysis Couples Efferocytosis to Anti-Inflammatory Oxysterol Production

Affiliations

Lysosomal Cholesterol Hydrolysis Couples Efferocytosis to Anti-Inflammatory Oxysterol Production

Manon Viaud et al. Circ Res. .

Abstract

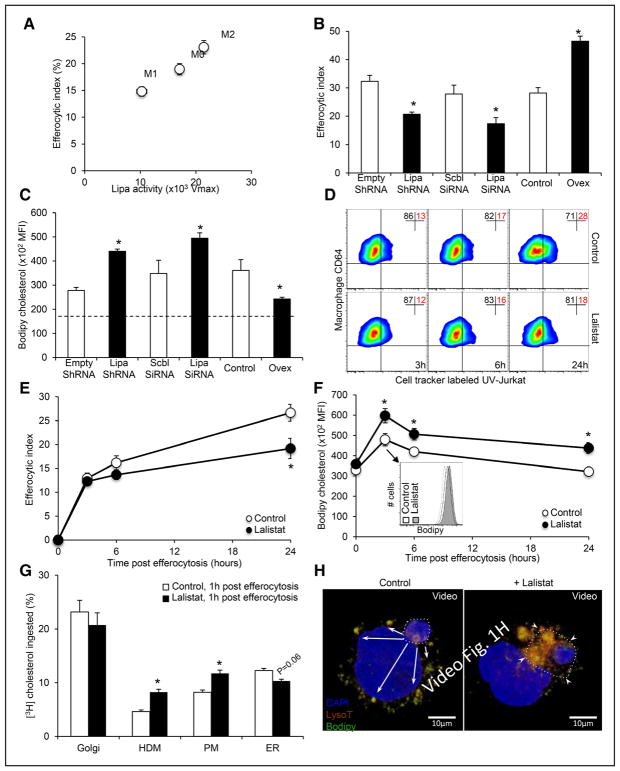
Rationale: Macrophages face a substantial amount of cholesterol after the ingestion of apoptotic cells, and the LIPA (lysosomal acid lipase) has a major role in hydrolyzing cholesteryl esters in the endocytic compartment.

Objective: Here, we directly investigated the role of LIPA-mediated clearance of apoptotic cells both in vitro and in vivo.

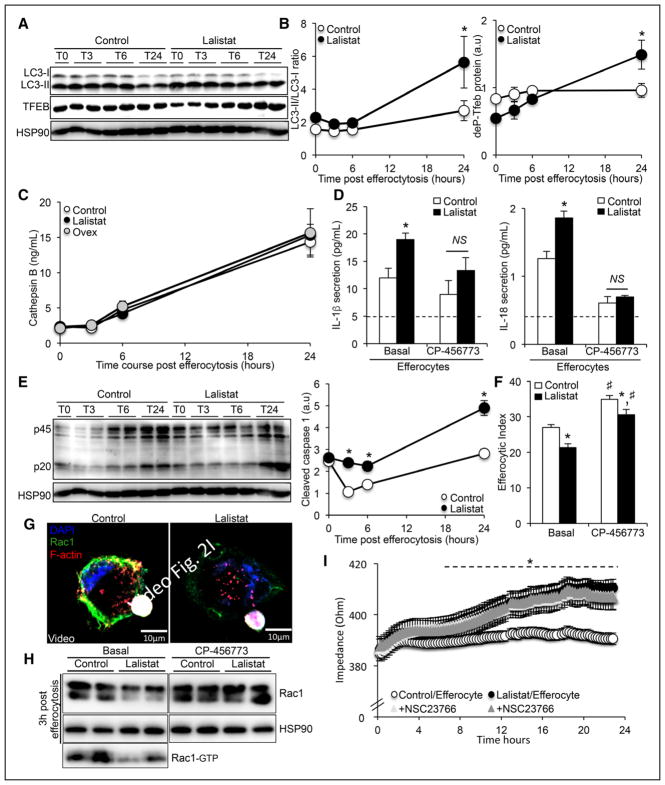
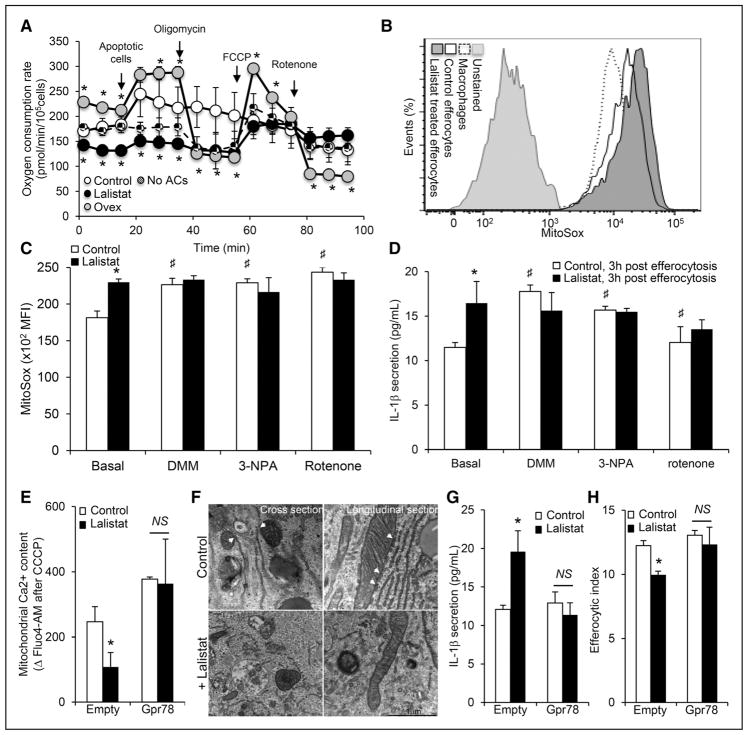
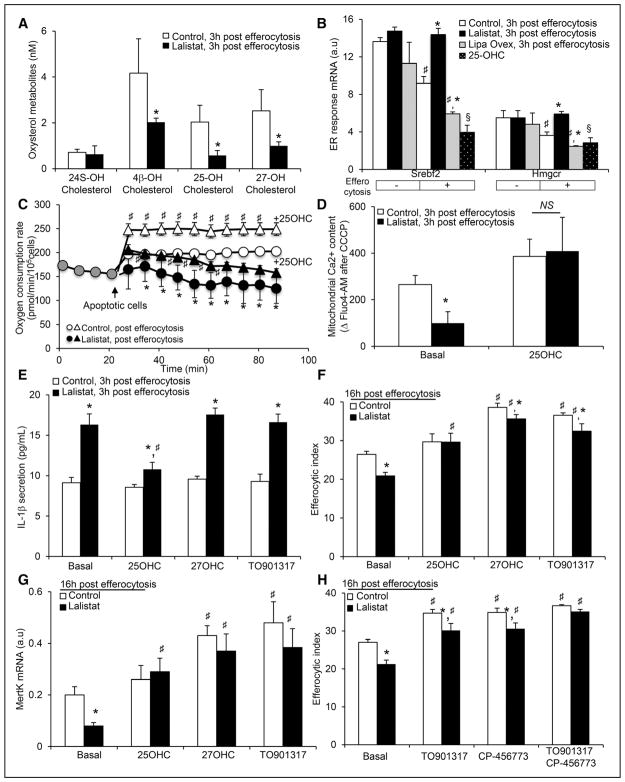
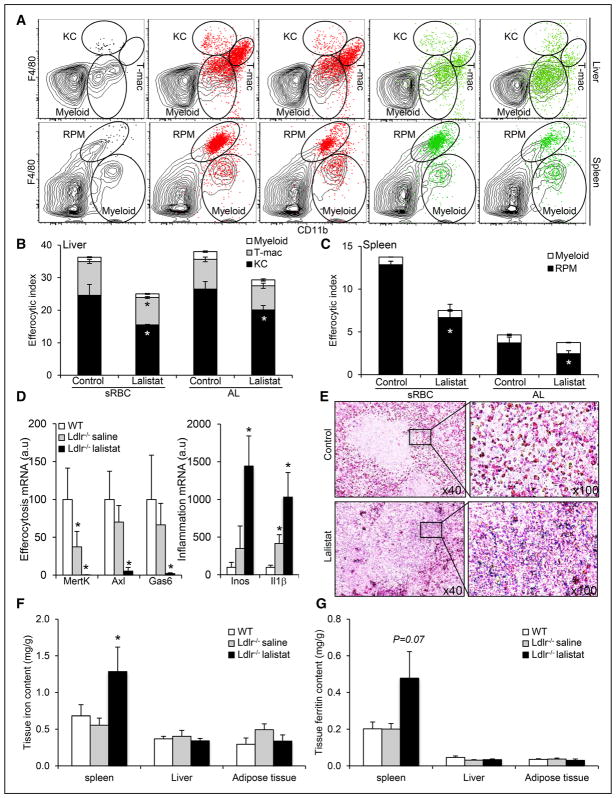
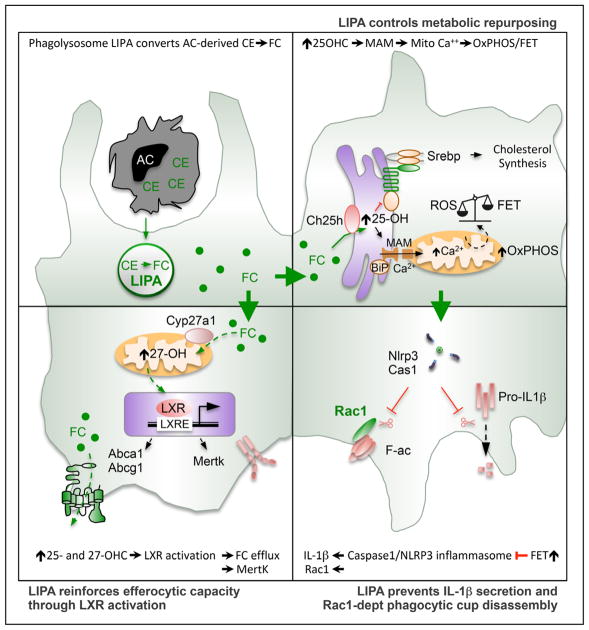
Methods and results: We show that LIPA inhibition causes a defective efferocytic response because of impaired generation of 25-hydroxycholesterol and 27-hydroxycholesterol. Reduced synthesis of 25-hydroxycholesterol after LIPA inhibition contributed to defective mitochondria-associated membrane leading to mitochondrial oxidative stress-induced NLRP3 (NOD-like receptor family, pyrin domain containing) inflammasome activation and caspase-1-dependent Rac1 (Ras-related C3 botulinum toxin substrate 1) degradation. A secondary event consisting of failure to appropriately activate liver X receptor-mediated pathways led to mitigation of cholesterol efflux and apoptotic cell clearance. In mice, LIPA inhibition caused defective clearance of apoptotic lymphocytes and stressed erythrocytes by hepatic and splenic macrophages, culminating in splenomegaly and splenic iron accumulation under hypercholesterolemia.

Conclusions: Our findings position lysosomal cholesterol hydrolysis as a critical process that prevents metabolic inflammation by enabling efficient macrophage apoptotic cell clearance.

Keywords: cholesterol; inflammation; macrophage; mitochondria; oxysterols.


Figures

Figure 1
Figure 1. LIPA (lysosomal acid lipase) expression controls efferocytic capacity and lysosomal cholesterol trafficking
A, Correlations between LIPA activity and the efferocytic index in human THP-1 macrophages exposed for 16 hours to medium alone (M0), 50 ng/mL lipopolysaccharide (LPS; M1) or 15 ng/mL IL (interleukin)-4 (M2). B, THP-1 macrophages were transduced with empty or LIPA ShRNA lentiviral particles or transfected with scrambled (Scbl) or LIPA SiRNA before incubation with CellTracker Deep Red-prelabeled apoptotic Jurkat cells (ultra-violet or UV-Jurkat) and quantification of the efferocytic index by flow cytometry. LIPA-overexpressing cells (Ovex) were also used in this assay. C, BODIPY (bore-dipyrromethene) staining was quantified by flow cytometry in THP-1 macrophages after modulation of LIPA expression (as described above) and exposure for 30 minutes to apoptotic Jurkat cells. Data are expressed as the mean fluorescence intensity (MFI). The dotted line represents the BODIPY-neutral lipid content into nonefferocytic control cells. D, E, THP-1 macrophages (CD64+) were incubated for the indicated times in the presence or absence of 10 μmol/L lalistat together with CellTracker Deep Red-prelabeled apoptotic Jurkat cells, and the efferocytic index was quantified by flow cytometry. F, THP-1 macrophages incubated in the presence or absence of 10 μmol/L lalistat were stimulated with apoptotic Jurkat cells for the indicated times. BODIPY staining was quantified by flow cytometry. Inset depicts a representative histogram at the indicated time point. G, Control or lalistat-treated THP-1 efferocytes, cultured for 1 hour after the ingestion of [3H]-cholesterol–prelabeled apoptotic Jurkat cells, were fractionated by sucrose step gradient, and fractions were assayed for [3H]-cholesterol incorporation as described in the Methods section. H, Representative 3-dimensional reconstruction from confocal Z-stack images of an ingested apoptotic cell prelabeled with BODIPY (green) and localized within a phagolysosome (stained with LysoTracker Deep Red). Cells were counterstained with DAPI (nuclear staining). Arrows indicate BODIPY clusters in phagocytic cells (8–10 different confocal images were analyzed per condition from experiments performed in triplicate). The data are given as the mean±SEM of at least 2 experiments performed in triplicate. *P<0.05 vs controls. ER indicates endoplasmic reticulum.
Figure 2
Figure 2. Defective lysosomal cholesterol hydrolysis promotes lysosomal damage–independent inflammasome activation after efferocytosis causing subsequent Rac1 (Ras-related C3 botulinum toxin substrate 1)-dependent phagocytic cup defects
A, Representative immunoblots of LC3I/II and phospho-Tfeb (transcription factor E-box) from control or lalistat-treated THP-1 macrophages incubated for 30 minutes with apoptotic Jurkat cells and cultured for various times. B, Kinetics of band densities normalized to HSP90 (heat shock protein 90) are shown for the indicated times. C, Cathepsin B secretion levels from control or lalistat-treated THP-1 efferocytes cultured for the indicated times after the ingestion of apoptotic cells and expressed in ng/mL. D, IL (interleukin)-1β and IL-18 secretion levels (expressed in pg/mL) from control or lalistat-treated THP-1 efferocytes cultured for 3 hours after the ingestion of apoptotic cells in the presence or absence of 25 nmol/L Nlrp3 (NOD-like receptor family, pyrin domain containing) inflammasome inhibitor (CP456773). The dotted lines represent IL-1β and IL-18 secretion levels into nonefferocytic control cells. E, Immunoblot of caspase-1 from control or lalistat-treated THP-1 macrophages incubated for 30 minutes with apoptotic Jurkat cells and cultured for various times and quantification of cleaved caspase-1. F, Control and lalistat-treated THP-1 macrophages were incubated in the presence or absence of 25 nmol/L Nlrp3 inflammasome inhibitor (CP456773) together with CellTracker Red-prelabeled apoptotic Jurkat cells, and the efferocytic index was quantified by flow cytometry 16 hours later. G, THP-1 macrophages incubated in the presence or absence of 10 μmol/L lalistat were stimulated with CellTracker Deep Red-prelabeled apoptotic Jurkat cells for 30 minutes. After an additional culture period, the cells were counterstained with Rac1 (green), F-actin (red), and DAPI (nuclear staining); a 3-dimensional reconstruction from confocal Z-stack images is provided. H, Immunoblots of Rac1 from control or lalistat-treated THP-1 macrophages cultured for 3 hours after the ingestion of apoptotic Jurkat cells in presence or absence of 25 nmol/L of the Nlrp3 inflammasome inhibitor (CP-456773). Rac1-GTP is for Rac1 bind to GTP, the active form of Rac1. I, Real-time evaluation of macrophage protrusion dynamics by impedance reading of control or lalistat-treated THP-1 efferocytes in presence or absence of the Rac1 inhibitor, NSC23766. The data are given as the mean±SEM of 2 to 5 independent experiments performed in triplicate. *P<0.05 vs controls. #P<0.05 treatment effect. a.u. indicates arbitrary units.
Figure 3
Figure 3. Defective lysosomal cholesterol hydrolysis restrains mitochondria-associated membrane (MAM)–dependent mitochondrial metabolic repurposing after efferocytosis to activate the inflammasome and subsequent efferocytic defects
A, Oxygen consumption rate (OCR) recordings of control, lalistat-treated, or LIPA (lysosomal acid lipase)-overexpressing (Ovex) THP-1 macrophages under the indicated conditions. B, Representative histograms and (C) quantification of mitochondrial reactive oxygen species (ROS) generation using the MitoSox probe by flow cytometry in control and lalistat-treated THP-1 efferocytes cultured for 3 hours after ingestion of apoptotic cells in the presence or absence of 10 mmol/L of the succinate oxidation inhibitor (dimethyl malonate [DMM]) or 1 μmol/L of the succinate dehydrogenase inhibitor (3-nitropropionic acid [3-NPA]) or 1 μmol/L of rotenone. Data are expressed as mean fluorescence intensity (MFI). D, IL (interleukin)-1β secretion levels in these cells at the end of the incubation period. E, THP-1 macrophages were transduced with empty or GPR78 overexpressing adenoviral particles and loaded for 30 minutes with the fluorescent calcium probe Fluo4-AM (acetoxymethyl) before the start of the efferocytosis experiment. Control and lalistat-treated THP-1 macrophages were then incubated for 30 minutes with apoptotic Jurkat cells before treatment with carbonyl cyanide 3-chlorophenylhydrazone (CCCP) to release mitochondrial calcium. Mitochondrial calcium content was calculated as the difference in mean fluorescence intensity between conditions treated with or without CCCP. F, Representative transmission electron microscopy images of control or lalistat-treated THP-1 efferocytes showing endoplasmic reticulum (ER)–mitochondria contacts (scale bar, 1 μm). G, IL-1β secretion levels (H) and efferocytic index from control and GPR78 overexpressing THP-1 macrophages incubated in the presence or absence of 10 μmol/L lalistat and cultured for 3 hours after the ingestion of apoptotic Jurkat cells. The results are expressed as the mean±SEM of at least 2 independent experiments performed in triplicate. *P<0.05 vs controls. #P<0.05 treatment effect. AC indicates apoptotic cell.
Figure 4
Figure 4. Lysosomal cholesterol hydrolysis governs the efferocytic response by controlling oxysterol production
A, Oxysterol metabolites (24S-, 4β-, 25- and 27-hydroxy(OH)cholesterol) were determined by liquid chromatography-mass spectrometry (LC-MS). B, Effects of LIPA (lysosomal acid lipase) inhibition, LIPA overexpression, and 25-OHC treatment (5 μmol/L) on Srebf2 and Hmgcr mRNA expression in THP-1 macrophages 3 hours post-efferocytosis. Quantified transcript levels (normalized to m36B4) are expressed in arbitrary units (a.u.). C, Oxygen consumption rate (OCR) recordings of control and lalistat-treated THP-1 efferocytes in the presence or absence of 5 μmol/L 25-OHC. D, Control and lalistat-treated THP-1 macrophages, preloaded for 30 minutes with the fluorescent calcium probe Fluo4-AM (acetoxymethyl), were incubated for 30 minutes with apoptotic Jurkat cells in presence or absence of 5 μmol/L 25-OHC. Release of mitochondrial calcium was achieved at the end of the experiment by treating cells with carbonyl cyanide 3-chlorophenylhydrazone (CCCP). Mitochondrial calcium content was calculated as the difference in mean fluorescence intensity between conditions treated with or without CCCP. E, IL-1β secretion levels from control or lalistat-treated THP-1 efferocytes cultured for 3 hours after the ingestion of apoptotic cells in the presence or absence of 5 μmol/L 25-OHC, 5 μmol/L 27-OHC or 3 μmol/L LXR agonist (TO901317). F, Control and lalistat-treated THP-1 macrophages were incubated under the same conditions as described above, and the efferocytic index was quantified by flow cytometry 16 hours later. G, MertK transcript levels (normalized to m36B4) were determined under the same conditions as described in F and expressed in a.u. H, Control and lalistat-treated THP-1 macrophages were incubated in the presence or absence of 3 μmol/L liver X receptor (LXR) agonist (TO901317) and 25 nmol/L Nlrp3 (NOD-like receptor family, pyrin domain containing) inflammasome inhibitor (CP-456773) together with CellTracker Red-prelabeled apoptotic Jurkat cells and the efferocytic index was quantified by flow cytometry 16 hours later. The results are expressed as the mean±SEM of 2 to 5 independent experiments. *P<0.05 vs controls. #P<0.05 treatment effect.
Figure 5
Figure 5. Inhibition of lysosomal lipid hydrolysis promotes defective efferocytosis in vivo leading to pathogenic inflammation and splenic iron deposition under hypercholesterolemia
A, Representative dot plots of gating for F4/80highCD11bint KCs, F4/80lowCD11bhigh myeloid cells, and F4/80highCD11bhigh tMΦ in the liver (top) and F4/80highCD11bint RPMs and F4/80lowCD11bhigh myeloid cells in the spleen (bottom) 16 hours after intravenous injection of CellTracker+ stressed erythrocytes (stressed red blood cells [sRBCs], red) or apoptotic lymphocytes (ALs; UV-T, green). Black dot plots represent cells gated on CD45+ leukocytes in the liver and spleen, and the red or green dot plot overlays show CellTracker+ cells. Quantification of (B, C) the efferocytic index of each cell type in the liver (myeloid, transient macrophage population [T-mac], and ketocholesterol [KC]) or the spleen (myeloid and RPM). D, mRNA expression of efferocytic and inflammatory markers in 12-week high-fat-fed wild-type (WT) or Ldlr−/− mice treated for the past 2 weeks with subcutaneous injections of either saline or 20 mg/kg lalistat every 2 days. E, Perl’s Prussian stain for ferric iron in the spleens of these mice (original magnification, 40× and 100×). F, Iron levels and (G) ferritin levels in spleen, liver, and adipose tissue of WT or saline and lalistat-treated Ldlr−/− mice on a high-fat diet. The data are expressed as the mean±SEM of 4 to 6 animals per group. *P<0.05 vs saline-injected control or Ldlr−/− mice.
Figure 6
Figure 6
Graphical abstract.

References

    1. Wynn TA, Chawla A, Pollard JW. Macrophage biology in development, homeostasis and disease. Nature. 2013;496:445–455. doi: 10.1038/nature12034. - DOI - PMC - PubMed
    1. Tall AR, Yvan-Charvet L. Cholesterol, inflammation and innate immunity. Nat Rev Immunol. 2015;15:104–116. doi: 10.1038/nri3793. - DOI - PMC - PubMed
    1. Han CZ, Ravichandran KS. Metabolic connections during apoptotic cell engulfment. Cell. 2011;147:1442–1445. doi: 10.1016/j.cell.2011.12.006. - DOI - PMC - PubMed
    1. Nagata S, Hanayama R, Kawane K. Autoimmunity and the clearance of dead cells. Cell. 2010;140:619–630. doi: 10.1016/j.cell.2010.02.014. - DOI - PubMed
    1. Maxfield FR, Tabas I. Role of cholesterol and lipid organization in disease. Nature. 2005;438:612–621. doi: 10.1038/nature04399. - DOI - PubMed

Publication types

MeSH terms