

Dual inhibition of AKT-mTOR and AR signaling by targeting HDAC3 in PTEN- or SPOP-mutated prostate cancer
- PMID: 29523594
- PMCID: PMC5887910
- DOI: 10.15252/emmm.201708478
Dual inhibition of AKT-mTOR and AR signaling by targeting HDAC3 in PTEN- or SPOP-mutated prostate cancer
Abstract
AKT-mTOR and androgen receptor (AR) signaling pathways are aberrantly activated in prostate cancer due to frequent PTEN deletions or SPOP mutations. A clinical barrier is that targeting one of them often activates the other. Here, we demonstrate that HDAC3 augments AKT phosphorylation in prostate cancer cells and its overexpression correlates with AKT phosphorylation in patient samples. HDAC3 facilitates lysine-63-chain polyubiquitination and phosphorylation of AKT, and this effect is mediated by AKT deacetylation at lysine 14 and 20 residues and HDAC3 interaction with the scaffold protein APPL1. Conditional homozygous deletion of Hdac3 suppresses prostate tumorigenesis and progression by concomitant blockade of AKT and AR signaling in the Pten knockout mouse model. Pharmacological inhibition of HDAC3 using a selective HDAC3 inhibitor RGFP966 inhibits growth of both PTEN-deficient and SPOP-mutated prostate cancer cells in culture, patient-derived organoids and xenografts in mice. Our study identifies HDAC3 as a common upstream activator of AKT and AR signaling and reveals that dual inhibition of AKT and AR pathways is achievable by single-agent targeting of HDAC3 in prostate cancer.
Keywords: AKT phosphorylation; HDAC3; RGFP966; androgen receptor; prostate cancer.
© 2018 The Authors. Published under the terms of the CC BY 4.0 license.
Figures
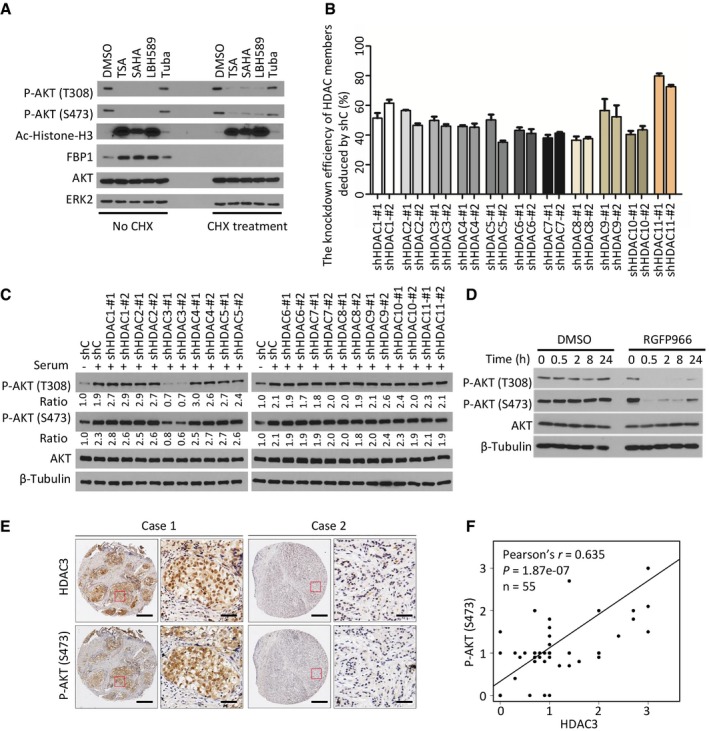
HDACIs inhibited AKT phosphorylation. C4‐2 cells were pre‐treated with 20 μM of CHX for 30 min followed by treatment with pan HDACIs TSA (1 μM), SAHA (5 μM), LBH589 (0.1 μM), or a HDAC6 selective inhibitor Tuba (5 μM) for 24 h prior to Western blot analysis with indicated antibodies. The efficacy of CHX was evident by blockade of induction of FBP1 expression by HDACIs as reported (Yang et al, 2017).
The knockdown efficiency of each member of class I/II HDACs by shRNAs. C4‐2 cells were stably infected with control or gene‐specific shRNAs for 4 days and harvested for RT–qPCR. Expression of each gene was first normalized to the level of GAPDH, and then the expression level of each gene in gene knockdown cells was normalized by that in control knockdown cells. The shRNA knockdown efficiency was determined by subtracting the normalized value from 100%. Data represents means ± SEM. The RT–qPCR was performed in triplicate for each sample.
Control or gene‐specific knockdown C4‐2 cells were serum starved for 24 h and then cultured in regular culture medium for 12 h followed by Western blots for indicated proteins. Western blot bands for total and phosphorylated AKT were quantified and normalized to the quantified values of β‐Tubulin (loading control). The normalized values were further normalized to the value of shC‐infected cells without serum stimulation.
C4‐2 cells were treated with vehicle (DMSO) or HDAC3 inhibitor RGFP966, and at different time points, cells were harvested for Western blots with the indicated antibodies.
The representatives of IHC staining for HDAC3 and AKT S473 phosphorylation in prostate cancer patient specimens; scale bar: 50 μm; scale bar for the inset: 20 μm.
Correlation between expression of AKT S473 phosphorylation and HDAC3 was shown, n = 55, ***P = 1.87e‐07 was performed by Pearson's product‐moment correlation test.
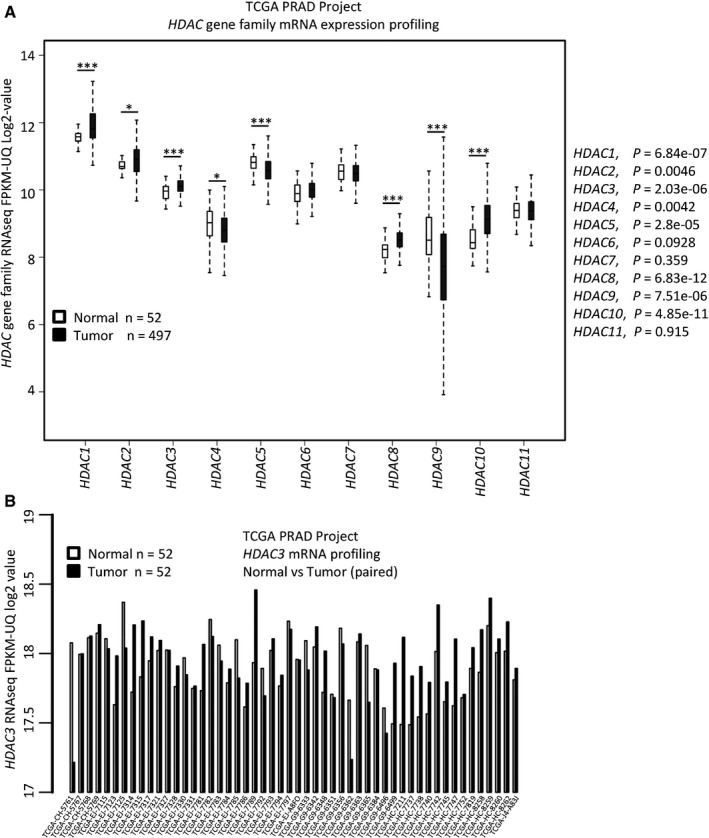
The mRNA level of 11 HDAC gene family members was compared between normal and tumor tissues (the mRNA expression data were extracted from the TCGA project). P‐values were performed between normal tissues (n = 52) with tumor tissues (n = 497) for each gene by Wilcoxon rank sum test with continuity correction and shown alongside the graph. The description for box plot is the same as the figure legend in Fig 7H.
The mRNA level of HDAC3 gene was compared between paired normal and cancer tissues for individual patient. Normal/tumor paired samples were available only in 52 patients in the TCGA cohort.
- A
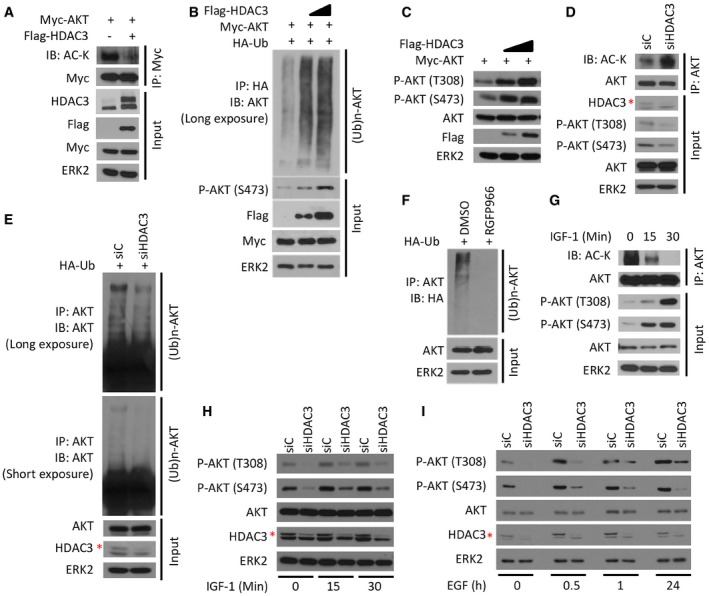
293T cells were transfected with plasmids for Flag‐HDAC3 and Myc‐AKT followed by IP and Western blots with the indicated antibodies.
- B
C4‐2 cells were transfected with plasmids for Myc‐AKT, HA‐Ub, and Flag‐HDAC3 (different doses) for 24 h followed by IP and Western blots with the indicated antibodies.
- C
C4‐2 cells were transfected with plasmids for Myc‐AKT and Flag‐HDAC3 (different doses) for 24 h followed by Western blots with the indicated antibodies.
- D, E
C4‐2 cells were transfected with a pool of control or HDAC3‐specific siRNAs for 48 h followed by IP and/or Western blots with the indicated antibodies.
- F
C4‐2 cells were transfected with HA‐Ub plasmids and treated with 3 μM of RGFP966 for 24 h followed by IP and/or Western blots with the indicated antibodies.
- G
C4‐2 cells were treated with 10 ng/ml of IGF‐1 for different periods of time and harvested for IP and Western blots with the indicated antibodies.
- H, I
C4‐2 cells were transfected with a pool of control and HDAC3‐specific siRNAs for 48 h and then treated with IGF‐1 (H) or EGF (I) followed by Western blots for indicated proteins.
- A, B
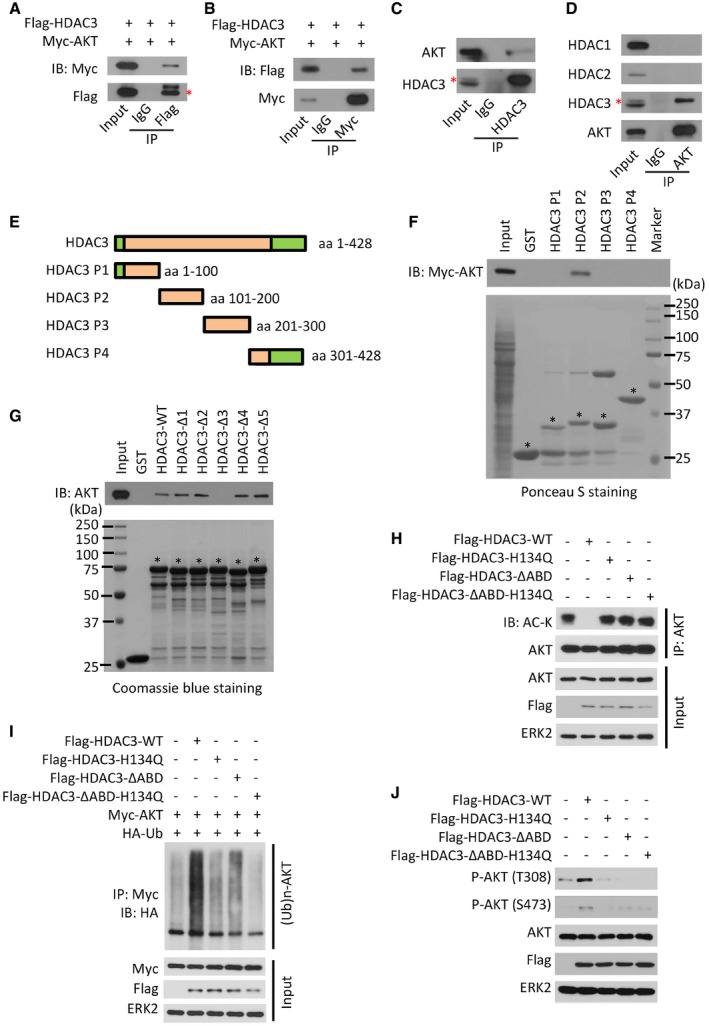
293T cells were transfected with indicated plasmids for 24 h followed by IP and Western blots with the indicated antibodies. The asterisk (*) indicates the specific Flag‐HDAC3 protein band.
- C, D
C4‐2 cell lysate was prepared for IP and Western blots with the indicated antibodies. The asterisk (*) indicates the specific Flag‐HDAC3 protein band.
- E
An illustration depicts four fragments of HDAC3 protein for generation of GST recombinant proteins.
- F, G
C4‐2 cells were transfected with Myc‐tagged AKT for 24 h, and cell lysate was prepared for GST pull‐down assay. Input and GST or GST‐HDAC3 recombinant proteins used for pull‐down assay in (F) were examined by Ponceau S staining and pull‐down proteins were evaluated by Western blot with anti‐Myc antibody. GST or GST‐HDAC3 recombinant proteins used for pull‐down assay in (G) were examined by Coomassie blue staining. GST or GST‐HDAC3 recombinant proteins with expected molecular mass are indicated by asterisks.
- H–J
C4‐2 cells were transfected with indicated plasmids for 24 h followed by IP and Western blots with the indicated antibodies.
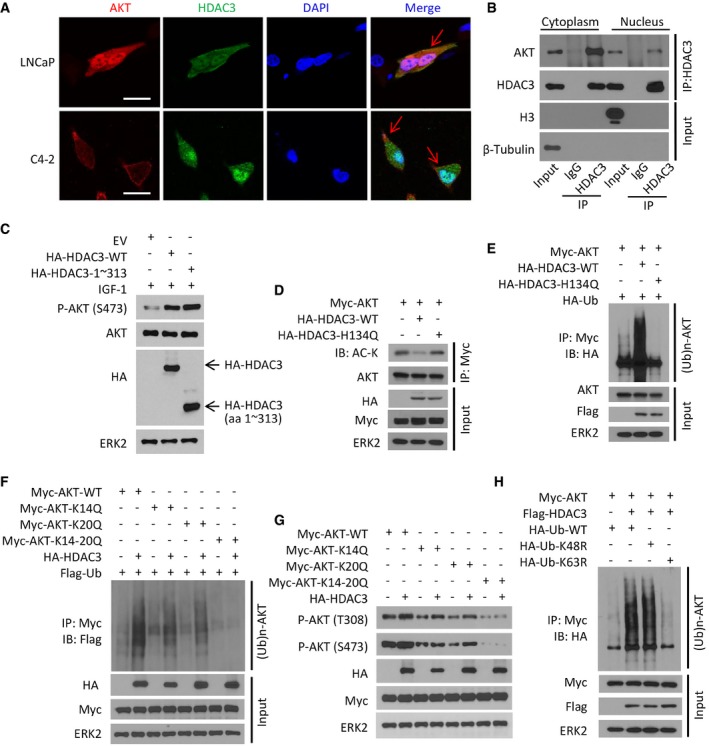
- A
LNCaP and C4‐2 cells grown in logarithmic phase were fixed and subjected to IFC. Cell nuclei were counterstained by DAPI. Arrows point to the co‐localization of AKT and HDAC3 proteins in the plasma membrane. Approximately 80% of LNCaP cells and 85% of C4‐2 cells showed the co‐localization of these two proteins on plasma membrane. Scale bars, 20 μm.
- B
C4‐2 cells were treated with IGF‐1 for 30 min and then harvested for cellular fractionation followed by IP and Western blots with the indicated antibodies.
- C
C4‐2 cells were transfected with empty vector (EV) or HA‐tagged wild‐type or mutant HDAC3 for 24 h followed by treatment of 10 ng/ml IGF‐1 for 30 min. Cells were harvested for Western blots with the indicated antibodies.
- D–H
C4‐2 cells were transfected with the indicated plasmids for 24 h and harvested for IP and Western blots with the indicated antibodies.

- A
LNCaP cells were treated with 10 ng of IGF‐1 for 30 m and harvested for immunofluorescent cytochemistry (IFC) with P‐AKT‐S473, E‐cadherin, and HDAC3. Cell nuclei were counterstained with DAPI in IFC. Scale bars, 50 μm.
- B
C4‐2 cells were transfected with the indicated plasmids, and then, cytoplasm membrane and nuclear proteins were isolated followed by IP and Western blots with the indicated antibodies.
- C
An illustration depicts functional domains of HDAC3 including the regions for nuclear export and localization sequences (modified from the following website:
http://atlasgeneticsoncology.org/Genes/GC_HDAC3.html ). - D, E
LNCaP cells were transfected with HA‐tagged wild‐type HDAC3 or truncated mutant (aa 1–313) for 24 h followed by IFC with anti‐HA antibody (D) or Western blots with indicated antibodies (E). Scale bars for images in (D), 50 μm.
- F
C4‐2 cells were transfected with a pool of siRNA of APLL1 and the indicated plasmids. The cells were harvested for IP and Western blots with the indicated antibodies.
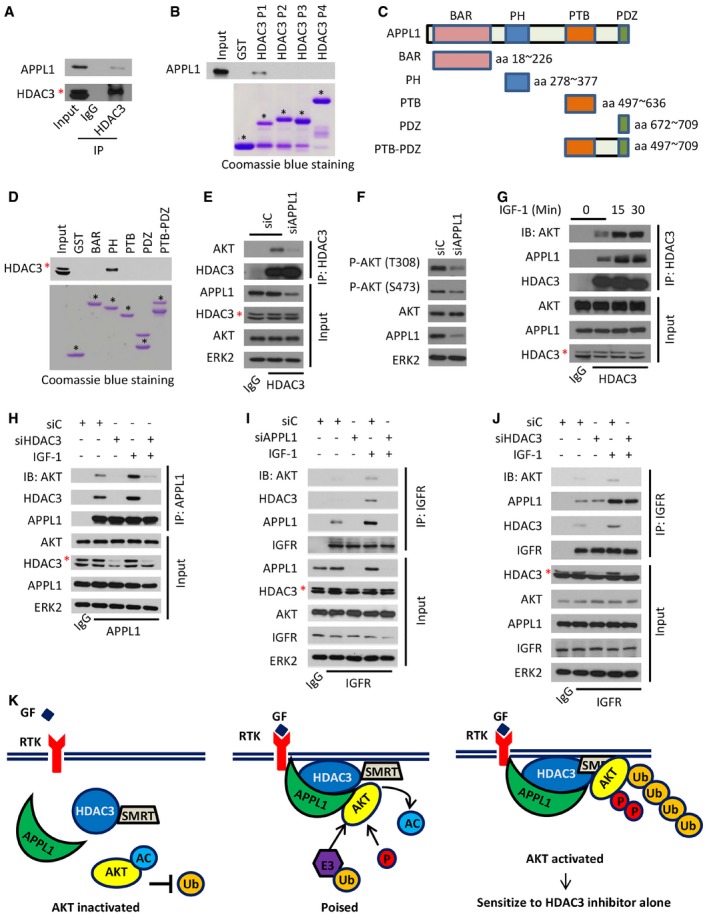
- A
C4‐2 cell lysate was prepared for IP and Western blots with the indicated antibodies. The asterisk (*) indicates the specific HDAC3 protein band.
- B
C4‐2 cell lysate was prepared for GST pull‐down assay using GST or GST‐HDAC3 recombinant proteins (stained with Coomassie blue, low panel) followed by Western blot with anti‐APPL1 antibody (upper panel). GST or GST‐HDAC3 recombinant proteins with expected molecular mass are indicated by asterisks.
- C
An illustration depicts four functional domains (BAR, PH, PTB, and PDZ) of APPL1 used for construction of GST‐APPL1 recombinant proteins.
- D
C4‐2 cell lysate was prepared for GST pull‐down assay using GST or GST‐APPL1 recombinant proteins (stained with Coomassie blue, low panel) followed by Western blot with anti‐HDAC3 antibody (upper panel). The red asterisk (*) indicates the specific HDAC3 protein band, while the black ones indicate the specific domains of APPL1.
- E, F
C4‐2 cells were transfected with a pool of control or APPL1‐specific siRNAs for 48 h followed by IP and Western blots with the indicated antibodies. The asterisk (*) indicates the specific HDAC3 protein band.
- G
C4‐2 cells were treated with 10 ng/ml of IGF‐1 for different periods of time followed by IP and Western blots with the indicated antibodies. The asterisk (*) indicates the specific HDAC3 protein band.
- H–J
C4‐2 cells were transfected with indicated siRNAs and treated with 10 ng/ml of IGF‐1 for 30 min and followed by IP and Western blots with the indicated antibodies. The asterisks (*) indicate the specific HDAC3 protein bands.
- K
A hypothetical model depicting roles of HDAC3 and APPL1 in growth factor (GF)‐induced AKT activation. In the absence of the interaction of GF with a receptor tyrosine kinase (RTK), HDAC3 and APPL1 drift around in the cytosol. As a result, AKT becomes highly acetylated and resistant to be polyubiquitinated. Upon GF stimulation, RTK recruits APPL1, which in turn functions as a scaffold facilitating HDAC3‐mediated deacetylation of AKT, thereby making AKT poised for further activation by polyubiquitination. Activation of this deacetylase‐dependent function of HDAC3 may also require the binding by the deacetylase activating domain of SMRT.
- A
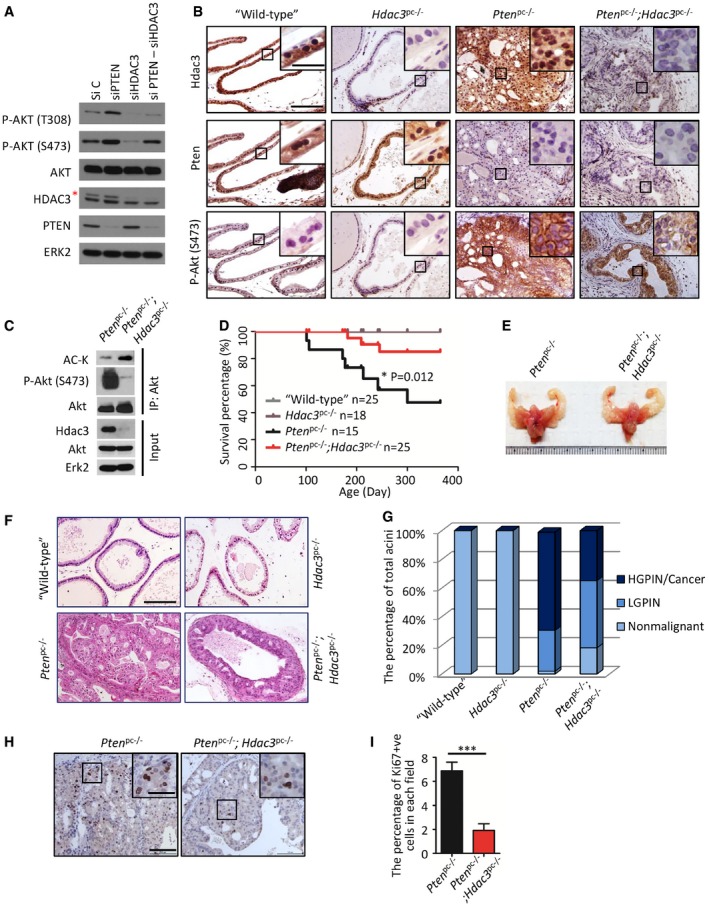
22Rv1 cells were transfected with a pool of control and gene‐specific siRNAs for 48 h followed by Western blots with the indicated antibodies. The asterisk (*) indicates the specific HDAC3 protein band.
- B
IHC for Hdac3 (i), Pten (ii) and phosphorylated Akt (p‐Akt‐S473) (iii) in prostate tissues of “wild‐type”, Hdac3 pc−/−, Pten pc−/−, and Pten pc−/−;Hdac3 pc−/− mice at age of 4 months. The inset is a high‐magnification image of the framed area in each panel. Scale bar: 50 μm; scale bar in the inset: 10 μm.
- C
Protein samples were prepared from prostate tissues of Pten pc−/− and Pten pc−/−;Hdac3 pc−/− mice at age of 4 months followed by IP and Western blots with the indicated antibodies.
- D
Kaplan–Meier survival analysis of “wild‐type” (n = 25), Hdac3 pc−/− (n = 18), Pten pc−/− (n = 15), Pten pc−/−;Hdac3 pc−/− (n = 25) mice. The “n” indicates the number of mice. *P = 0.012 comparing the overall survival of Pten pc−/−;Hdac3 pc−/− mice (n = 25) with “Pten pc−/−” mice (n = 15) by Gehan–Breslow–Wilcoxon test.
- E
Representatives of genitourinary tracts of Pten pc−/− and Pten pc−/−;Hdac3 pc−/− mice at age of 4 months.
- F
Representatives of H&E staining for ventral prostate (VP) of 4‐month‐old mice with indicated genotypes. Scale bar: 50 μm.
- G
Quantification of non‐malignant, low‐grade PIN (LGPIN), and high‐grade PIN (HGPIN)/cancer acini in the lobes of AP, VP, and DLP of the mice with the indicated genotypes (n = 6 mice for each group).
- H, I
Representatives of Ki67 staining in prostate tissues from Pten pc−/− and Pten pc−/−;Hdac3 pc−/− mice at age of 4 months are shown in (H) with the quantitative data in (I). Scale bar: 100 μm; scale bar in the inset: 10 μm. Data are shown as means ± SEM (n = 6 mice for each group); ***P = 1.64e‐04 was performed by the unpaired two‐tailed Student's t‐test.

- A
C4‐2 cells stably infected with lentivirus for control or HDAC3‐specific shRNAs were harvested for Western blots with the indicated antibodies.
- B
C4‐2 cells were infected with lentivirus as in (A) and subjected to cell growth analysis using a 2D cell culture system. The cell growth was measured in triplicate for each of three independent experiments. Data are shown as means ± SEM. shC versus shHDAC3‐#1: ***P = 6.0e‐04, shC versus shHDAC3‐#2: ***P = 6.5e‐04, shC versus shHDAC3‐#3: **P = 0.0012 comparing the cell growth at day 4 by the unpaired two‐tailed Student's t‐test.
- C
An illustration shows the workflow of a 3D Matrigel culture system.
- D, E
C4‐2 cells were infected with lentivirus as in (A) and subjected to cell growth analysis using a 3D cell culture system. The representative images from 3D cultures at day 5 are shown in (D) with quantitative data in a box plot (E). Scale bar, 100 μm. In graph (E), the description for box plot is the same as the figure legend in Fig 7H. Data are shown as means ± SEM. shC (n = 321) versus shHDAC3‐#1 (n = 397): ***P = 2.02e‐31, shC (n = 321) versus shHDAC3‐#2 (n = 402): ***P = 4.43e‐54, shC (n = 321) versus shHDAC3‐#3 (n = 334): ***P = 4.35e‐06 were performed by Wilcoxon rank sum test with continuity correction.
- F, G
C4‐2 cells in 3D cultures at day 5 were subjected for IFC analysis for expression of total and S473 phosphorylated AKT. The representative images of AKT phosphorylation (S473) are shown in (F) with quantitative data in (G). Scale bar for images in (F), 20 μm.
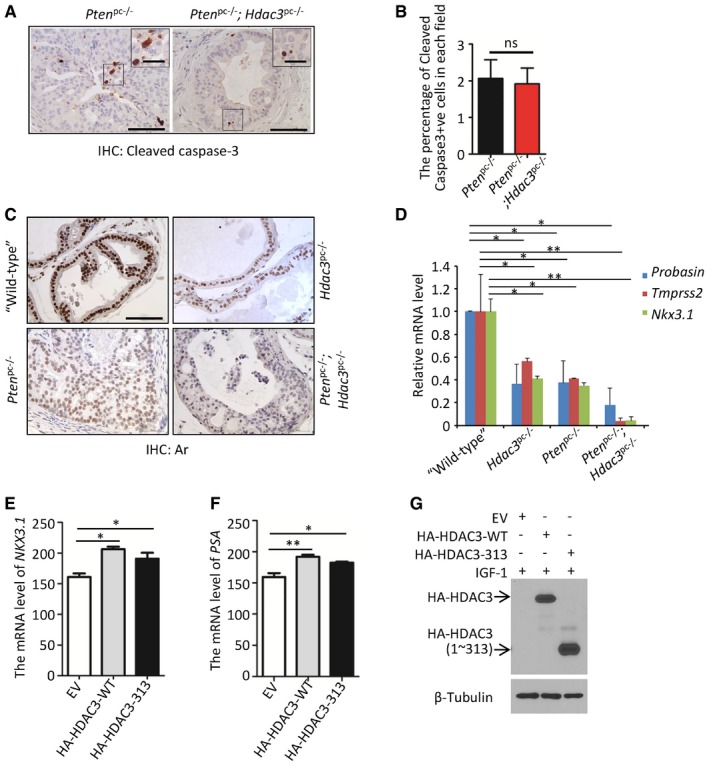
- A, B
Representatives of cleaved caspase‐3 staining in prostate tissues from Pten pc−/− and Pten pc−/−;Hdac3 pc−/− mice at age of 4 months are shown in (A) with the quantitative data in (B). Scale bar: 50 μm; scale bar in the inset: 10 μm. The “ns” stands for “no significant difference”. Data are shown as means ± SEM. Pten pc−/− (n = 6) versus Pten pc−/−;Hdac3 pc−/− (n = 6), P = 0.8339 was performed by the unpaired two‐tailed Student's t‐test.
- C
Ar protein expression was examined by IHC in prostate tissues of “wild‐type”, Hdac3 pc−/−, Pten pc−/− and Pten pc−/−;Hdac3 pc−/− mice at age of 4 months. Scale bar, 50 μm.
- D
RT–qPCR analysis of mRNA levels of Ar target genes (Probasin, Tmprss2, and Nkx3.1). Data shown as means ± SEM (n = 6 mice for each group). For Probasin, “wild‐type” versus Hdac3 pc−/−, *P = 0.034; “wild‐type” versus Pten pc−/−, *P = 0.043; and “wild‐type” versus Pten pc−/−;Hdac3 pc−/−, *P = 0.016. For Tmprss2, “wild‐type” versus Hdac3 pc−/−, *P = 0.018; “wild‐type” versus Pten pc−/−, *P = 0.022; and “wild‐type” versus Pten pc−/−;Hdac3 pc−/−, **P = 0.0027. For Nkx3.1, “wild‐type” versus Hdac3 pc−/−, *P = 0.018; “wild‐type” versus Pten pc−/−, *P = 0.015; and “wild‐type” versus Pten pc−/−;Hdac3 pc−/−, **P = 0.007. Statistical analysis was performed by the unpaired two‐tailed Student's t‐test.
- E–G
LNCaP cells were transfected the indicated plasmids and treated with 10 ng/ml of IGF‐1 for 0.5 h before harvesting. The mRNA expression of AR targets (NKX3.1 and PSA) normalized to GAPDH is shown in (E, F), and expression of transfected plasmids was examined by Western blots (G). The RT–qPCR was performed in triplicate for each sample. Data are shown as means ± SEM. For NKX3.1, EV versus HA‐HDAC3‐WT, *P = 0.013; EV versus HA‐HDAC3‐313, *P = 0.014. For PSA, EV versus HA‐HDAC3‐WT, **P = 0.009; EV versus HA‐HDAC3‐313, *P = 0.02. Statistical analysis was performed by the unpaired two‐tailed Student's t‐test.
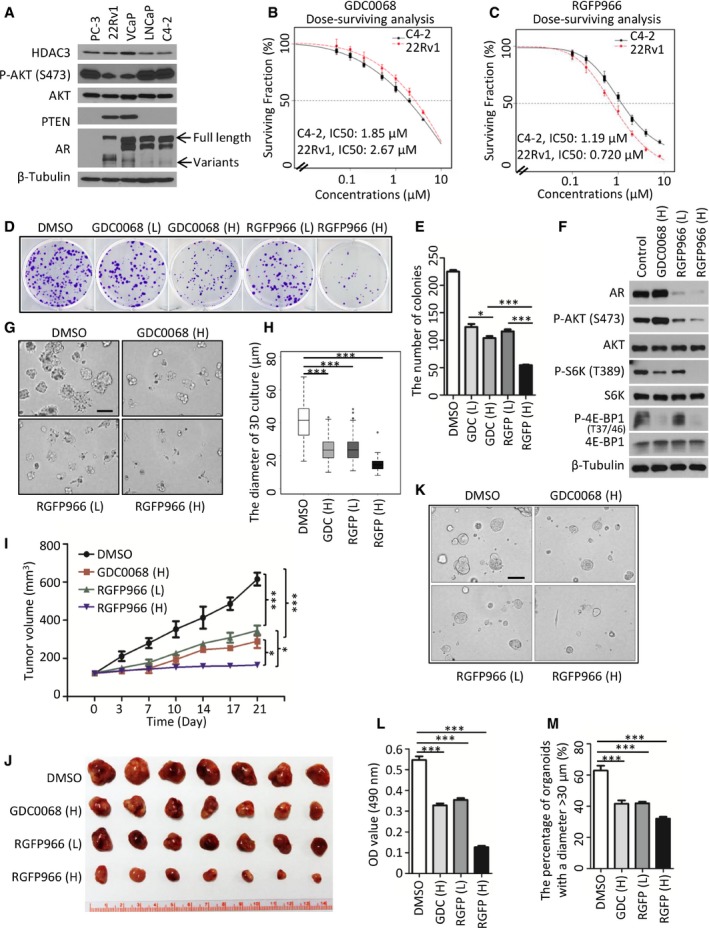
- A
Cell lysate was prepared from indicated prostate cancer cell lines for Western blot analysis. Arrows show the full length and variants of AR.
- B, C
C4‐2 and 22Rv1 cells were treated with GDC0068 (B) and RGFP966 (C). IC50 is shown as a dotted line in the middle of the graph; for C4‐2 cells, IC50 of GDC0068 = 1.85 μM; IC50 of RGFP966 = 1.19 μM; for 22Rv1 cells, IC50 of GDC0068 = 2.67 μM; IC50 of RGFP966 = 0.72 μM. The survival curve was generated from three independent experiments and each experiment was in triplicate. The error bars indicate the smallest and largest value among three independent experiments, which represented by lower whisker and upper whisker, respectively.
- D, E
C4‐2 cells were treated with low (L, 1× IC50) or high (H, 2× IC50) concentrations of GDC0068 or RGFP966 for 4 days. The number of colonies with more than 50 cells was counted. Representatives of colonies are shown in (D) with quantification data shown in (E). Data represent means ± SEM; GDC (L) versus GDC (H): *P = 0.037; GDC0068 (H) versus RGFP (H): ***P = 1.47e‐05, RGFP (L) versus RGFP (H): ***P = 3.55e‐05 were performed by the unpaired two‐tailed Student's t‐test.
- F
C4‐2 cells were treated with GDC0068 or RGFP966 for 24 h followed by Western blots.
- G, H
Representative images of 3D cultures of C4‐2 cells at day 5 post‐treatment of GDC0068 (H), RGF966 (L), or RGF966 (H) as shown in (G) with quantification data shown in a box plot (H). Each box in the graph indicates the interquartile range (IQR). The horizontal line represents the median value. Box lower limit is the first quantile (Q1) while the upper limit is the third quantile (Q3). The lower whisker is max(min(x)), Q1 – 1.5*IQR while the upper whisker is min(max(x)), Q3 + 1.5*IQR. DMSO (n = 144) versus GDC (H) (n = 180): ***P = 2.23e‐32, DMSO versus RGFP (L) (n = 233): ***P = 1.04e‐36 and DMSO versus RGFP (H) (n = 83): ***P = 3.12e‐35 were performed by Wilcoxon rank sum test with continuity correction. Scale bar, 100 μm.
- I, J
Mice with C4‐2 xenograft tumors were treated with vehicle (DMSO), GDC0068 (H) (50 mg/kg), RGFP966 (L) (25 mg/kg), or RGFP966 (H) (50 mg/kg) 5 days a week for three consecutive weeks (I). Images of tumors isolated at day 21 are shown in (J). Data are shown as means ± SEM. DMSO (n = 7) versus GDC0068 (H) (n = 7): ***P = 4.18e‐10, DMSO versus RGFP966 (L) (n = 7): ***P = 1.40e‐09, GDC0068 (H) versus RGFP966 (H) (n = 7): *P = 0.0182, RGFP966 (L) versus RGFP966 (H): *P = 0.0104 comparing the tumor volume at day 21 post‐treatment by the unpaired two‐tailed Student's t‐test.
- K–M
Representatives of organoids at day 5 post‐treatment of GDC0068 (H), RGF966 (L), or RGF966 (H) are shown in (K) with quantification data of OD value at 490 nm in (L). The OD value was measured and quantified from three biological replicates. Data represent means ± SEM; DMSO versus GDC0068 (H): ***P = 2.18e‐05; DMSO versus RGFP966 (L): ***P = 1.43e‐04, DMSO versus RGFP966 (H): ***P = 1.40e‐08 were performed using the unpaired two‐tailed Student's t‐test. Based on the observed growth rate of untreated PTEN‐deleted organoids, greater than 50% of organoids reach 30 μm in diameter at day 5. “30 μm” was set as the cutoff value. The number of organoids with the diameter > 30 μm from at least five fields (each field contains at least 7 organoids) were counted and analyzed from three biological replicates (M). Data are shown as means ± SEM; DMSO versus GDC0068 (H): ***P = 8.02e‐05; DMSO versus RGFP966 (L): ***P = 1.39e‐04, DMSO versus RGFP966 (H): ***P = 2.96e‐06 were performed by the unpaired two‐tailed Student's t‐test. Scale bar, 100 μm.
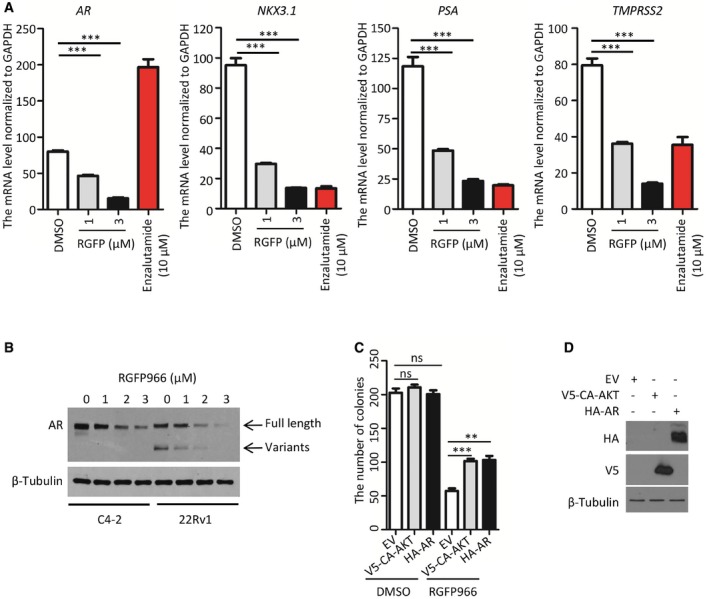
- A
C4‐2 cells were treated with vehicle (DMSO); different concentrations of HDAC3 inhibitor RGFP966 or the antiandrogen enzalutamide (positive control) for 24 h and cells were harvested for RT–qPCR analysis of mRNA levels of AR and its downstream target genes (NKX3.1, PSA, and TMPRSS2). The RT–qPCR was performed in triplicate for each sample. Data represents means ± SEM. For AR mRNA level, DMSO versus RGFP966 (1 μM): ***P = 9.42e‐05, DMSO versus RGFP966 (3 μM): ***P = 6.88e‐06; for NKX3.1 mRNA level, DMSO versus RGFP966 (1 μM): ***P = 1.47e‐04, DMSO versus RGFP966 (3 μM): ***P = 6.12e‐05; for PSA mRNA level, DMSO versus RGFP966 (1 μM): ***P = 8.24e‐04, DMSO versus RGFP966 (3 μM): ***P = 2.54e‐04; for TMPRSS2 mRNA level, DMSO versus RGFP966 (1 μM): ***P = 3.60e‐04, DMSO versus RGFP966 (3 μM): ***P = 6.81e‐05 were performed using the unpaired two‐tailed Student's t‐test.
- B
C4‐2 and 22Rv1 cells were treated with different concentrations of the HDAC3 inhibitor RGFP966 for 24 h and harvested for Western blot analysis with the indicated antibodies.
- C, D
C4‐2 cells transfected with V5‐CA‐AKT or HA‐AR were treated with two times of IC50 (2.5 μM) of RGFP966. The number of colonies after 10‐day treatment is shown in (C), and transfected proteins were analyzed by Western blots (D). The RT–qPCR was performed in triplicate for each sample. Data represent means ± SEM. For RGFP treatment, EV versus V5‐CA‐AKT, ***P = 0.0009; EV versus HA‐AR, **P = 0.0026. Statistical analysis was performed using the unpaired two‐tailed Student's t‐test.
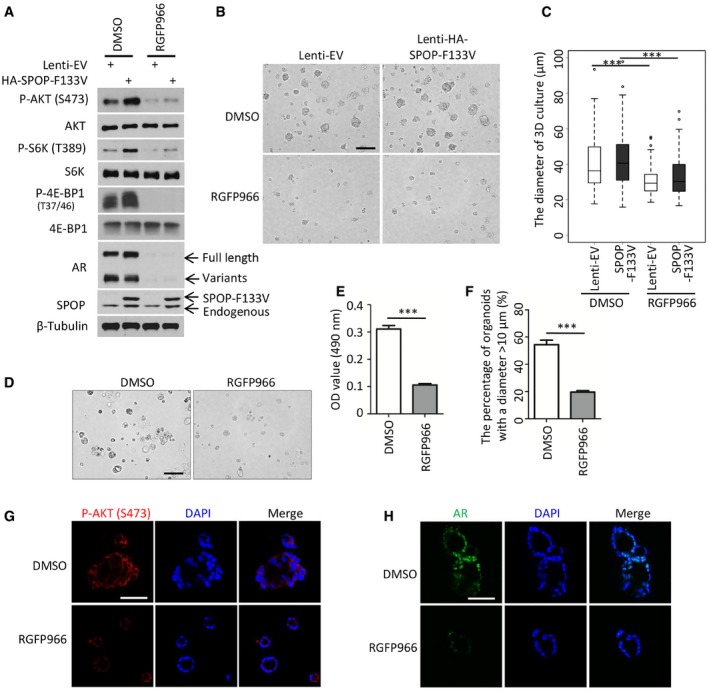
- A
22Rv1 cells stably infected with SPOP F133V mutant lentivirus were treated with 3 μM of RGFP966 for 24 h and harvested for Western blot with the indicated antibodies.
- B, C
Representative images of 3D Matrigel cultures 22Rv1 cells stably infected control or SPOP F133V lentivirus at day 5 post‐treatment of RGF966 are shown in (B) with the quantitative data in a box plot (C). The lentivirus transfection efficiency is at least 95% of total cells. In graph (C), the description for box plot is the same as the figure legend in Fig 7H. Data are shown as means ± SD. DMSO‐Lenti‐EV (n = 188) versus RGFP966‐Lenti‐EV (n = 139): ***P = 3.05e‐11, DMSO‐SPOP‐F1333V (n = 130) versus RGFP966‐SPOP‐F133V (n = 193): ***P = 2.85e‐12 were performed by Wilcoxon rank sum test with continuity correction. Scale bar, 100 μm.
- D–F
Representatives of patient‐derived SPOP‐mutant organoids at day 5 post‐treatment of DMSO or 3 μM of RGF966 are shown in (D) with the quantitative data of OD value at 490 nm in (E). ***P = 1.43e‐04 was performed using the unpaired two‐tailed Student's t‐test. Based on the observed growth rate of untreated SPOP‐mutated organoids, greater than 50% of organoids reach 10 μm in diameter at day 5. “10 μm” was set as the cutoff value. The number of organoids with the diameter > 10 μm) from at least five fields were counted and analyzed (F). Data are shown as means ± SEM. ***P = 3.36e‐05 was performed by the unpaired two‐tailed Student's t‐test. Scale bar, 100 μm.
- G, H
Patient‐derived SPOP‐mutant organoids were treated with vehicle (DMSO) or 3 μM of RGF966 for 5 days and harvested for IFC for phosphorylated AKT (S473) (G) and AR (H). Scale bars, 50 μm.
Comment in
-
Co-targeting driver pathways in prostate cancer: two birds with one stone.EMBO Mol Med. 2018 Apr;10(4):e8928. doi: 10.15252/emmm.201808928. EMBO Mol Med. 2018. PMID: 29572264 Free PMC article.
Similar articles
-
Cytosolic phospholipase A2α sustains pAKT, pERK and AR levels in PTEN-null/mutated prostate cancer cells.Biochim Biophys Acta. 2013 Jun;1831(6):1146-57. doi: 10.1016/j.bbalip.2013.02.011. Epub 2013 Mar 14. Biochim Biophys Acta. 2013. PMID: 23500889
-
SPOP Mutation Drives Prostate Tumorigenesis In Vivo through Coordinate Regulation of PI3K/mTOR and AR Signaling.Cancer Cell. 2017 Mar 13;31(3):436-451. doi: 10.1016/j.ccell.2017.02.004. Cancer Cell. 2017. PMID: 28292441 Free PMC article.
-
mTOR is a fine tuning molecule in CDK inhibitors-induced distinct cell death mechanisms via PI3K/AKT/mTOR signaling axis in prostate cancer cells.Apoptosis. 2016 Oct;21(10):1158-78. doi: 10.1007/s10495-016-1275-9. Apoptosis. 2016. PMID: 27484210
-
Interplay Among PI3K/AKT, PTEN/FOXO and AR Signaling in Prostate Cancer.Adv Exp Med Biol. 2019;1210:319-331. doi: 10.1007/978-3-030-32656-2_14. Adv Exp Med Biol. 2019. PMID: 31900915 Review.
-
Role of PI3K-AKT-mTOR Pathway as a Pro-Survival Signaling and Resistance-Mediating Mechanism to Therapy of Prostate Cancer.Int J Mol Sci. 2021 Oct 14;22(20):11088. doi: 10.3390/ijms222011088. Int J Mol Sci. 2021. PMID: 34681745 Free PMC article. Review.
Cited by
-
Posttranslational regulation of androgen dependent and independent androgen receptor activities in prostate cancer.Asian J Urol. 2020 Jul;7(3):203-218. doi: 10.1016/j.ajur.2019.11.001. Epub 2019 Nov 20. Asian J Urol. 2020. PMID: 33024699 Free PMC article. Review.
-
Transcription factor 3 (TCF3) combined with histone deacetylase 3 (HDAC3) down-regulates microRNA-101 to promote Burkitt lymphoma cell proliferation and inhibit apoptosis.Bioengineered. 2021 Dec;12(1):7995-8005. doi: 10.1080/21655979.2021.1977557. Bioengineered. 2021. PMID: 34658308 Free PMC article.
-
The role of acetylation and deacetylation in cancer metabolism.Clin Transl Med. 2025 Jan;15(1):e70145. doi: 10.1002/ctm2.70145. Clin Transl Med. 2025. PMID: 39778006 Free PMC article. Review.
-
Harnessing organoid technology in urological cancer: advances and applications in urinary system tumors.World J Surg Oncol. 2025 Jul 22;23(1):295. doi: 10.1186/s12957-025-03948-2. World J Surg Oncol. 2025. PMID: 40696357 Free PMC article. Review.
-
The novel BET-CBP/p300 dual inhibitor NEO2734 is active in SPOP mutant and wild-type prostate cancer.EMBO Mol Med. 2019 Nov 7;11(11):e10659. doi: 10.15252/emmm.201910659. Epub 2019 Sep 26. EMBO Mol Med. 2019. PMID: 31559706 Free PMC article.
References
-
- An J, Ren S, Murphy SJ, Dalangood S, Chang C, Pang X, Cui Y, Wang L, Pan Y, Zhang X et al (2015) Truncated ERG oncoproteins from TMPRSS2‐ERG fusions are resistant to SPOP‐mediated proteasome degradation. Mol Cell 59: 904–916 - PubMed
Publication types
MeSH terms
Substances
Grants and funding
LinkOut - more resources
Full Text Sources
Other Literature Sources
Molecular Biology Databases
Research Materials
Miscellaneous
