

Coordinated Ramping of Dorsal Striatal Pathways preceding Food Approach and Consumption
- PMID: 29523623
- PMCID: PMC5895041
- DOI: 10.1523/JNEUROSCI.2693-17.2018
Coordinated Ramping of Dorsal Striatal Pathways preceding Food Approach and Consumption
Abstract
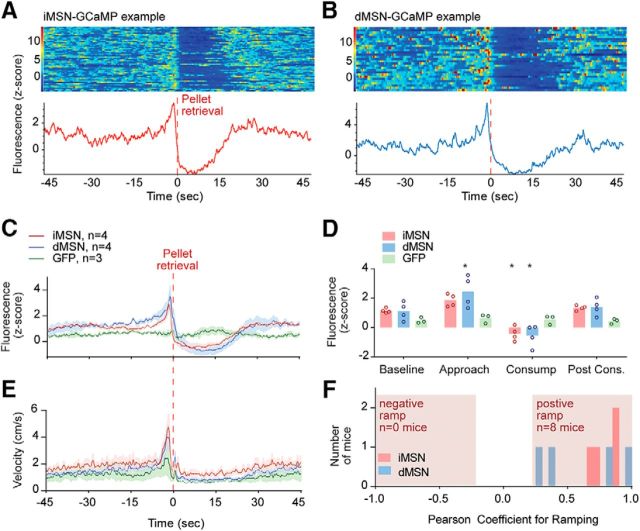
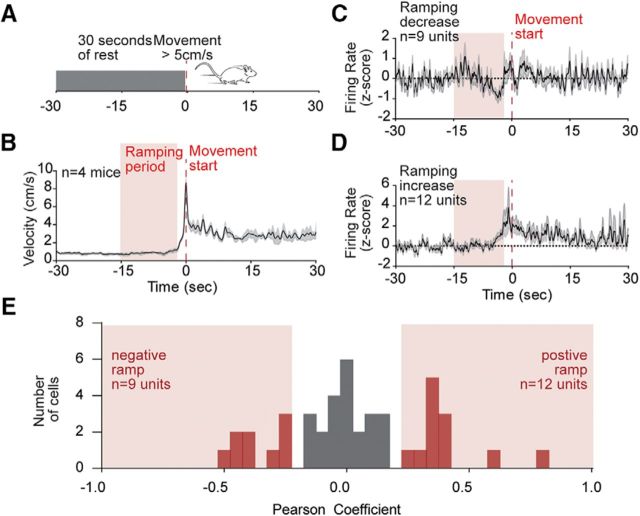
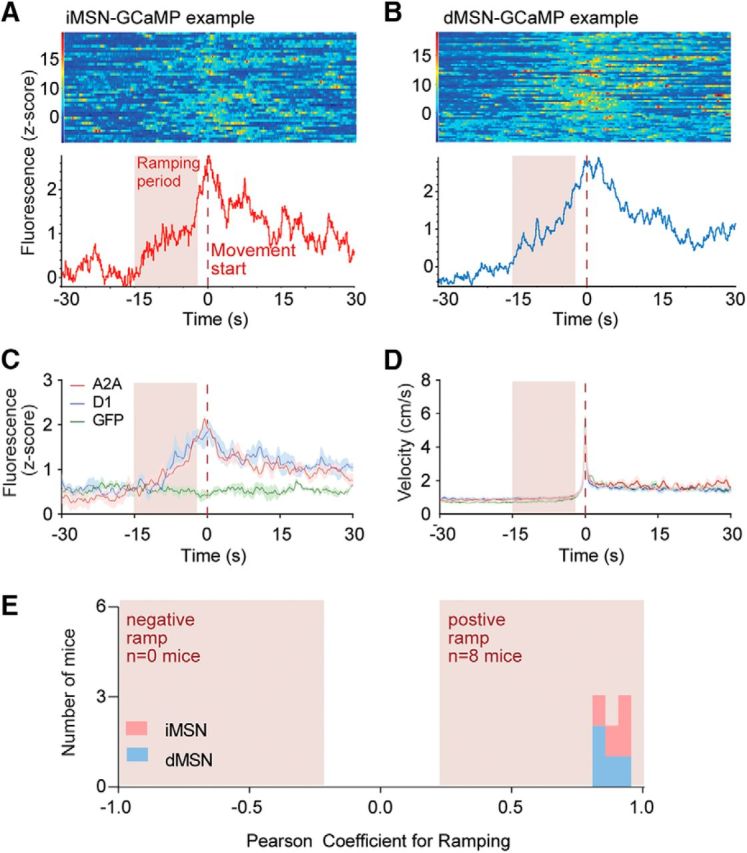
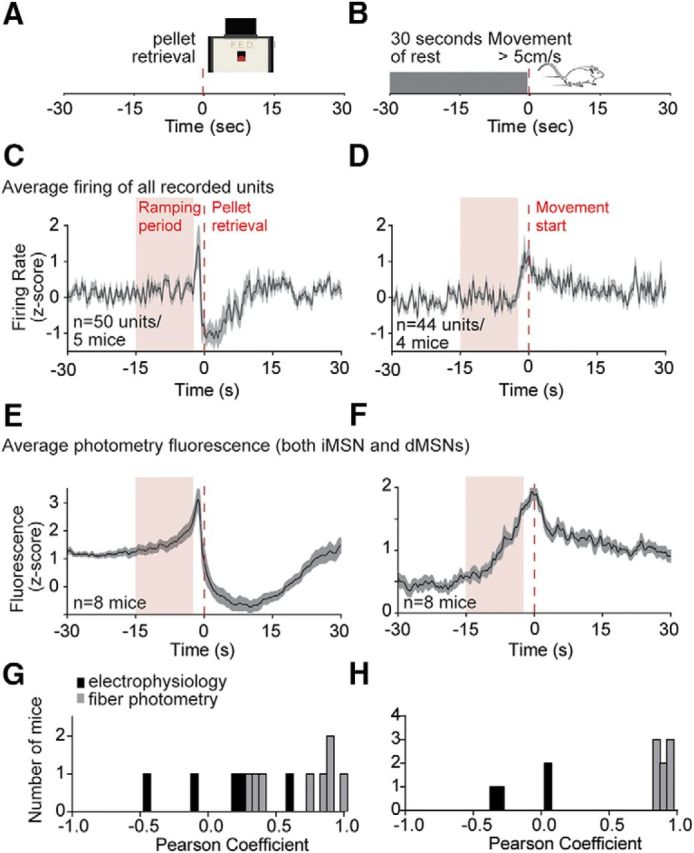
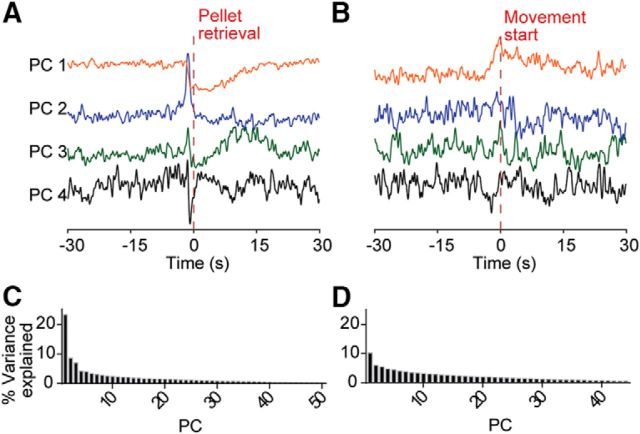
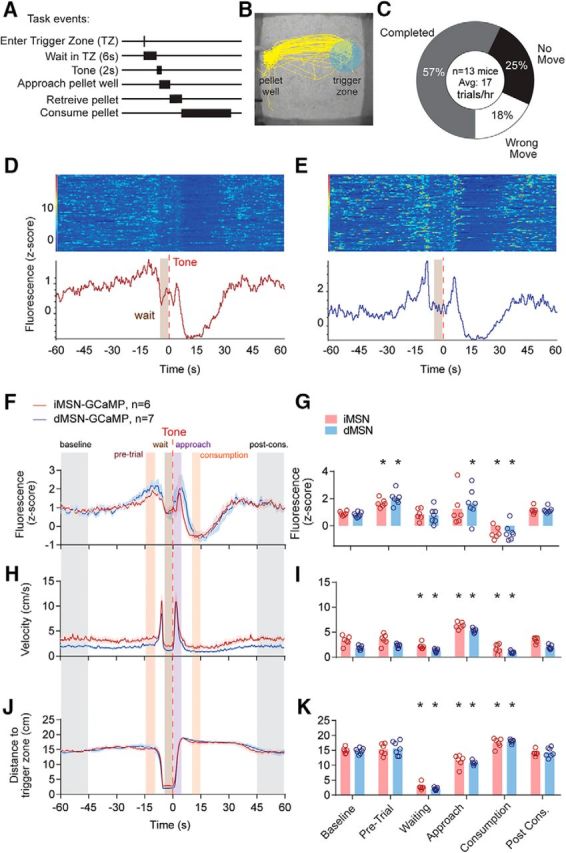
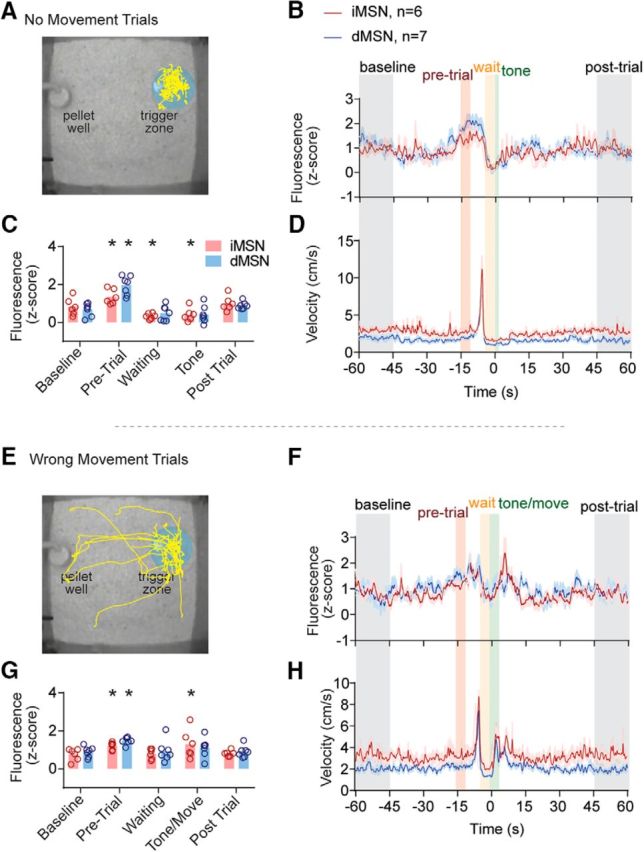
The striatum controls food-related actions and consumption and is linked to feeding disorders, including obesity and anorexia nervosa. Two populations of neurons project from the striatum: direct pathway medium spiny neurons and indirect pathway medium spiny neurons. The selective contribution of direct pathway medium spiny neurons and indirect pathway medium spiny neurons to food-related actions and consumption remains unknown. Here, we used in vivo electrophysiology and fiber photometry in mice (of both sexes) to record both spiking activity and pathway-specific calcium activity of dorsal striatal neurons during approach to and consumption of food pellets. While electrophysiology revealed complex task-related dynamics across neurons, population calcium was enhanced during approach and inhibited during consumption in both pathways. We also observed ramping changes in activity that preceded both pellet-directed actions and spontaneous movements. These signals were heterogeneous in the spiking units, with neurons exhibiting either increasing or decreasing ramps. In contrast, the population calcium signals were homogeneous, with both pathways having increasing ramps of activity for several seconds before actions were initiated. An analysis comparing population firing rates to population calcium signals also revealed stronger ramping dynamics in the calcium signals than in the spiking data. In a second experiment, we trained the mice to perform an action sequence to evaluate when the ramping signals terminated. We found that the ramping signals terminated at the beginning of the action sequence, suggesting they may reflect upcoming actions and not preconsumption activity. Plasticity of such mechanisms may underlie disorders that alter action selection, such as drug addiction or obesity.SIGNIFICANCE STATEMENT Alterations in striatal function have been linked to pathological consumption in disorders, such as obesity and drug addiction. We recorded spiking and population calcium activity from the dorsal striatum during ad libitum feeding and an operant task that resulted in mice obtaining food pellets. Dorsal striatal neurons exhibited long ramps in activity that preceded actions by several seconds, and may reflect upcoming actions. Understanding how the striatum controls the preparation and generation of actions may lead to improved therapies for disorders, such as drug addiction or obesity.
Keywords: accumbens; basal ganglia; electrophysiology; feeding; reward; striatum.
Copyright © 2018 the authors 0270-6474/18/383547-12$15.00/0.
Conflict of interest statement
The authors declare no competing financial interests.
Figures
Similar articles
-
Ventrolateral Striatal Medium Spiny Neurons Positively Regulate Food-Incentive, Goal-Directed Behavior Independently of D1 and D2 Selectivity.J Neurosci. 2017 Mar 8;37(10):2723-2733. doi: 10.1523/JNEUROSCI.3377-16.2017. Epub 2017 Feb 6. J Neurosci. 2017. PMID: 28167674 Free PMC article.
-
Continuous Representations of Speed by Striatal Medium Spiny Neurons.J Neurosci. 2020 Feb 19;40(8):1679-1688. doi: 10.1523/JNEUROSCI.1407-19.2020. Epub 2020 Jan 17. J Neurosci. 2020. PMID: 31953369 Free PMC article.
-
Optogenetic insights into striatal function and behavior.Behav Brain Res. 2013 Oct 15;255:44-54. doi: 10.1016/j.bbr.2013.04.018. Epub 2013 Apr 28. Behav Brain Res. 2013. PMID: 23628212 Review.
-
Decreasing Striatopallidal Pathway Function Enhances Motivation by Energizing the Initiation of Goal-Directed Action.J Neurosci. 2016 Jun 1;36(22):5988-6001. doi: 10.1523/JNEUROSCI.0444-16.2016. J Neurosci. 2016. PMID: 27251620 Free PMC article.
-
A competitive model for striatal action selection.Brain Res. 2019 Jun 15;1713:70-79. doi: 10.1016/j.brainres.2018.10.009. Epub 2018 Oct 6. Brain Res. 2019. PMID: 30300636 Free PMC article. Review.
Cited by
-
Fiber photometry in striatum reflects primarily nonsomatic changes in calcium.Nat Neurosci. 2022 Sep;25(9):1124-1128. doi: 10.1038/s41593-022-01152-z. Epub 2022 Aug 30. Nat Neurosci. 2022. PMID: 36042311 Free PMC article.
-
Leveraging calcium imaging to illuminate circuit dysfunction in addiction.Alcohol. 2019 Feb;74:47-63. doi: 10.1016/j.alcohol.2018.05.013. Epub 2018 Jun 6. Alcohol. 2019. PMID: 30470589 Free PMC article. Review.
-
Disruption of Nrxn1α within excitatory forebrain circuits drives value-based dysfunction.Elife. 2020 Dec 4;9:e54838. doi: 10.7554/eLife.54838. Elife. 2020. PMID: 33274715 Free PMC article.
-
Striatal signaling tracks naturalistic short-term fluctuations in hunger-satiety.bioRxiv [Preprint]. 2025 May 6:2025.04.29.651295. doi: 10.1101/2025.04.29.651295. bioRxiv. 2025. PMID: 40655018 Free PMC article. Preprint.
-
The Secondary Motor Cortex-striatum Circuit Contributes to Suppressing Inappropriate Responses in Perceptual Decision Behavior.Neurosci Bull. 2023 Oct;39(10):1544-1560. doi: 10.1007/s12264-023-01073-2. Epub 2023 May 31. Neurosci Bull. 2023. PMID: 37253985 Free PMC article.
References
Publication types
MeSH terms
Substances
LinkOut - more resources
Full Text Sources
Other Literature Sources
Molecular Biology Databases