. 2018 Apr 15;200(8):2615-2626.
doi: 10.4049/jimmunol.1700429. Epub 2018 Mar 9.

A Restricted Role for FcγR in the Regulation of Adaptive Immunity

Affiliations

A Restricted Role for FcγR in the Regulation of Adaptive Immunity

Marieke F Fransen et al. J Immunol. .

Abstract

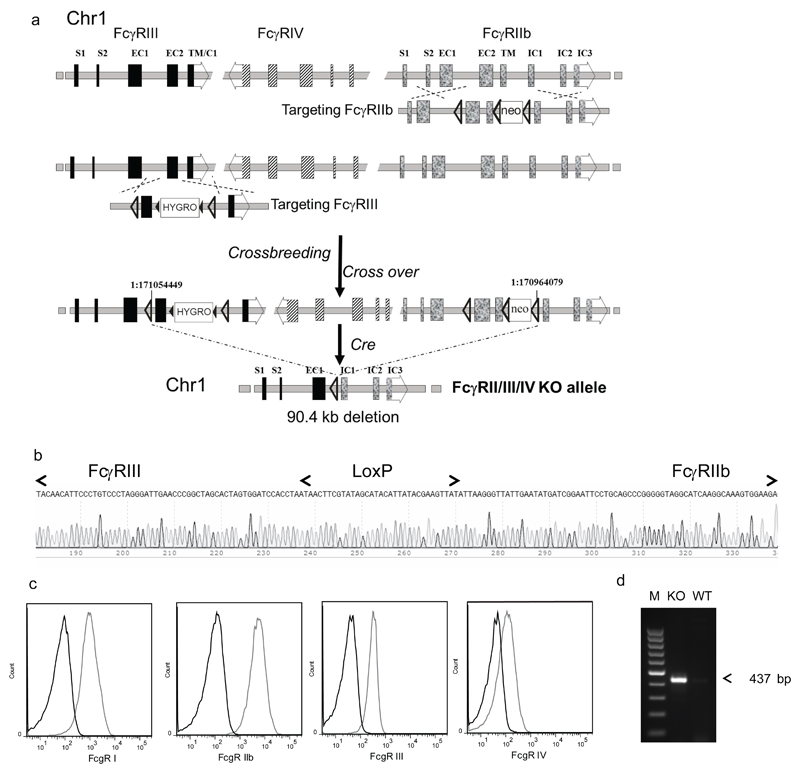
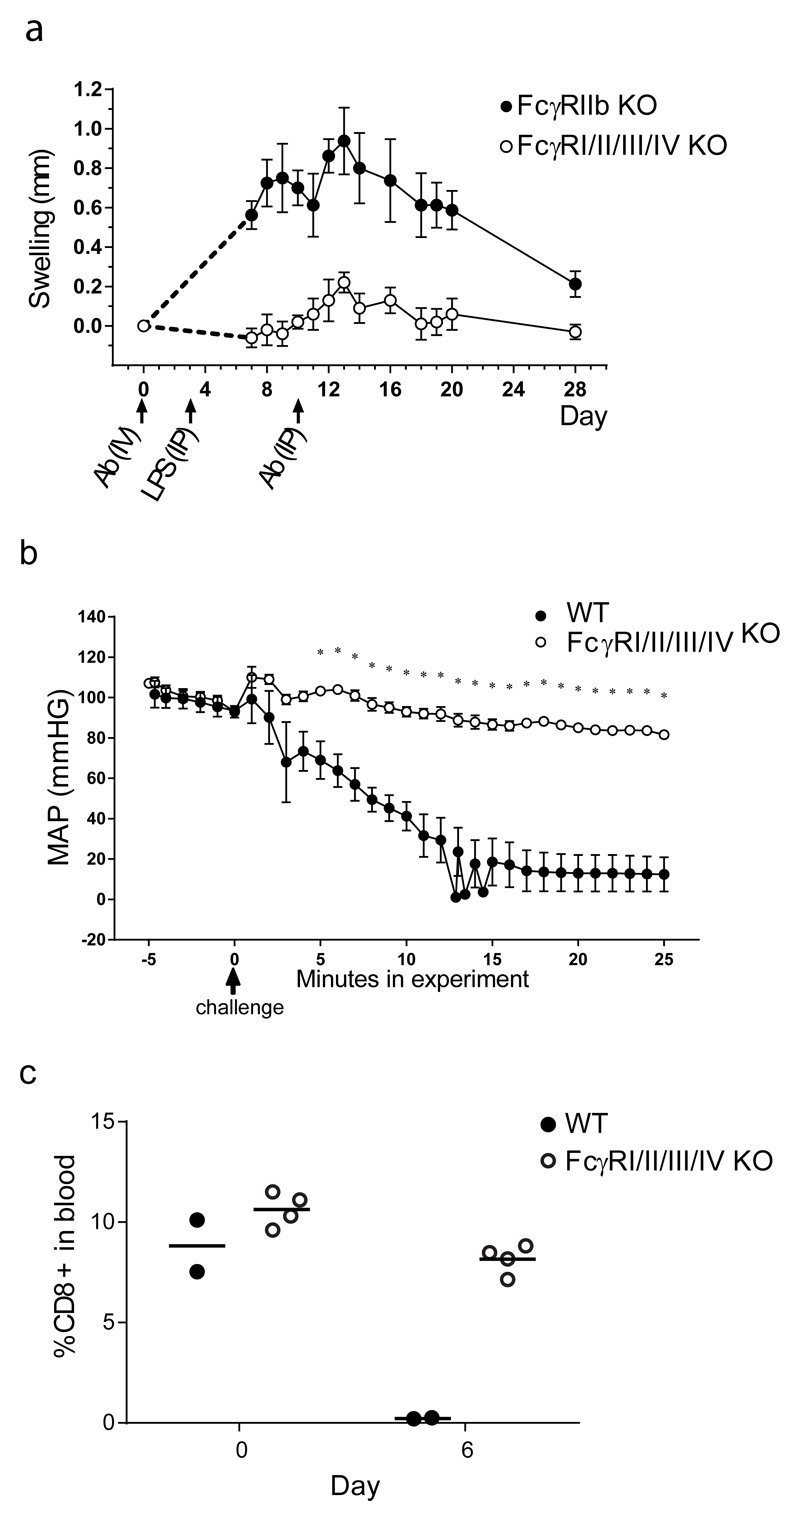
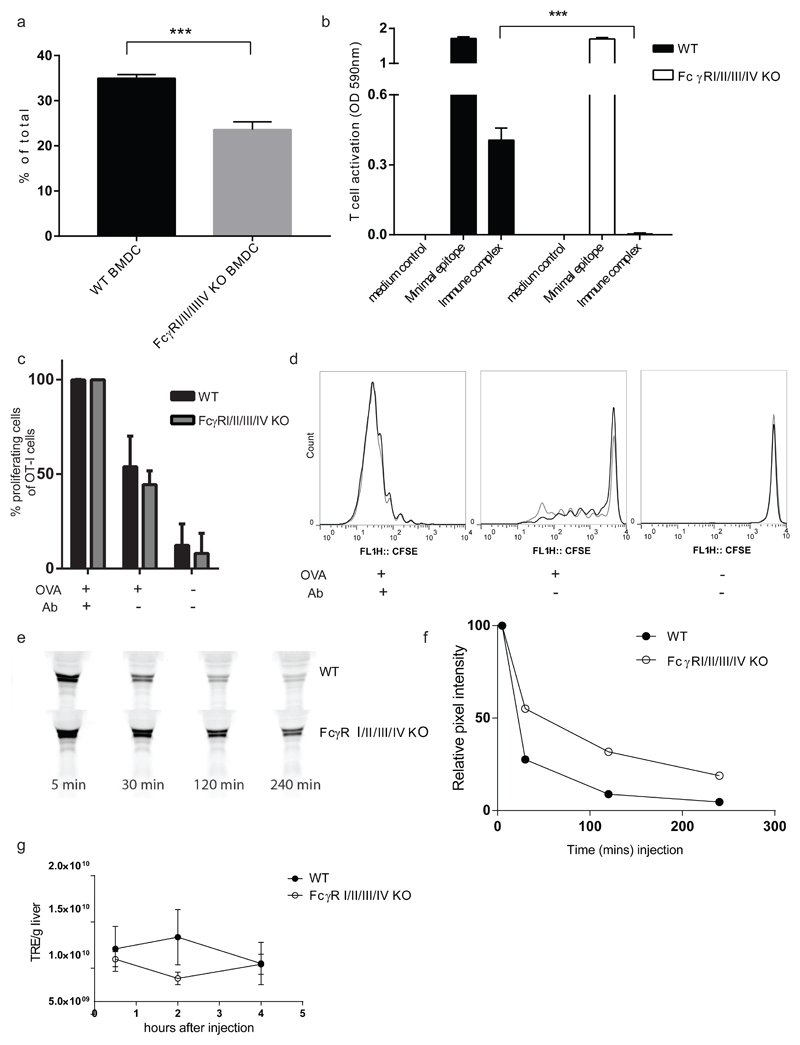
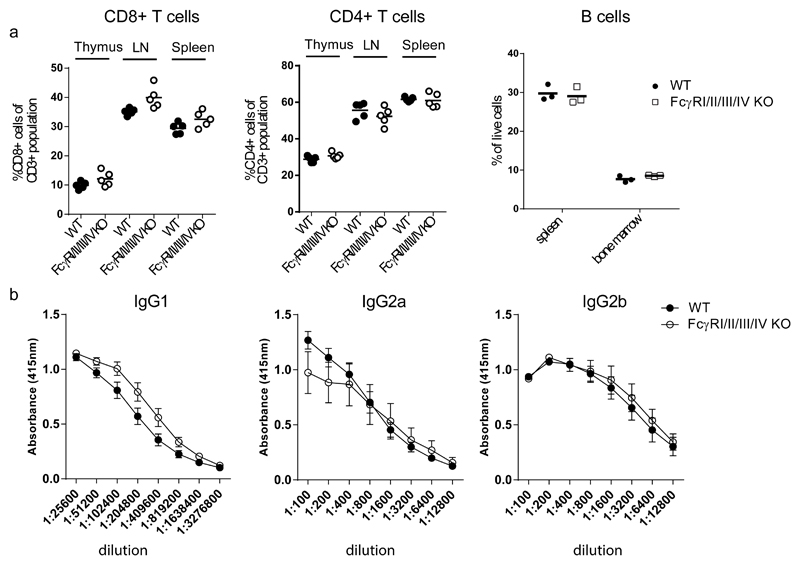
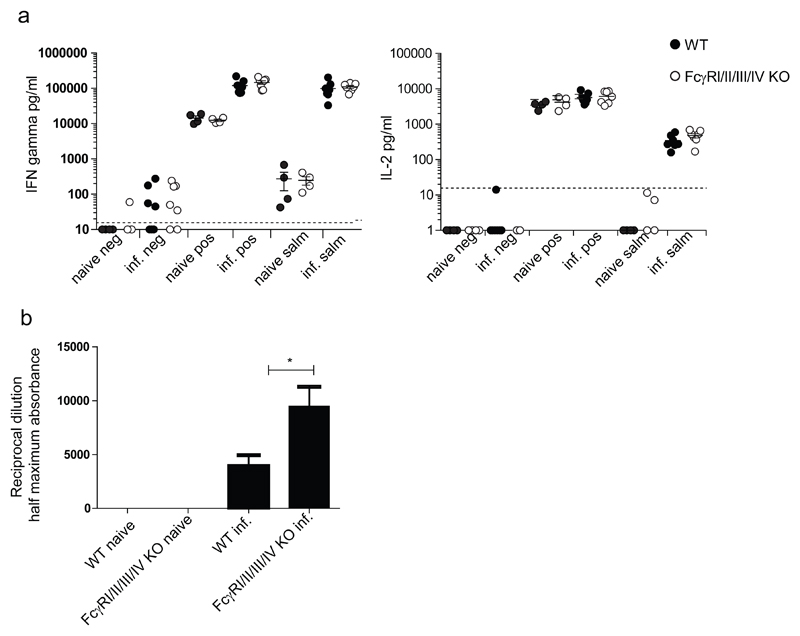
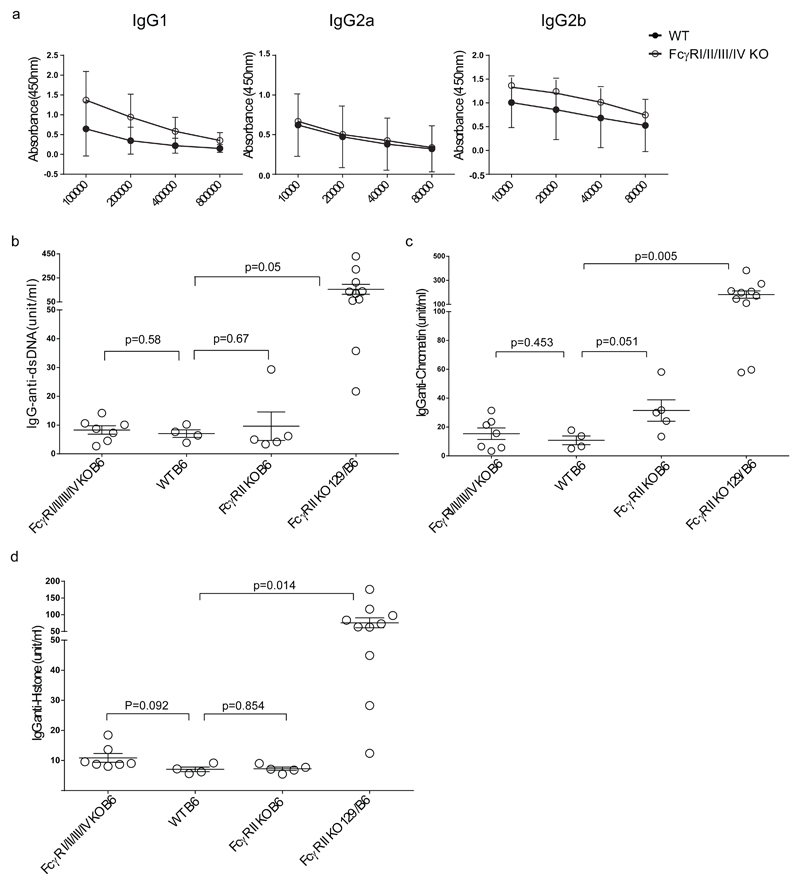
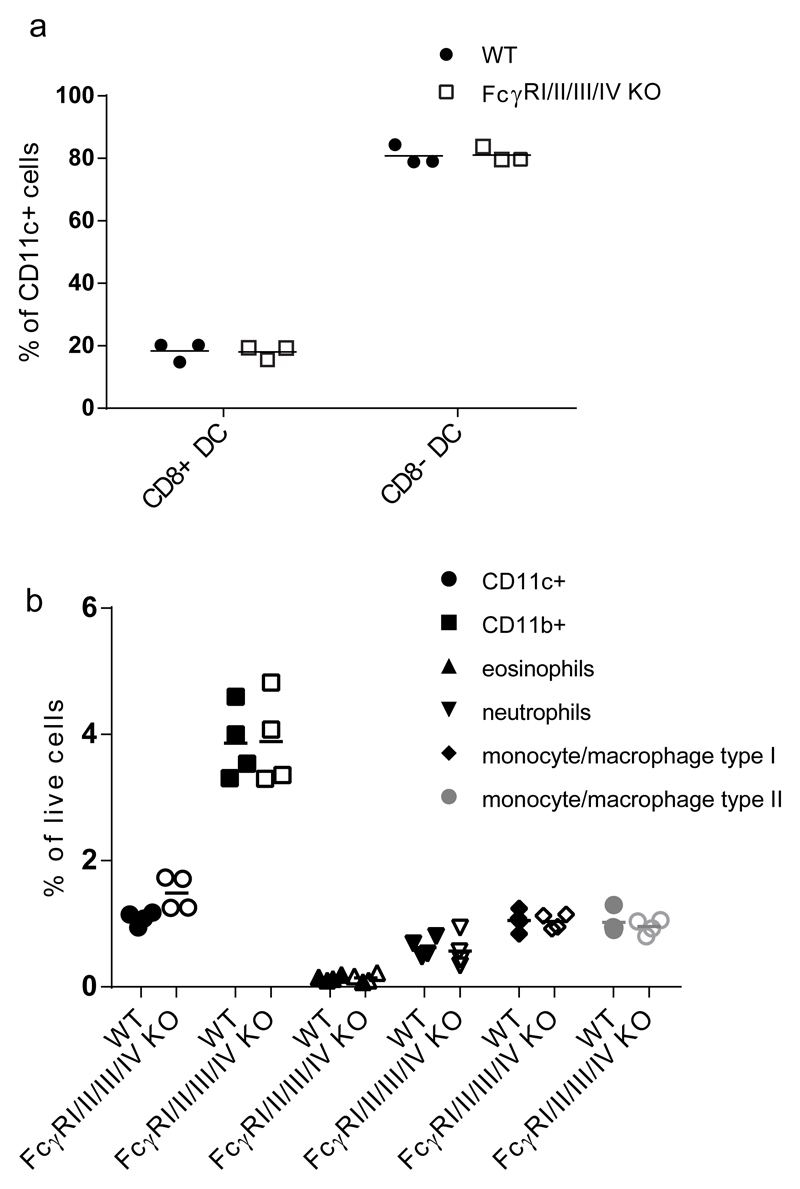
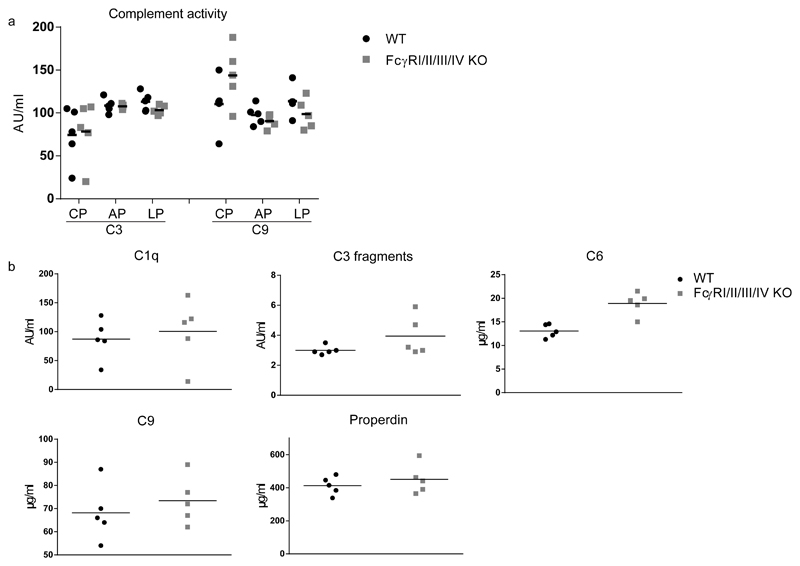
By their interaction with IgG immune complexes, FcγR and complement link innate and adaptive immunity, showing functional redundancy. In complement-deficient mice, IgG downstream effector functions are often impaired, as well as adaptive immunity. Based on a variety of model systems using FcγR-knockout mice, it has been concluded that FcγRs are also key regulators of innate and adaptive immunity; however, several of the model systems underpinning these conclusions suffer from flawed experimental design. To address this issue, we generated a novel mouse model deficient for all FcγRs (FcγRI/II/III/IV-/- mice). These mice displayed normal development and lymphoid and myeloid ontogeny. Although IgG effector pathways were impaired, adaptive immune responses to a variety of challenges, including bacterial infection and IgG immune complexes, were not. Like FcγRIIb-deficient mice, FcγRI/II/III/IV-/- mice developed higher Ab titers but no autoantibodies. These observations indicate a redundant role for activating FcγRs in the modulation of the adaptive immune response in vivo. We conclude that FcγRs are downstream IgG effector molecules with a restricted role in the ontogeny and maintenance of the immune system, as well as the regulation of adaptive immunity.


Figures

Fig.1
Fig.1. Generation of the FcγRI/FcγRII/FcγRIII/FcγRIV quadruple KO (FcγRI/II/III/IV-/-) mouse strain.
FcγRIIbfl/fl mice (13) were crossed with FcγRIIIfl/fl mice (supplemental figure S1). Offspring was selected for crossover between both floxed alleles. By crossing FcγRIIbfl/fl / FcγRIIfl/fl mice with the EIIaCre deleter strain a 90.4 kb fragment between the two most distant loxP sites, containing the main part of the FcγRIIb and FcγRIII gene and the complete FcγRIV gene, was removed resulting in a FcγRII/III/IV KO allele. The presence of the deletion was confirmed by PCR and DNA sequencing. The FcγRII/III/IV-/- mice were crossed with our previously generated FcγRI-/- mice (16) and FcγRI/II/III/IV-/- offspring was selected. The absence of all four FcγR was confirmed by FACS analysis. a. From top to bottom are depicted the genomic structure of the WT FcγRIIb/FcγRIV/FcγRIII gene cluster on chromosome 1, the gene targeting strategy for the generation of the floxed FcγRIIb and FcγRIII genes, the genomic structure after the crossover between the two floxed genes and subsequently after Cre mediated recombination. The locus is shown in reverse orientation in relation to the chromosomal nucleotide numbering. The exact location of the borders of the deletion (NC_000067.6:g 171054449_170964079del according to HGVS nomenclature) on chromosome 1 are depicted based on the mouse reference genome build GRCm38.p3 (C57BL/6J) provided by the Genome Reference Consortium. b. Core sequence flanking the remaining LoxP site within the 437 bp PCR fragment. c. Flow cytometry of thioglycolate elicited peritoneal cells from FcγRI/II/III/IV-/- (black lines) and WT C57BL/6 mice (grey lines) stained with fluorescent labeled antibodies specific for F4.80 and CD11b and antibodies specific for the different FcγR as indicated. d. Agarose gel electrophoresis of the unique PCR fragment bridging the 90.4 kb deletion. By using a FcγRIII specific ‘Geno Fw’: GAGGGCATCCGATTTCATTA and a FcγRIIb specific ‘Null B Rev’ GCTTCCATTGACCTGCCTAC primer, and genomic DNA from a FcγRII/III/IV-/-mouse as a template, a unique 437 bp fragment with the remaining LoxP site was synthesized. M: 100bp ladder, KO: FcγRII/III/IV-/- mouse; WT: WT control mouse.
Fig.2
Fig.2. IgG downstream effector functions are impaired in FcγRI/II/III/IV-/- mice
a. CAIA. From each phenotype footpad swelling was measured using a caliper. The average of combined left and right footpad swelling of the forepaws was plotted and expressed as Mean and SEM of increase in footpad thickness in mm. The area under the curve was calculated per mouse from day 7 until day 28 and a Mann-Witney test was performed for statistics. The response of the FcγRI/II/III/IV-/- mice was significantly lower compared to the response of FcγRIIb-/- mice (P=0.0159). Five mice per group. One representative experiment out of two performed is shown. b. Passive systemic anaphylaxis. Time course of blood pressure, expressed in mm HG, as mean arterial pressure (MAP) plus SEM, in FcγRI/II/III/IV-/- and WT C57BL/6 mice passively sensitized by i.v. injection of mouse anti-TNP IgG2a, and challenged 4 hours later with DNP-HSA. Six mice per group. Each time point is analyzed by a separate T test, and the curves are significantly different (p<0.01) from 5 minutes onwards, indicated with *. c. ADCP. Mice were injected with CD8+ depleting Ab (2.43). Before and after Ab injection, the number of CD8+ T cell in blood was determined by flow cytometry and depicted as percentage of CD8+/CD3+ cells of total lymphocyte population. Data shown are from one out of two experiments with similar results. Four FcγRI/II/III/IV-/- and two WT mice per group. Data was statistically analyzed with a T test at each time point, p=0.15 at day 0, and 0.0001 at day 6 as compared to WT C57BL/6 mice.
Fig.3
Fig.3. FcγR involvement in the cross-presentation of IgG-IC derived Ag
a. Uptake of IgG-IC derived Alexa488 labeled Ag by bone-marrow derived dendritic cells (BM-DC) from WT and FcγRI/II/III/IV-/- mice measured by flow cytometry, presented as mean plus SD of three samples. Extracellular binding was quenched by the addition of trypan blue. Depicted is percentage of Alexa488 positive cells out of total cell count. One representative experiment of two experiments performed is shown, statistical analysis was performed with T test. Asterisks indicate significant differences (***p<0.001) as compared to WT C57BL/6. b. BM-DC from FcγRI/II/III/IV-/- and WT C57BL/6 mice were incubated with OVA-IgG IC and subsequently co-cultured with T cell hybridoma B3Z which recognized an OVA-CTL epitope in MHC class I. Recognition leads to activation of the LacZ reporter gene which was measured with a β-galactosidase assay, and analyzed as absorption of light at OD590 nm. Minimal SIINFEKL OVA epitope was included as an MHC class I loaded positive control in both DC types. Presented as mean plus SEM, 4 samples per group. Statistical analysis was performed with a T test, (***p<0.001 for the mice that received immune complexes as compared to WT C57BL/6 mice c and d. WT C57BL/6 and FcγRI/II/III/IV-/- mice were injected with CFSE labeled OT-I T cells and subsequently injected with OVA with or without anti-OVA IgG. In vivo cross presentation was determined by analyzing the CFSE dilution of OT-I cells using flow-cytometry. Depicted are percentage of proliferating OT-I cells (CFSE fluorescence is diluted at least once) of total OT-I gated cells as mean of group plus SD (c) and representative CFSE plots (d). Data shown are from one out of two experiments with similar results. Five mice per group. Statistical analysis with T test per condition revealed no differences, p=0.63, 0.15, 0.73 respectively for OVA+Ab, OVA alone and naïve mice compared to WT C57BL/6 mice. e and f. Western blot analysis of the presence of Alexa488 labeled OVA in serum of mice at different time-points after i.v. injection of the OVA anti-OVA IgG IC (e) and quantification of fluorescent OVA in Western Blot samples (f). Data shown are representative samples from three mice per experiment. Three experiments with similar results were performed. g. At different time-points after injection, mice were sacrificed and a single lobe of liver was isolated and imaged. Signal quantification of Alexa488 labeled IgG IC was performed. The fluorescent signal is shown as the total radiant efficiency (TRE), expressed in (photons/second)/(µW/cm2). The TRE/g liver in the time is shown. Data shown are from one out of two experiments with similar results. Three mice per group.
Fig.4
Fig.4. Adaptive immune system is normal in FcγRI/II/III/IV-/- mice
a. Lymphoid organs were harvested from two months old FcγRI/II/III/IV-/- and WT mice. Single cell suspensions were labeled with fluorescent Abs and analyzed using flow-cytometry. Each symbol represents an individual mouse. Data shown are from one out of two experiments with similar results. b. Mice were immunized three times with TNP-BSA. Serum samples were taken 8 days after first boost and 7 and 12 days after second boost. Titres of anti-BSA antibodies were determined with ELISA. Data of day 12 are shown. Other time points showed similar results. Eight mice per group, shown is mean plus SEM.
Fig.5
Fig.5. T and B cell responses to Salmonella infection were similar in FcγRI/II/III/IV-/- and WT control mice.
a. CD4+ T cells were positively enriched from splenocytes of groups of seven WT C57BL/6 and seven FcγRI/II/III/IV-/- mice infected 10 weeks earlier with STm SL3261. Groups of four WT C57BL/6 and four FcγRI/II/III/IV-/- naïve mice were also included in the experiment. The cells from individual mice were exposed to Salmonella Ag (salm) or anti-CD3 and anti-CD28 (pos) as a positive control, or medium (neg), as negative control. IFNγ (left panel) and IL2 (right panel) were measured in the supernatants by ELISA after 72 and 24 hours respectively. Data of one representative experiment out of two performed are shown. Statistical analysis using ANOVA did not show significant differences between WT C67BL/6 and FcγRI/II/III/IV-/-mice. b. Anti-STm LPS Abs were measured by ELISA in the sera of groups of five WT C57BL/6 and five FcγRI/II/III/IV-/- mice infected as in fig 5a. Groups of four naïve mice were included as controls. Ab titers are expressed as the reciprocal of the dilutions giving a reading equal to half of the maximal absorbance. Data of one representative experiment out of two performed are shown. Statistical analysis was performed with T-test. Asterisks indicate significant difference. (* p< 0.05) as compared to WT C57BL/6.
Fig.6
Fig.6. IgG titres in older FcγRI/II/III/IV-/- and WT control mice
a. IgG1, IgG2a and IgG2b titres were determined in sera of FcγRI/II/III/IV-/- and WT C57BL/6 mice with ELISA, three mice per group. One representative experiment out of two performed is shown. b, c and d. IgG anti-dsDNA Ab titers (b) IgG anti-Chromatin titers (c) and IgG anti Histone titers (d), were determined by ELISA using anti-mouse γ chain-specific secondary Abs. Each symbol represents a mouse. Mean and SEM are shown with respective p-values.
Fig.7
Fig.7. No differences in myeloid cell compartments between FcγRI/II/III/IV-/- and WT C57BL/6 control mice.
a. Spleens of three months old FcγRI/II/III/IV-/- and WT C57BL/6 mice were incubated with Liberase, and single cell suspensions were labeled and analyzed by flow-cytometry. Graphs show the percentage CD8 positive or negative cells of CD11c+/CD19-/ B220-/7-AAD- cells. Three mice per group. Data shown are from one out of two experiments with similar results. b. Spleens of three months old FcγRI/II/III/IV-/- and WT C57BL/6 mice were incubated with Liberase, and single cell suspensions were labeled and analyzed by flow-cytometry. Gating strategy was according to Shawn Rose et al (40), in short, gated on 7-aad-/CD19-/CD3- and followed by CD11c+ for CD11c+ group, CD11b+ for CD11b+ group, F4-80 +/-/ Ly6G+ for neutrophils, F4-80+/ Ly6G-/Ly6C+/-, SSC high for eosinophils, F4-80+/ Ly6G-/Ly6C+, SSC low monocyte/macrophage type I, F4-80+ /Ly6G-/Ly6C-, SSC low for monocyte/macrophage type II. Four mice per group. Data shown are from one out of two experiments with similar results. Statistical analysis performed with Sidak’s multiple comparisons test, showed that all groups were not significantly different from each other.
Fig. 8
Fig. 8. No differences in plasma concentrations and activity of complement factors between FcγRI/II/III/IV-/- mice and WT C57BL/6 control mice.
a. Functional complement activity in plasma of WT C57BL/6 and FcγRI/II/III/IV-/- mice was determined for all three pathways (classical (CP), alternative (AP) and lectin pathway (LP), both at the level of C3 deposition and at the level of C9 deposition. Samples were tested in serial dilutions, quantified in comparison with a standard CD1 serum and depicted as AU/ml. Five mice per group. Statistical analysis with Sidak’s multiple comparison’s test revealed no significant difference between FcγRI/II/III/IV-/-.and WT C57/BL/6 mice. b. Individual complement factors were quantified in plasma of five mice per genotype using specific ELISAs. This includes C1q as inducer of the classical pathway, properdin as stabilizer of the alternative pathway, the central component C3 and C6 and C9 as part of the terminal pathway. Data are shown as the amounts per ml serum of the indicated factors either in μg (properdin, C6 and C9) or in (AU) arbitrary units (C1q and C3 fragment).

Similar articles

Cited by

References

    1. Takai T, Li M, Sylvestre D, Clynes R, Ravetch JV. FcR gamma chain deletion results in pleiotrophic effector cell defects. Cell. 1994;76:519–529. - PubMed
    1. Bruhns P, Jonsson F. Mouse and human FcR effector functions. Immunol Rev. 2015;268:25–51. - PubMed
    1. Lee CH, Romain G, Yan W, Watanabe M, Charab W, Todorova B, Lee J, Triplett K, Donkor M, Lungu OI, Lux A, et al. IgG Fc domains that bind C1q but not effector Fcgamma receptors delineate the importance of complement-mediated effector functions. Nat Immunol. 2017;18:889–898. - PMC - PubMed
    1. Fearon DT, Carroll MC. Regulation of B lymphocyte responses to foreign and self-antigens by the CD19/CD21 complex. Annu Rev Immunol. 2000;18:393–422. - PubMed
    1. Ahearn JM, Fischer MB, Croix D, Goerg S, Ma M, Xia J, Zhou X, Howard RG, Rothstein TL, Carroll MC. Disruption of the Cr2 locus results in a reduction in B-1a cells and in an impaired B cell response to T-dependent antigen. Immunity. 1996;4:251–262. - PubMed

Publication types

LinkOut - more resources