. 2018 Apr 27;293(17):6214-6229.
doi: 10.1074/jbc.RA118.002372. Epub 2018 Mar 9.

The transcription factor Klf5 is essential for intrahepatic biliary epithelial tissue remodeling after cholestatic liver injury

Affiliations

The transcription factor Klf5 is essential for intrahepatic biliary epithelial tissue remodeling after cholestatic liver injury

Hajime Okada et al. J Biol Chem. .

Abstract

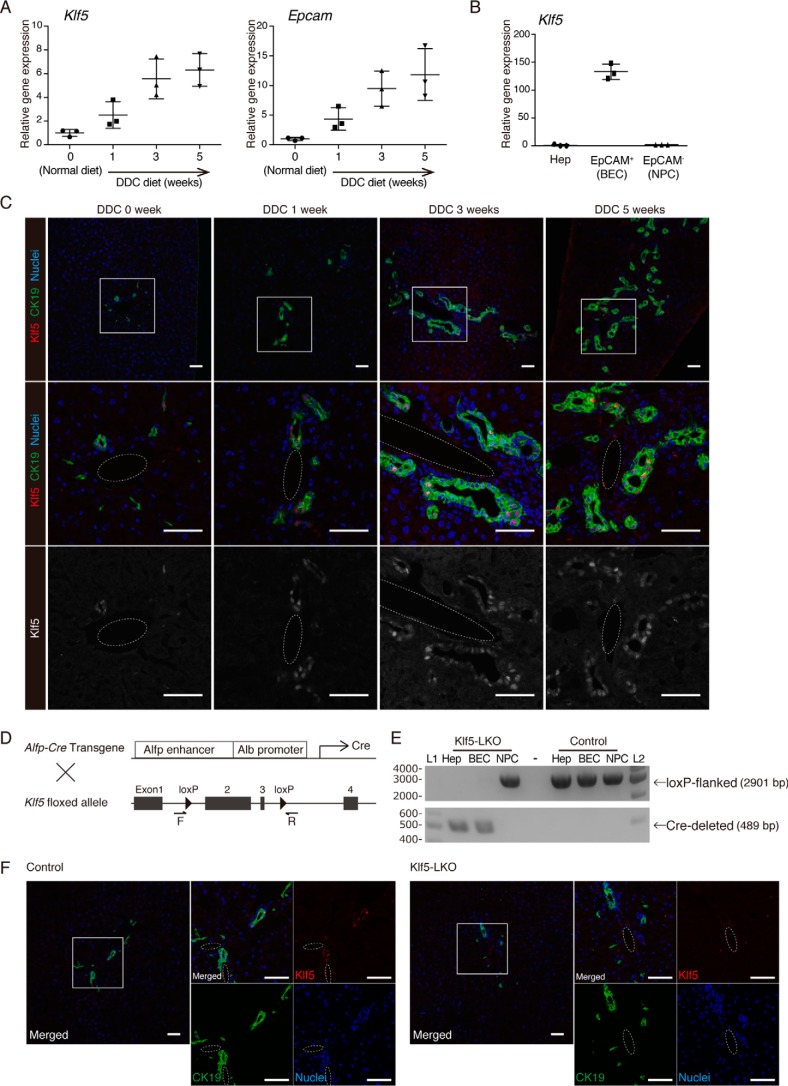
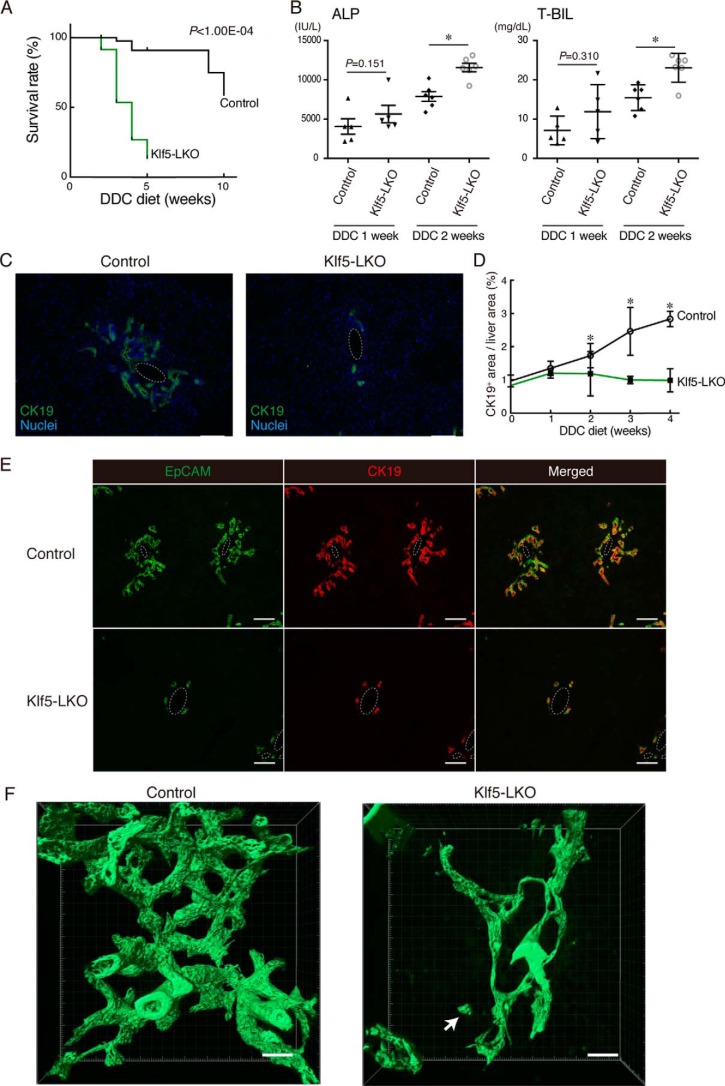
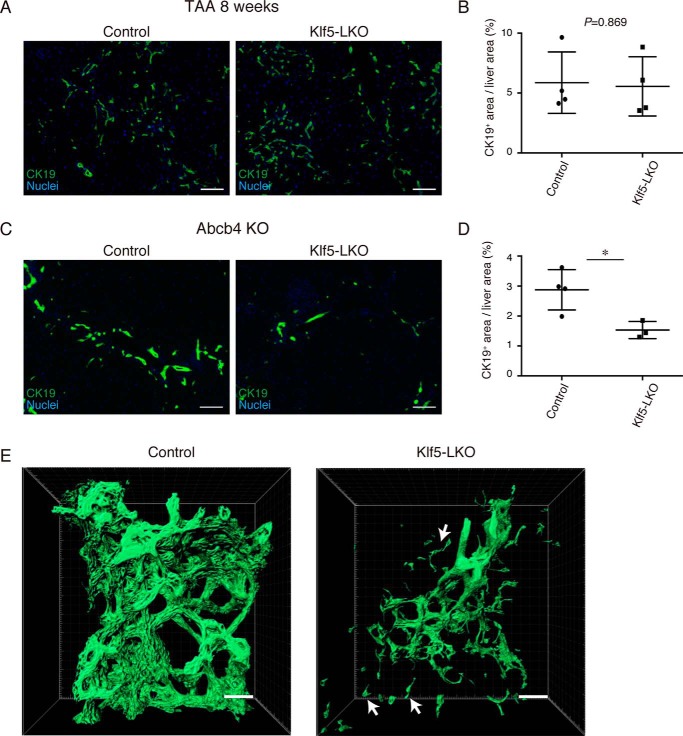
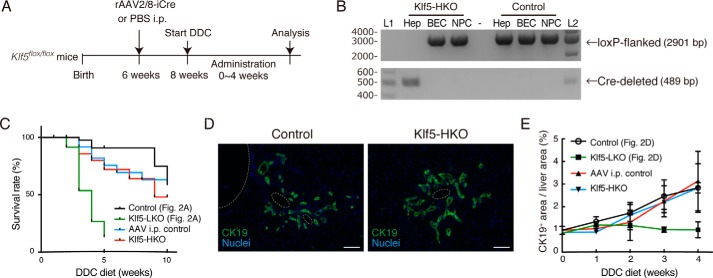
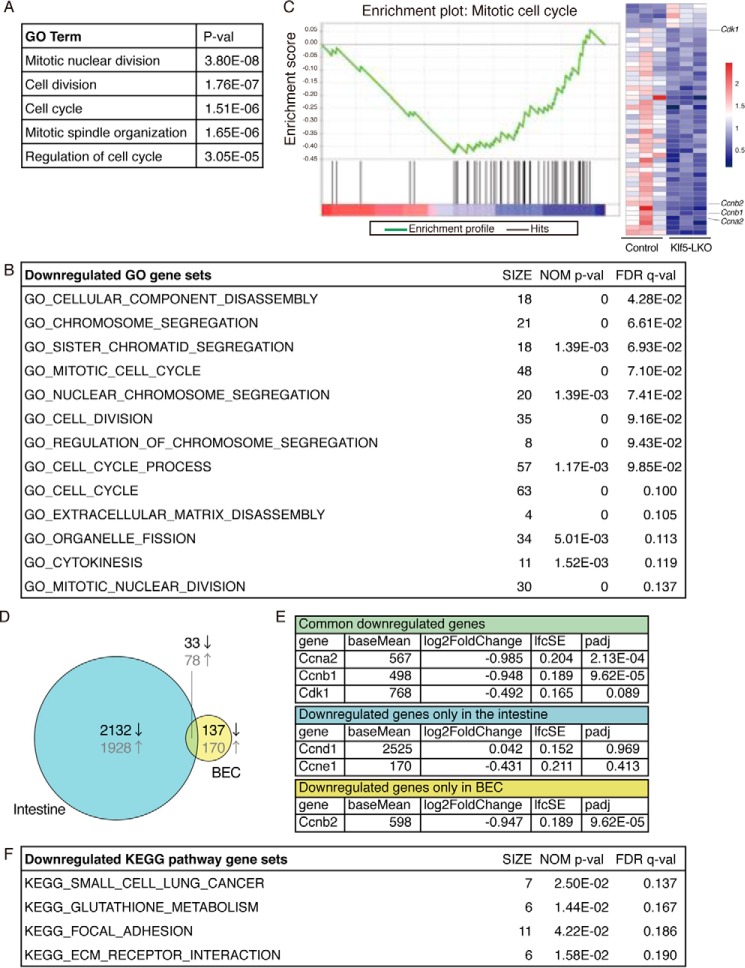
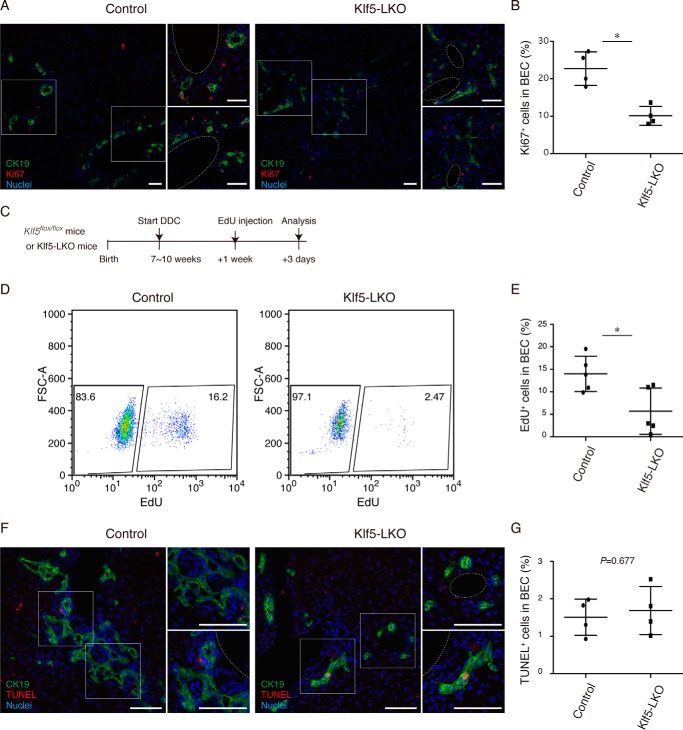
Under various conditions of liver injury, the intrahepatic biliary epithelium undergoes dynamic tissue expansion and remodeling, a process known as ductular reaction. Mouse models defective in inducing such a tissue-remodeling process are more susceptible to liver injury, suggesting a crucial role of this process in liver regeneration. However, the molecular mechanisms regulating the biliary epithelial cell (BEC) dynamics in the ductular reaction remain largely unclear. Here, we demonstrate that the transcription factor Krüppel-like factor 5 (Klf5) is highly enriched in mouse liver BECs and plays a key role in regulating the ductular reaction, specifically under cholestatic injury conditions. Although mice lacking Klf5 in the entire liver epithelium, including both hepatocytes and BECs (Klf5-LKO (liver epithelial-specific knockout) mice), did not exhibit any apparent phenotype in the hepatobiliary system under normal conditions, they exhibited significant defects in biliary epithelial tissue remodeling upon 3,5-diethoxycarbonyl-1,4-dihydrocollidine-induced cholangitis, concomitantly with exacerbated cholestasis and reduced survival rate. In contrast, mice lacking Klf5 solely in hepatocytes did not exhibit any such phenotypes, confirming Klf5's specific role in BECs. RNA-sequencing analyses of BECs isolated from the Klf5-LKO mouse livers revealed that the Klf5 deficiency primarily affected expression of cell cycle-related genes. Moreover, immunostaining analysis with the proliferation marker Ki67 disclosed that the Klf5-LKO mice had significantly reduced BEC proliferation levels upon injury. These results indicate that Klf5 plays a critical role in the ductular reaction and biliary epithelial tissue expansion and remodeling by inducing BEC proliferation and thereby contributing to liver regeneration.

Keywords: bile duct; bioinformatics; cell proliferation; ductular reaction (DR); epithelial cell; homeostasis; kruppel-like factor 5 (KLF5); liver injury; regeneration.


Conflict of interest statement

The authors declare that they have no conflicts of interest with the contents of this article

Figures

Figure 1.
Figure 1.
Expression pattern of Klf5 in the mouse liver. A, expression levels of Klf5 and Epcam in whole-liver mRNA samples prepared from WT mice were determined by quantitative RT-PCR. B, expression of Klf5 in liver cell fractions. Hepatocytes (Hep), EpCAM+ BEC fraction, and EpCAM NPC fractions were collected from livers of WT mice upon DDC administration for 3 weeks and analyzed by quantitative RT-PCR. C, immunostaining for Klf5 (red in the upper and center panels; gray scale in the lower panels) and CK19 (green) in the WT mouse liver. Counterstaining for nuclei is shown in blue (upper and center panels). Regions indicated by white boxes in the upper panels are magnified in the middle and lower panels. Dashed lines show portal veins. Scale bar, 50 μm. D, scheme for production of Klf5-LKO mice. F and R denote the positions of primers used for genomic PCR analyses shown in E and Fig. 4B. E, genomic PCR analysis for Cre-mediated recombination in the Klf5 locus. The upper and lower panels show amplicons corresponding to nonrecombined (floxed) and recombined (Cre-deleted) alleles, respectively. Lanes L1 and L2 were loaded with 100-bp ladder and 1-kb ladder DNA size markers, respectively. The sizes of markers (bp) are indicated to the left. F, loss of Klf5 expression in the Klf5-LKO mouse liver was confirmed at the protein level. Immunostaining results for Klf5 (red) and CK19 (green) are shown with counterstaining for nuclei (blue). Regions indicated by white boxes in the left panels are magnified in the right panels together with single color channel images. Dashed lines show portal veins. Scale bar, 50 μm.
Figure 2.
Figure 2.
DR induction upon DDC-induced liver injury is suppressed in Klf5-LKO mice. A, Kaplan-Meier survival curves of control (n = 49) and Klf5-LKO (n = 70) mice treated with DDC. B, serum ALP and T-BIL levels were measured in control and Klf5-LKO mice treated with DDC for 1 week (n = 5 mice) or 2 weeks (n = 6 mice). p values were calculated by Mann-Whitney U test. p values comparing the control and Klf5-LKO mice (DDC 2 weeks) are 0.00430 (ALP) and 0.0130 (T-BIL). C, immunostaining for CK19 (green) in the Klf5-LKO and control livers treated with DDC for 4 weeks shown with counterstaining for nuclei (blue). Scale bar, 100 μm. D, quantification of CK19+ areas in whole-liver sections. Data represent the mean ± S.D. n ≥ 4 mice for each time point. p values calculated by Mann-Whitney U test for each time point compare the control and Klf5-LKO mice and are as follows: 0.343 (DDC 0 week); 0.700 (DDC 1 week); 0.0207 (DDC 2 weeks); 0.0238 (DDC 3 weeks); and 0.0286 (DDC 4 weeks). E, immunostaining for EpCAM (green) and CK19 (red) in the Klf5-LKO and control livers treated with DDC for 4 weeks. Scale bar, 100 μm. F, 3D immunostaining for CK19 (green) in the Klf5-LKO and control livers treated with DDC for 4 weeks. Stacked images were obtained with confocal microscopy and used to reconstruct a 3D image using the IMARIS software. The image is shown in surface mode. Note that a CK19+ cell cluster separated from the biliary tree structure is observed in the Klf5-LKO liver (white arrow). Scale bar, 50 μm. Asterisks indicate that the p values are <0.05 (*, p < 0.06).
Figure 3.
Figure 3.
Loss of Klf5 affects DR induction specifically under cholestatic liver injury conditions. A, representative images of immunostaining for CK19 (green) in the Klf5-LKO and control livers treated with TAA for 8 weeks. Counterstaining for nuclei is also included (blue). Scale bar, 100 μm. B, quantification of CK19+ areas in whole-liver sections prepared from the TAA-treated mice as in A. n = 4 mice for each group. p values were calculated by Student's t test. C, representative images of immunostaining for CK19 (green) in the Abcb4 KO and Klf5-LKO double knockout and control (Abcb4 single knockout) livers at 8 weeks after birth. Counterstaining for nuclei is also shown (blue). Scale bar, 100 μm. D, quantification of CK19+ areas in whole-liver sections prepared from the Abcb4 KO cohorts as in C. n = 4 and 3 mice for the control (Abcb4 single knockout) and the Klf5-LKO (Abcb4 KO; Klf5-LKO double knockout) groups, respectively. p values were calculated by Student's t test. p values = 0.0209. E, 3D immunostaining for CK19 (green) in the Abcb4 KO and Klf5-LKO double knockout and control (Abcb4 single knockout) livers at 8 weeks after birth. Stacked images were obtained with confocal microscopy and used to reconstruct a 3D image using the IMARIS software. The image is shown in surface mode. White arrows indicate CK19+ cells separated from the biliary tree structure. Scale bar, 50 μm. Asterisks indicate that the p values are <0.05 (*, p < 0.06).
Figure 4.
Figure 4.
Deletion of Klf5 in hepatocytes does not affect DR induction. A, experimental scheme for analyses on the effect of hepatocyte-specific loss of Klf5. B, genomic PCR analysis for Cre-mediated recombination in the Klf5 locus using primers shown in Fig. 1D. The upper and lower panels show amplicons corresponding to nonrecombined (floxed) and recombined (Cre-deleted) alleles, respectively. Lanes L1 and L2 were loaded with 100-bp ladder and 1-kb ladder DNA size markers, respectively. The sizes of markers (bp) are indicated to the left. C, Kaplan-Meier survival curves of Klf5-HKO (n = 30) and AAV i.p. control (n = 27) mice treated with DDC. For comparison, the survival curves of Klf5-LKO and the control mice shown in Fig. 2A are also overlaid. D, immunostaining for CK19 (green) in the Klf5-HKO and control livers treated with DDC for 4 weeks shown with counterstaining for nuclei (blue). Scale bar, 100 μm. E, quantification of CK19+ areas in whole-liver sections prepared from Klf5-HKO and AAV i.p. control mice. For comparison, the data of Klf5-LKO and the control mice shown in Fig. 2D are also overlaid. Data represent mean ± S.D. n ≥ 3 mice for each time point. p values were calculated by Mann-Whitney U test for each time point comparing the Klf5-HKO and control mice and are as follows: 0.100 (DDC 0 week); 0.100 (DDC 1 week); 0.400 (DDC 2 weeks); 0.900 (DDC 3 weeks); and 0.857 (DDC 4 weeks).
Figure 5.
Figure 5.
Transcriptome analysis by RNA-seq reveals that Klf5 regulates cell proliferation in BECs. A, DEG were categorized in biological GO terms using DAVID. B and C, GSEA using DEG to identify enriched biological GO terms. B, entire list of enriched gene sets categorized in GO biological process terms that were down-regulated by Klf5 deletion in BECs. The SIZE column indicates the number of genes hit in each gene set. Gene sets that meet the criteria for both NOM p value of <0.05 and FDR q value of <0.25 are considered to be significantly enriched and are listed. C, representative enrichment plot, corresponding to the “GO_MITOTIC_CELL_CYCLE” set in B. The heat map shows expression levels of genes included in the gene set. The left three and right three columns correspond to BEC samples from the control and Klf5-LKO livers, respectively. The expression levels are indicated according to the scale bar at right. D, Venn diagram showing DEG identified in the intestine (left circle) and BECs (right circle) upon Klf5 deletion. Numbers shown in black and gray characters in the diagram indicate the counts of down-regulated and up-regulated genes, respectively. E, RNA-seq data for expression levels for cell cycle-related genes. Three categories correspond to those in the Venn diagram shown in D. F, entire list of enriched KEGG pathway gene sets. The SIZE column indicates the number of genes hit in each gene set. Gene sets that meet the criteria for both NOM p value <0.05 and FDR q value <0.25 are considered to be significantly enriched and are listed.
Figure 6.
Figure 6.
BEC proliferation upon DDC-induced liver injury is suppressed in Klf5-LKO mice. A, immunostaining for Ki67 (red) and CK19 (green) in the Klf5-LKO and control livers treated with DDC for 1 week shown with counterstaining for nuclei (blue). Two regions of interest indicated by white boxes in the left panels are magnified in the right panels. Scale bar, 50 μm. B, quantification of Ki67+ cells in the CK19+ BEC population. n = 4 mice. p value was calculated by Student's t test to be 0.00520. C, experimental scheme of in vivo EdU incorporation assays. D, flow cytometry analysis of EdU incorporation in BECs in Klf5-LKO and control mice upon DDC injury. Representative dot plots for the BEC population (EpCAM+ CD45 cell fraction) gated out from NPCs are shown. E, quantification of EdU+ cells in BECs as revealed by flow cytometry analyses. n = 5 mice. p value was calculated by Student's t test to be 0.0224. F, TUNEL staining (red) was performed to detect apoptotic cells with co-immunostaining for CK19 (green) in the Klf5-LKO and control livers treated with DDC for 2 weeks. Counterstaining for nuclei is also shown (blue). Scale bar, 50 μm. G, quantification of TUNEL+ cells in the CK19+ BEC population. n = 4 mice. p value calculated by Student's t test. Asterisks indicate that the p values are <0.05 (*, p < 0.06).

Similar articles

Cited by

References

    1. Michalopoulos G. K., and DeFrances M. C. (1997) Liver regeneration. Science 276, 60–66 10.1126/science.276.5309.60 - DOI - PubMed
    1. Michalopoulos G. K., and Khan Z. (2015) Liver stem cells: experimental findings and implications for human liver disease. Gastroenterology 149, 876–882 10.1053/j.gastro.2015.08.004 - DOI - PMC - PubMed
    1. Kaneko K., Kamimoto K., Miyajima A., and Itoh T. (2015) Adaptive remodeling of the biliary architecture underlies liver homeostasis. Hepatology 61, 2056–2066 10.1002/hep.27685 - DOI - PubMed
    1. Gouw A. S., Clouston A. D., and Theise N. D. (2011) Ductular reactions in human liver: diversity at the interface. Hepatology 54, 1853–1863 10.1002/hep.24613 - DOI - PubMed
    1. Duncan A. W., Dorrell C., and Grompe M. (2009) Stem cells and liver regeneration. Gastroenterology 137, 466–481 10.1053/j.gastro.2009.05.044 - DOI - PMC - PubMed

Publication types

MeSH terms

Substances