

Reduced Arogenate Dehydratase Expression: Ramifications for Photosynthesis and Metabolism
- PMID: 29523714
- PMCID: PMC5933128
- DOI: 10.1104/pp.17.01766
Reduced Arogenate Dehydratase Expression: Ramifications for Photosynthesis and Metabolism
Abstract
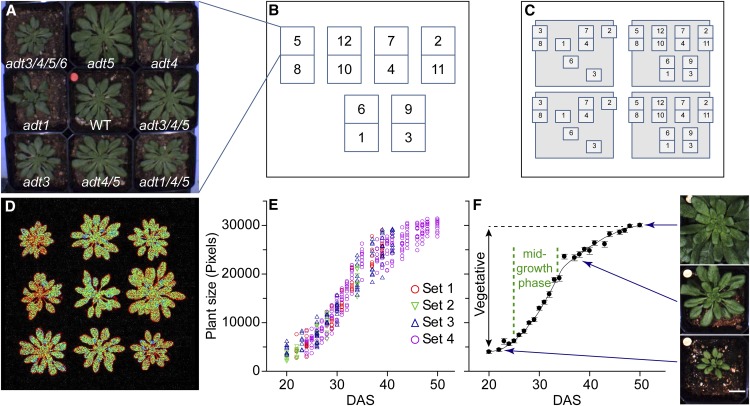
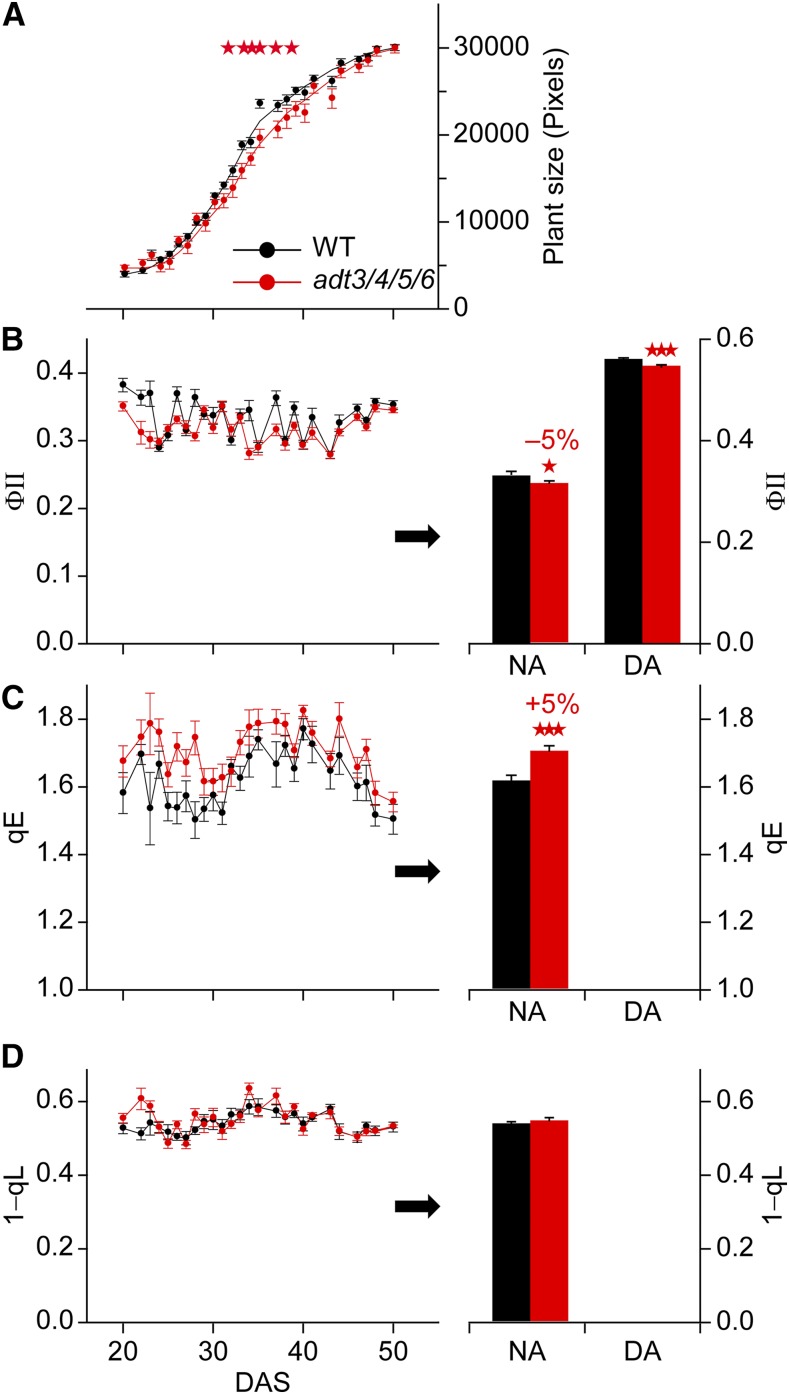
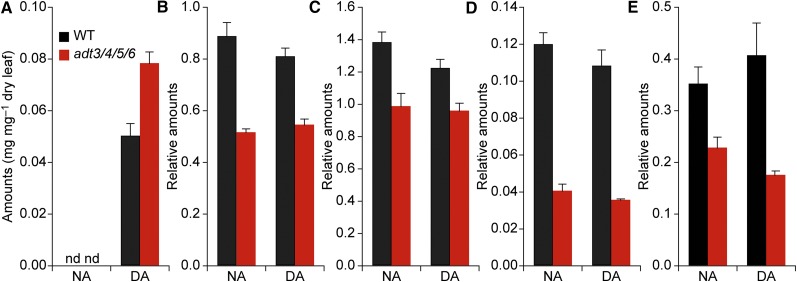
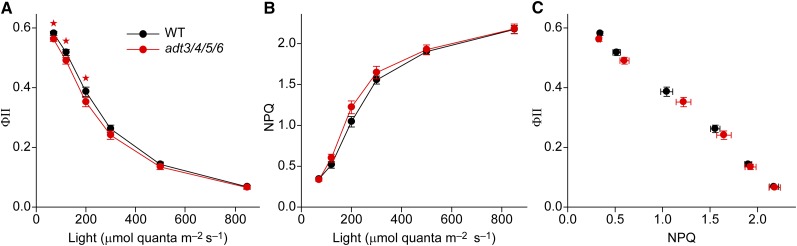
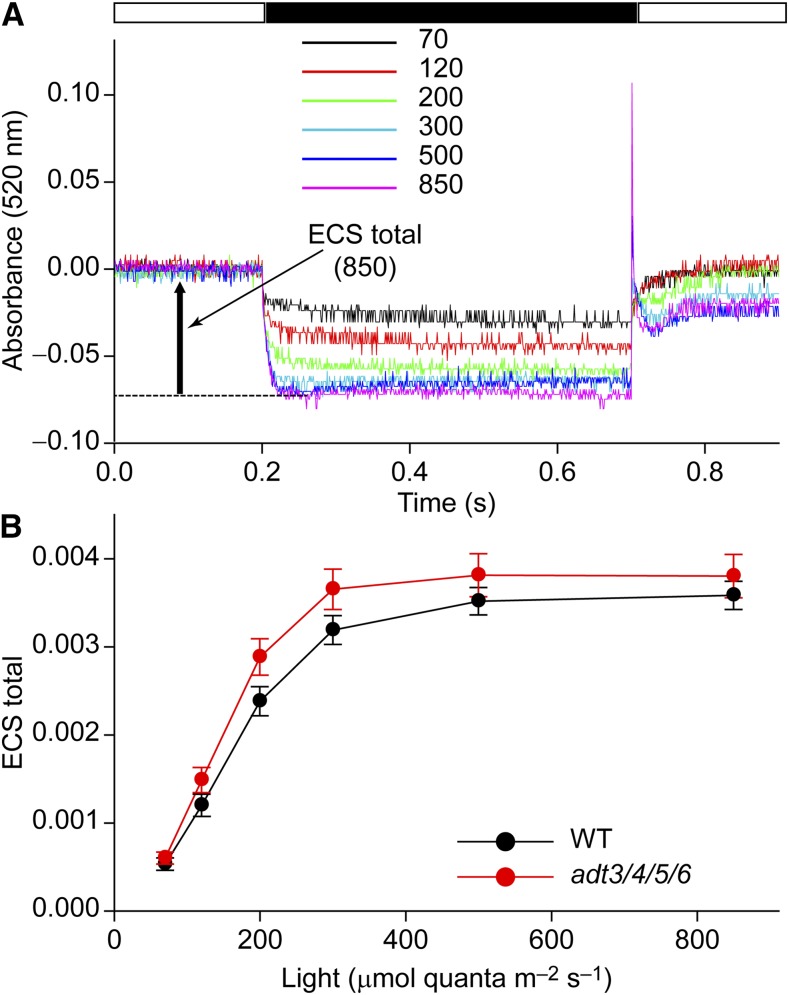
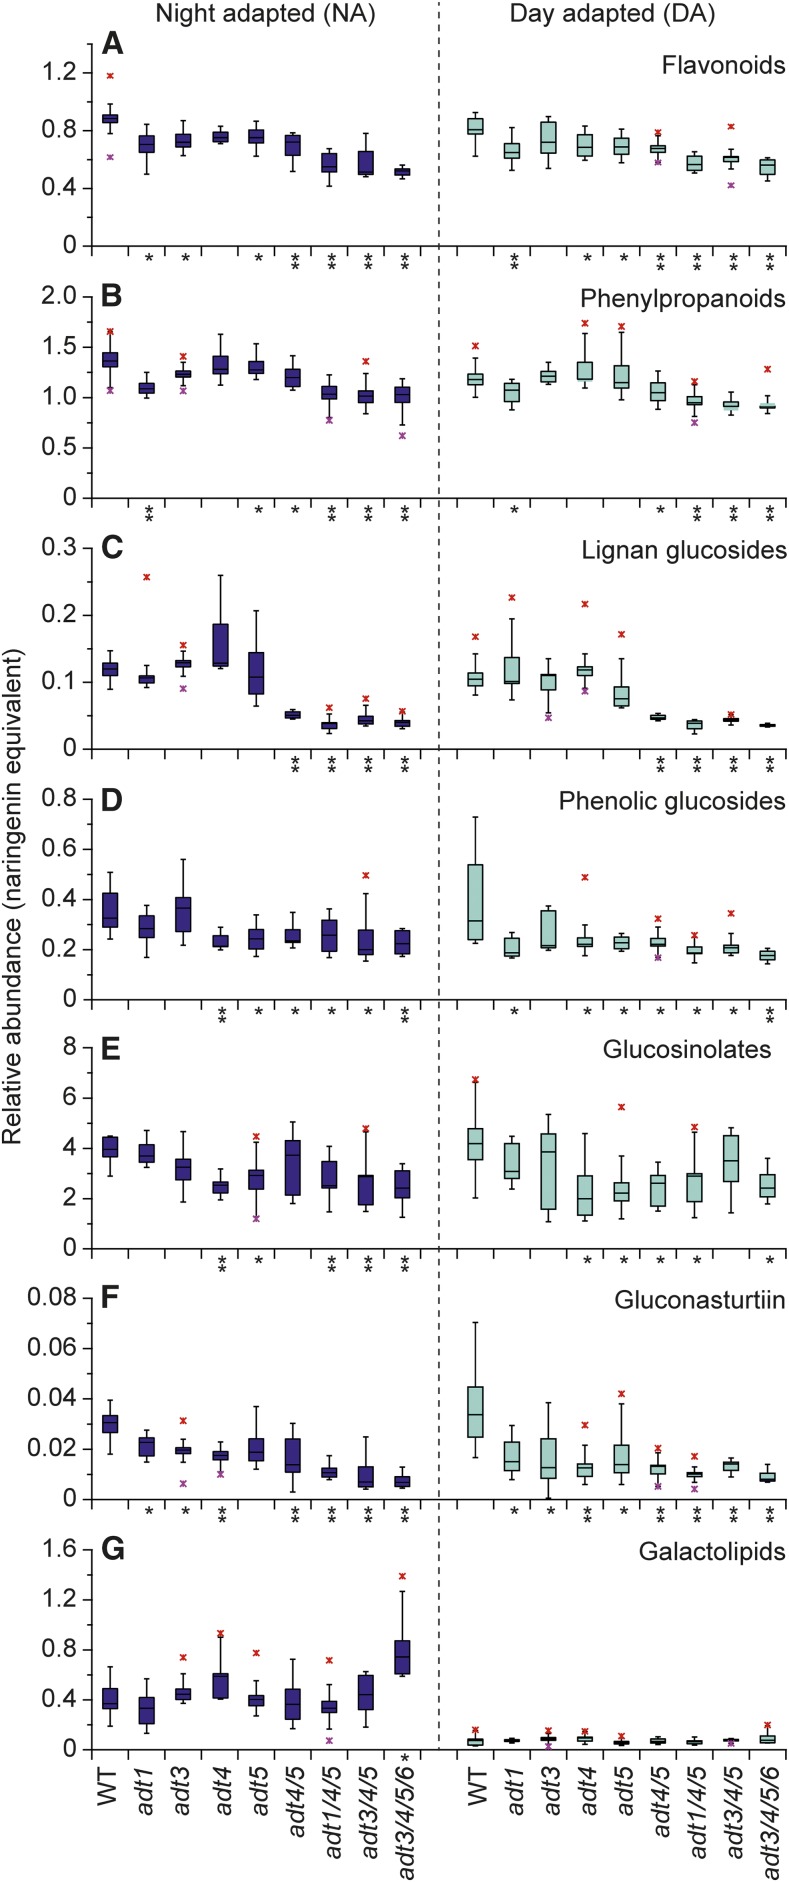
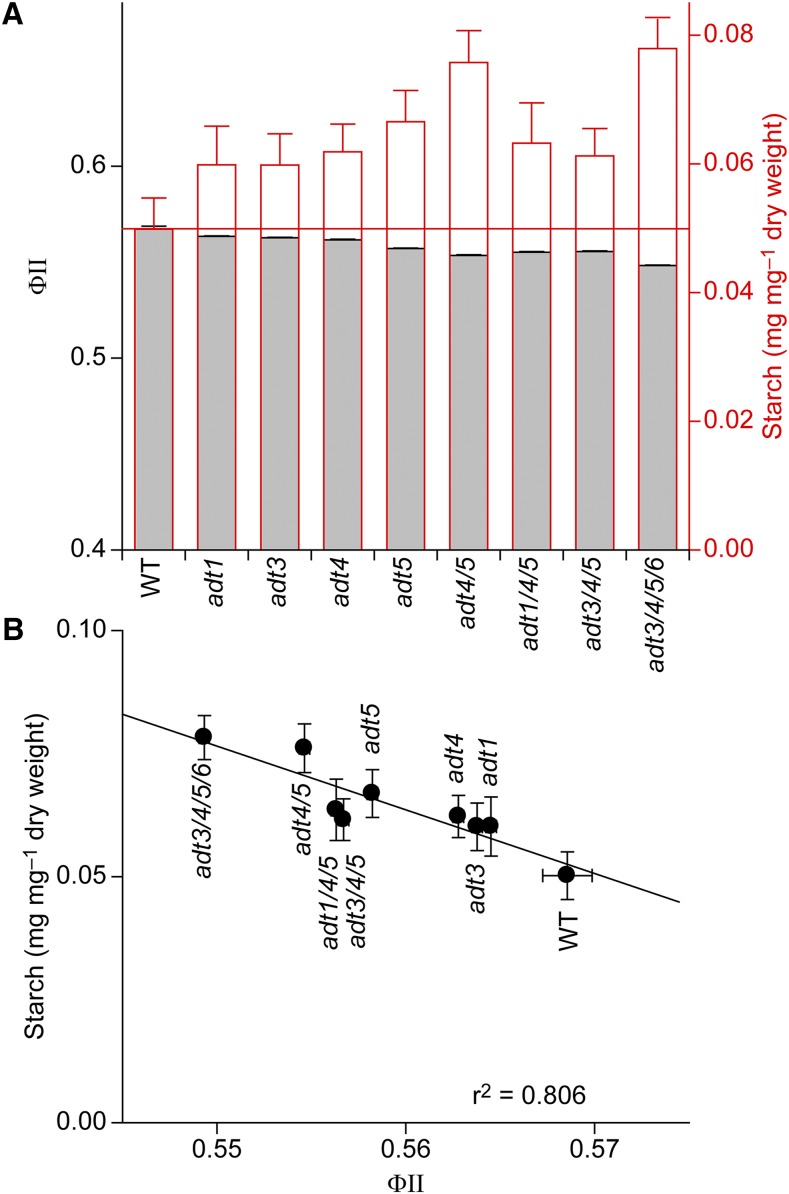
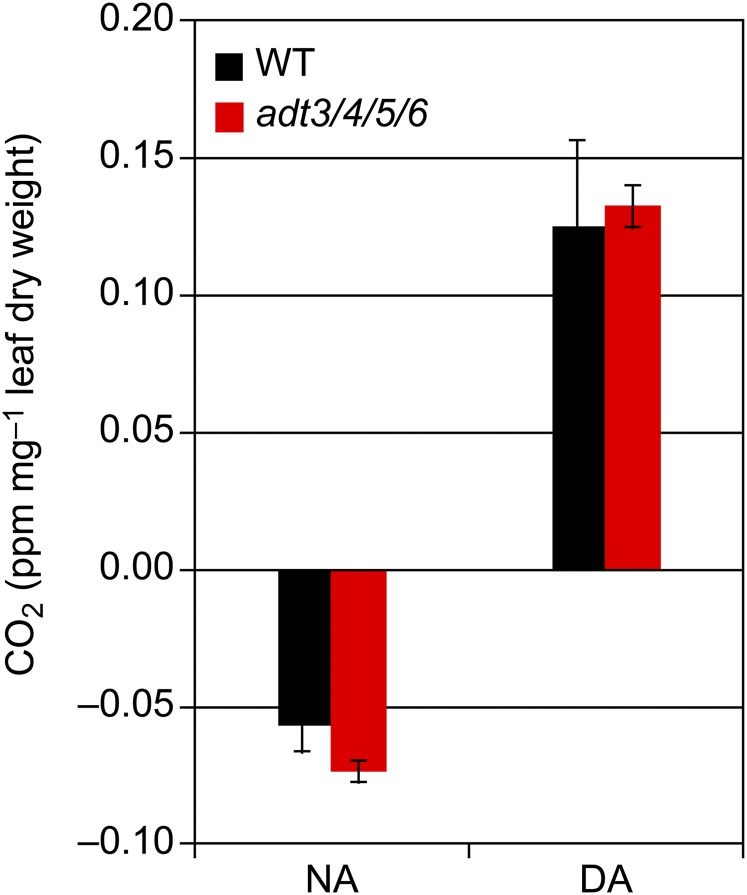
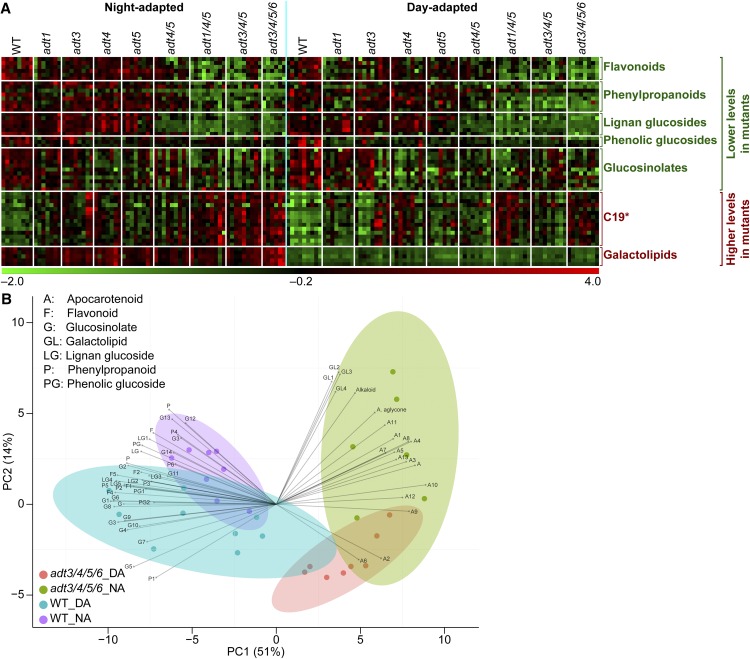
Arogenate dehydratase (ADT) catalyzes the final step of phenylalanine (Phe) biosynthesis. Previous work showed that ADT-deficient Arabidopsis (Arabidopsis thaliana) mutants had significantly reduced lignin contents, with stronger reductions in lines that had deficiencies in more ADT isoforms. Here, by analyzing Arabidopsis ADT mutants using our phenomics facility and ultra-performance liquid chromatography-mass spectrometry-based metabolomics, we describe the effects of the modulation of ADT on photosynthetic parameters and secondary metabolism. Our data indicate that a reduced carbon flux into Phe biosynthesis in ADT mutants impairs the consumption of photosynthetically produced ATP, leading to an increased ATP/ADP ratio, the overaccumulation of transitory starch, and lower electron transport rates. The effect on electron transport rates is caused by an increase in proton motive force across the thylakoid membrane that down-regulates photosystem II activity by the high-energy quenching mechanism. Furthermore, quantitation of secondary metabolites in ADT mutants revealed reduced flavonoid, phenylpropanoid, lignan, and glucosinolate contents, including glucosinolates that are not derived from aromatic amino acids, and significantly increased contents of putative galactolipids and apocarotenoids. Additionally, we used real-time atmospheric monitoring mass spectrometry to compare respiration and carbon fixation rates between the wild type and adt3/4/5/6, our most extreme ADT knockout mutant, which revealed no significant difference in both night- and day-adapted plants. Overall, these data reveal the profound effects of altered ADT activity and Phe metabolism on secondary metabolites and photosynthesis with implications for plant improvement.
© 2018 American Society of Plant Biologists. All Rights Reserved.
Figures
Similar articles
-
Arogenate Dehydratase Isoforms Differentially Regulate Anthocyanin Biosynthesis in Arabidopsis thaliana.Mol Plant. 2016 Dec 5;9(12):1609-1619. doi: 10.1016/j.molp.2016.09.010. Epub 2016 Oct 5. Mol Plant. 2016. PMID: 27720844
-
The arogenate dehydratase gene family: towards understanding differential regulation of carbon flux through phenylalanine into primary versus secondary metabolic pathways.Phytochemistry. 2012 Oct;82:22-37. doi: 10.1016/j.phytochem.2012.05.026. Epub 2012 Jul 18. Phytochemistry. 2012. PMID: 22818526
-
Arogenate dehydratase isoenzymes profoundly and differentially modulate carbon flux into lignins.J Biol Chem. 2012 Mar 30;287(14):11446-59. doi: 10.1074/jbc.M111.322164. Epub 2012 Feb 6. J Biol Chem. 2012. PMID: 22311980 Free PMC article.
-
Phenylalanine roles in the seed-to-seedling stage: Not just an amino acid.Plant Sci. 2019 Dec;289:110223. doi: 10.1016/j.plantsci.2019.110223. Epub 2019 Aug 20. Plant Sci. 2019. PMID: 31623788 Review.
-
Biosynthesis and Metabolic Fate of Phenylalanine in Conifers.Front Plant Sci. 2016 Jul 13;7:1030. doi: 10.3389/fpls.2016.01030. eCollection 2016. Front Plant Sci. 2016. PMID: 27468292 Free PMC article. Review.
Cited by
-
Regulation of color transition in purple tea (Camellia sinensis).Planta. 2019 Dec 18;251(1):35. doi: 10.1007/s00425-019-03328-7. Planta. 2019. PMID: 31853722
-
Carotenoid dark state to chlorophyll energy transfer in isolated light-harvesting complexes CP24 and CP29.Photosynth Res. 2020 Jan;143(1):19-30. doi: 10.1007/s11120-019-00676-z. Epub 2019 Oct 28. Photosynth Res. 2020. PMID: 31659623
-
The Phytotoxicity of Meta-Tyrosine Is Associated With Altered Phenylalanine Metabolism and Misincorporation of This Non-Proteinogenic Phe-Analog to the Plant's Proteome.Front Plant Sci. 2020 Mar 6;11:140. doi: 10.3389/fpls.2020.00140. eCollection 2020. Front Plant Sci. 2020. PMID: 32210982 Free PMC article.
-
New Insights Into Lignification via Network and Multi-Omics Analyses of Arogenate Dehydratase Knock-Out Mutants in Arabidopsis thaliana.Front Plant Sci. 2021 May 25;12:664250. doi: 10.3389/fpls.2021.664250. eCollection 2021. Front Plant Sci. 2021. PMID: 34113365 Free PMC article.
-
GhADT5 enhances alkali stress tolerance in cotton by regulating phenylalanine-derived flavonoid biosynthesis and antioxidant defense.BMC Plant Biol. 2025 Feb 19;25(1):225. doi: 10.1186/s12870-025-06204-7. BMC Plant Biol. 2025. PMID: 39972250 Free PMC article.
References
-
- Araus JL, Cairns JE (2014) Field high-throughput phenotyping: the new crop breeding frontier. Trends Plant Sci 19: 52–61 - PubMed
-
- Bailleul B, Cardol P, Breyton C, Finazzi G (2010) Electrochromism: a useful probe to study algal photosynthesis. Photosynth Res 106: 179–189 - PubMed
-
- Baker NR. (2008) Chlorophyll fluorescence: a probe of photosynthesis in vivo. Annu Rev Plant Biol 59: 89–113 - PubMed
-
- Brooks MD, Niyogi KK (2011) Use of a pulse-amplitude modulated chlorophyll fluorometer to study the efficiency of photosynthesis in Arabidopsis plants. Methods Mol Biol 775: 299–310 - PubMed
Publication types
MeSH terms
Substances
Grants and funding
LinkOut - more resources
Full Text Sources
Other Literature Sources
Molecular Biology Databases
