. 2018 May;177(1):151-167.
doi: 10.1104/pp.18.00263. Epub 2018 Mar 9.

Exploiting CELLULOSE SYNTHASE (CESA) Class Specificity to Probe Cellulose Microfibril Biosynthesis

Affiliations

Exploiting CELLULOSE SYNTHASE (CESA) Class Specificity to Probe Cellulose Microfibril Biosynthesis

Manoj Kumar et al. Plant Physiol. 2018 May.

Abstract

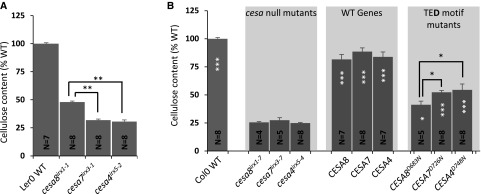
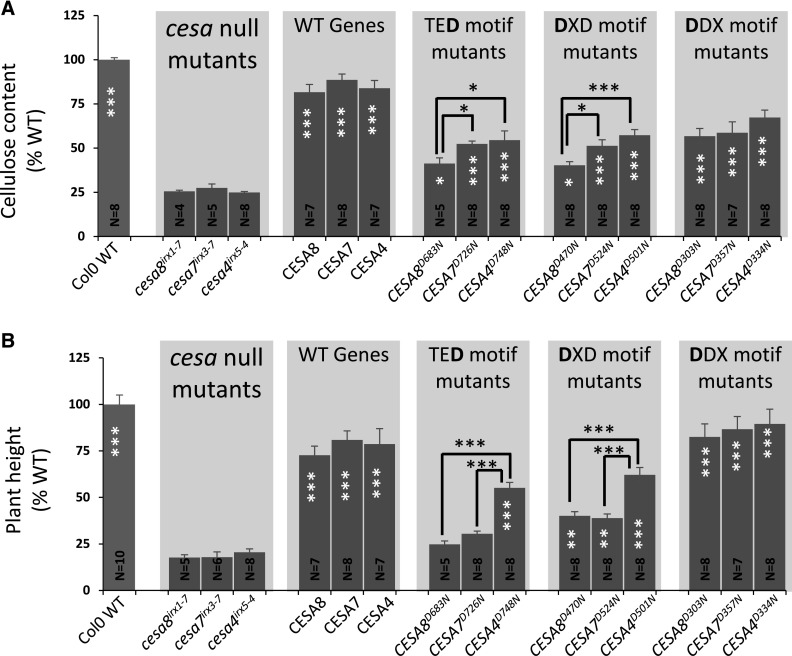
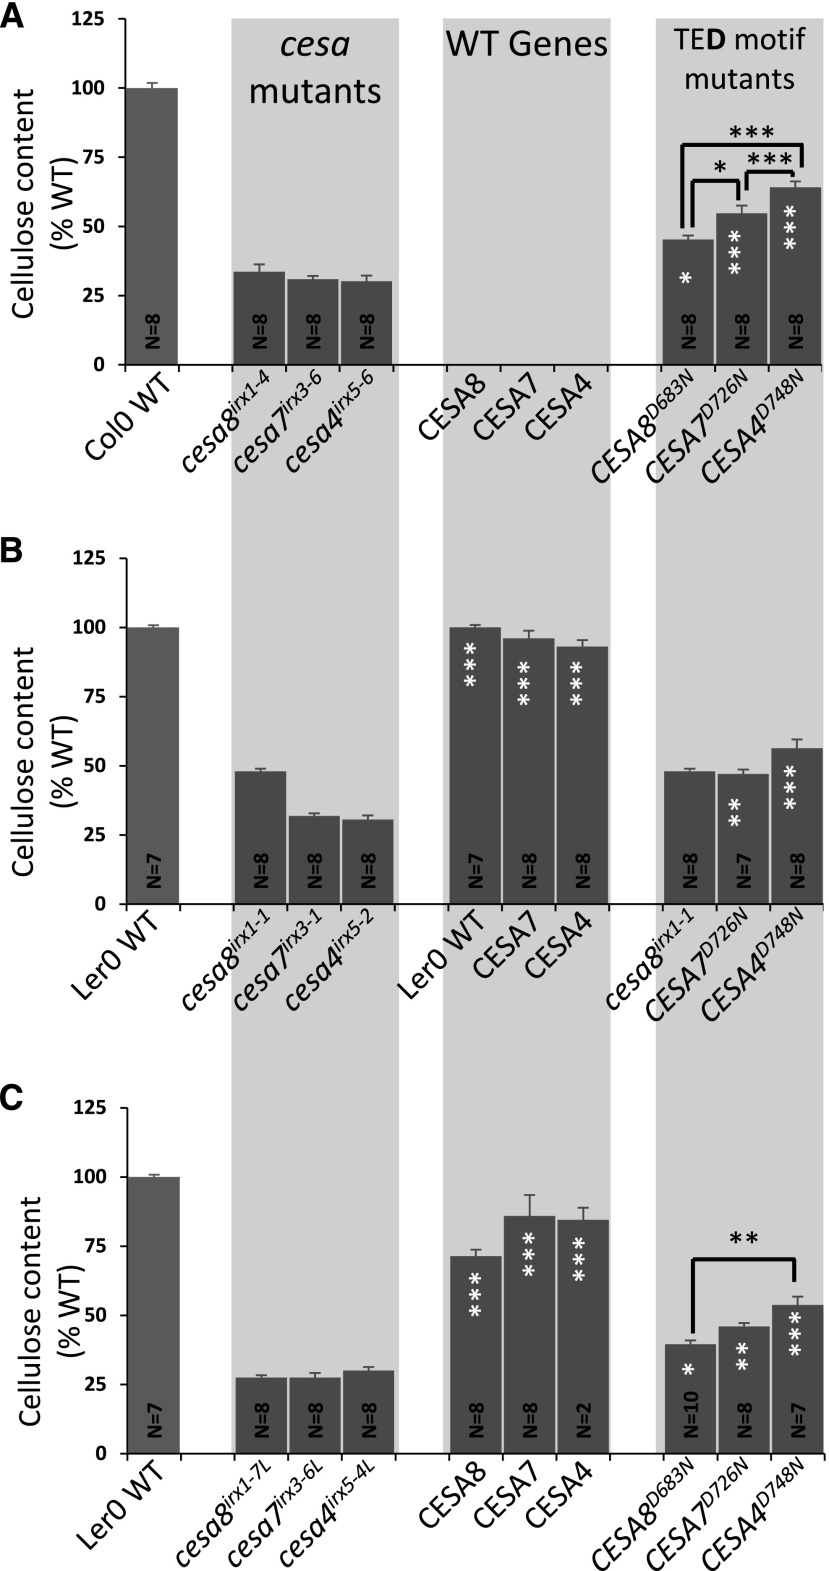
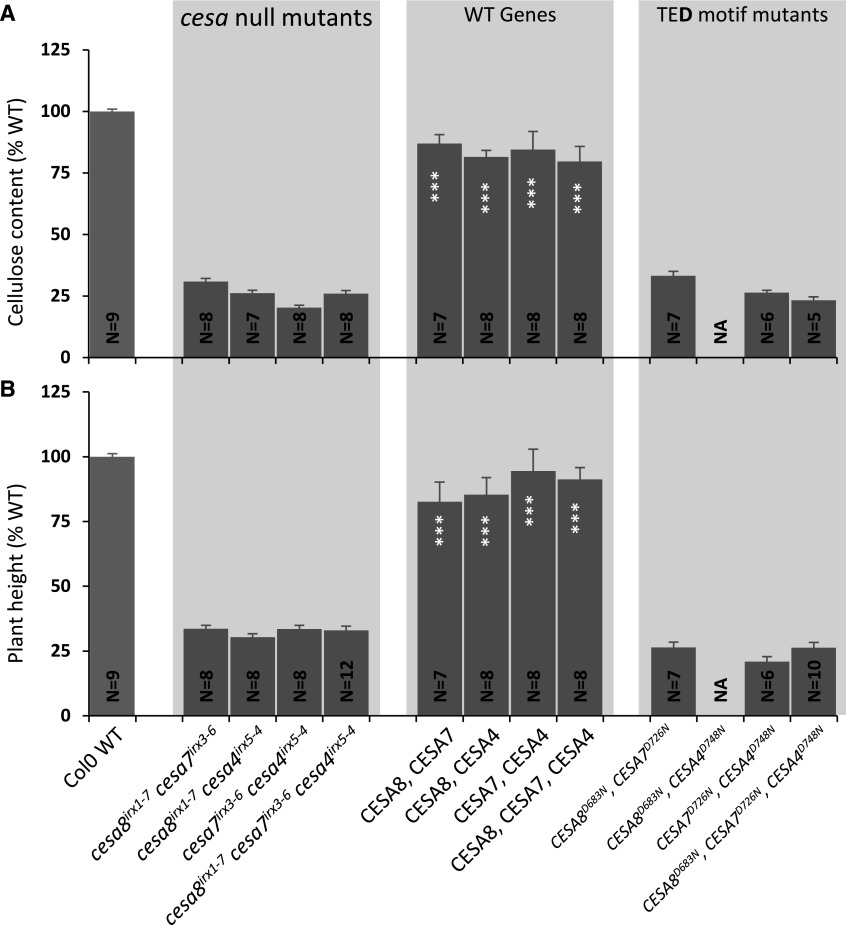
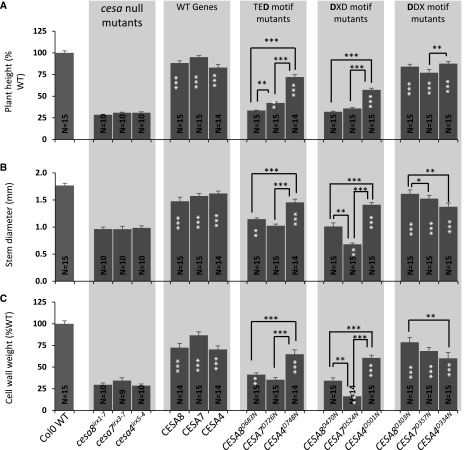
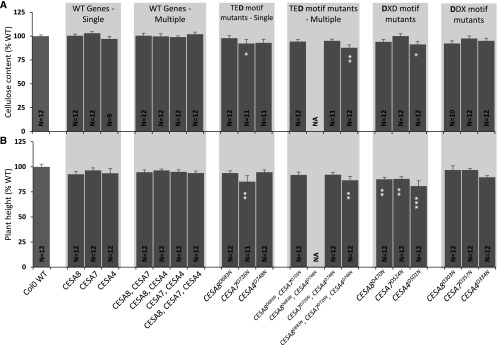
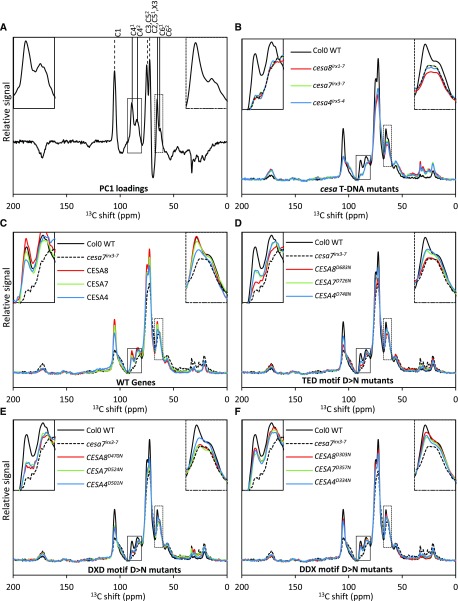
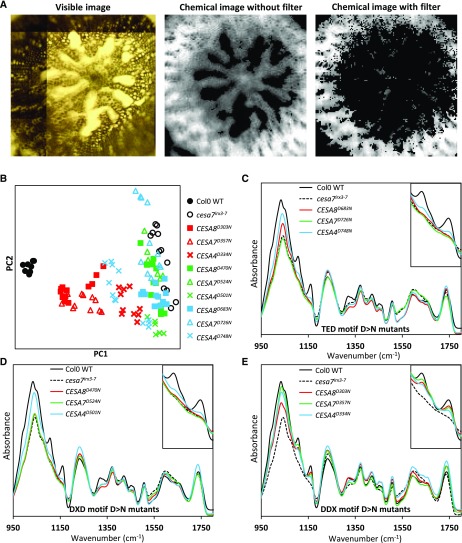
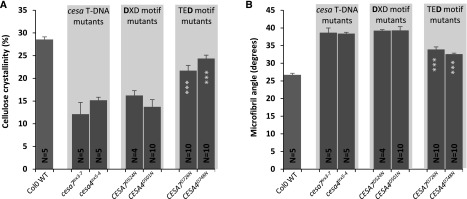
Cellulose microfibrils are the basic units of cellulose in plants. The structure of these microfibrils is at least partly determined by the structure of the cellulose synthase complex. In higher plants, this complex is composed of 18 to 24 catalytic subunits known as CELLULOSE SYNTHASE A (CESA) proteins. Three different classes of CESA proteins are required for cellulose synthesis and for secondary cell wall cellulose biosynthesis these classes are represented by CESA4, CESA7, and CESA8. To probe the relationship between CESA proteins and microfibril structure, we created mutant cesa proteins that lack catalytic activity but retain sufficient structural integrity to allow assembly of the cellulose synthase complex. Using a series of Arabidopsis (Arabidopsis thaliana) mutants and genetic backgrounds, we found consistent differences in the ability of these mutant cesa proteins to complement the cellulose-deficient phenotype of the cesa null mutants. The best complementation was observed with catalytically inactive cesa4, while the equivalent mutation in cesa8 exhibited significantly lower levels of complementation. Using a variety of biophysical techniques, including solid-state nuclear magnetic resonance and Fourier transform infrared microscopy, to study these mutant plants, we found evidence for changes in cellulose microfibril structure, but these changes largely correlated with cellulose content and reflected differences in the relative proportions of primary and secondary cell walls. Our results suggest that individual CESA classes have similar roles in determining cellulose microfibril structure, and it is likely that the different effects of mutating members of different CESA classes are the consequence of their different catalytic activity and their influence on the overall rate of cellulose synthesis.


Figures

Figure 1.
Figure 1.
Cellulose content of the plants with point mutations in the secondary wall CESA genes. A, Data for three cesa mutants, cesa8irx1-1 (D683N), cesa7irx3-1 (W859STOP), and cesa4irx5-2 (W995STOP). B, Secondary wall CESA T-DNA null mutants (cesa8irx1-7, cesa7irx3-7, and cesa4irx5-4) were transformed with wild-type (WT) genes (CESA8, CESA7, and CESA4, respectively) or TED motif Asp-to-Asn mutants (CESA8D683N, CESA7D726N, and CESA4D748N, respectively). Measurements were taken from single plants at the T1 stage. N refers to the number of individual transformants analyzed. Cellulose content is expressed as a percentage of the wild-type value. Error bars indicate se. Significance levels from univariate ANOVA are indicated for comparison between the genotype and the background mutant (white asterisks inside each bar) or between particular genotypes (black asterisks and lines above the bars): ***, significant at 0.001; **, significant at 0.01; and *, significant at 0.05.
Figure 2.
Figure 2.
Cellulose content of the plants containing Asp-to-Asn mutation in the TED, DXD, and DDX motifs of secondary wall CESAs. A, Cellulose content. B, Plant height. CESA T-DNA null mutants (cesa8irx1-7, cesa7irx3-7, and cesa4irx5-4) were transformed with wild-type (WT) genes (CESA8, CESA7, and CESA4, respectively), TED motif Asp-to-Asn mutants (CESA8D683N, CESA7D726N, and CESA4D748N, respectively), DXD motif Asp-to-Asn mutants (CESA8D470N, CESA7D524N, and CESA4D501N, respectively), or DDX motif Asp-to-Asn mutants (CESA8D303N, CESA7D357N, and CESA4D334N, respectively). N refers to the number of individual T1 transformants analyzed. Cellulose content and plant height are expressed as percentages of the wild-type values. The cellulose data for the TED motif are the same as in Figure 1B. Error bars indicate se. Significance levels from univariate ANOVA are indicated for comparison between the genotype and the background mutant (white asterisks inside each bar) or between particular genotypes (black asterisks and lines above the bars): ***, significant at 0.001; **, significant at 0.01; and *, significant at 0.05.
Figure 3.
Figure 3.
Cellulose content of the plants containing an Asp-to-Asn mutation in the TED motif of secondary wall CESAs in alternative cesa backgrounds. A, Secondary wall CESA T-DNA null mutants (cesa8irx1-4, cesa7irx3-6, and cesa4irx5-6) were transformed with TED Asp-to-Asn mutants (CESA8D683N, CESA7D726N, and CESA4D748N, respectively). Transformation of wild-type (WT) genes was not performed for this set of mutants. B, cesa7irx3-1 and cesa4irx5-2 were transformed with either the wild-type genes (CESA7 and CESA4, respectively) or TED Asp-to-Asn mutants (CESA7D726N and CESA4D748N, respectively) and compared with the cesa8irx1-1 mutant. For CESA8, Ler wild-type measurements have been duplicated in the middle graph in order to make easy comparisons. C, cesa8irx1-7, cesa7irx3-6, and cesa4irx5-4 were backcrossed into Ler five times to create cesa8irx1-7L, cesa7irx3-6L, and cesa4irx5-4L, respectively. These were then transformed with either the wild-type genes (CESA8, CESA7, and CESA4, respectively) or TED Asp-to-Asn mutants (CESA8D683N, CESA7D726N, and CESA4D748N, respectively). N refers to the number of individual T1 transformants analyzed. Cellulose content is expressed as a percentage of the wild-type value. Error bars indicate se. Significance levels from univariate ANOVA are indicated for comparison between the genotype and the background mutant (white asterisks inside each bar) or between particular genotypes (black asterisks and lines above the bars): ***, significant at 0.001; **, significant at 0.01; and *, significant at 0.05.
Figure 4.
Figure 4.
Analysis of the plants containing TED motif Asp-to-Asn mutations in multiple secondary wall CESAs. A, Cellulose content. B, Plant height. Data are shown for all possible double (cesa8irx1-7 cesa7irx3-6, cesa8irx1-7 cesa4irx5-4, and cesa7irx3-6 cesa4irx5-4) and triple (cesa8irx1-7 cesa7irx3-6 cesa4irx5-4) mutant combinations of secondary wall CESAs transformed with plasmids containing the corresponding wild-type (WT) CESA genes or the TED motif Asp-to-Asn mutants. N refers to the number of individual T1 transformants analyzed. Cellulose content and plant height are expressed as percentages of the wild-type values. The cellulose data for the TED motif are the same as in Figure 1B. Error bars indicate se. Significance levels from univariate ANOVA are indicated for comparison between the genotype and the background mutant (white asterisks inside each bar): ***, significant at 0.001. NA indicates no data available.
Figure 5.
Figure 5.
Growth characteristics of the plants containing an Asp-to-Asn mutation in the TED, DXD, and DDX motifs. A, Plant height. B, Stem diameter. C, Weight of the cell wall preparation. Error bars indicate se. N refers to the number of T2 plants analyzed. For each genotype, up to 15 plants (five plants each for three selected lines) were analyzed. Significance levels from univariate ANOVA are indicated for comparison between the genotype and the background mutant (white asterisks inside each bar) or between particular genotypes (black asterisks and lines above the bars): ***, significant at 0.001; **, significant at 0.01; and *, significant at 0.05. WT, Wild type.
Figure 6.
Figure 6.
Analysis of all constructs used in this study in the Col-0 wild-type (WT) background. A, Cellulose content. B, Plant height. Data are shown for Col-0 transformed with wild-type CESA genes, single, double, and triple mutant combinations of CESA genes carrying the TED Asp mutants, and single CESA genes containing the DXD or DDX Asp mutants. N refers to the number of individual T1 transformants analyzed. Cellulose content and plant height are expressed as percentages of the wild-type values. The cellulose data for the TED motif are the same as in Figure 1B. Error bars indicate se. Significance levels from univariate ANOVA are indicated for comparison between the genotype and the background mutant (white asterisks inside each bar): ***, significant at 0.001; **, significant at 0.01; and *, significant at 0.05. NA indicates no data available.
Figure 7.
Figure 7.
NMR analysis of the plants containing an Asp-to-Asn mutation in the DDX, DXD, and TED motifs of secondary wall CESAs. A, Loadings for PC1 of the PCA that accounts for 89% data variability. B to F, ssNMR data for 16 genotypes. For each genotype, stem powder from up to 36 T2 plants (one selected line) was analyzed. Each graph shows the total signal-normalized individual spectra for the five groups of genotypes. Col-0 wild-type (WT) and cesa7irx3-7 data are repeated in C to F for comparison. The positions of cellulose peaks are indicated by vertical lines above the peaks in A. In each graph, the inset at top left shows the C4 peak region (80–93 ppm), while the inset at top right shows the C6 peak region (60–67 ppm).
Figure 8.
Figure 8.
FTIR microspectroscopy analysis of the plants containing an Asp-to-Asn mutation in the DDX, DXD, and TED motifs of secondary wall CESAs. A, Visible image as seen with the FTIR microscope and chemical images based on signal intensity at 1,035 cm−1. The filtered chemical image was obtained after removing pixels that had 1,109 cm−1 signal intensity less than the mean 1,109 cm−1 intensity of all pixels in the image. B, PCA based on the filtered data set. Groups of genotypes are color coded: black, control genotypes; red, DDX motif mutants; green, DXD motif mutants; and blue, TED motif mutants. Each data point refers to an FTIR tile. For each genotype, up to 12 tiles were generated from T2 generation plants (three independent lines, one hypocotyl per line, four sections per hypocotyl, and one tile per section). C to E, Normalized mean (of all tiles for a genotype) spectra for the three groups of genotypes. Col-0 wild-type (WT) and cesa7irx3-7 data are included in all graphs for comparison. In each graph, the inset at top right shows the 1,085 to 1,185 cm−1 peaks associated with cellulose.
Figure 9.
Figure 9.
Physical properties of the plants containing an Asp-to-Asn mutation in the DXD and TED motifs of secondary wall CESAs. A, Cellulose crystallinity. B, Microfibril angle. Error bars indicate se. N refers to the number of T2 plants analyzed. For each genotype, up to 10 plants (five plants each for two selected lines) were analyzed. Significance levels from univariate ANOVA are indicated for comparison between the genotype and the background mutant (white asterisks inside each bar): ***, significant at 0.001. WT, Wild type.

Similar articles

Cited by

References

    1. Atalla RH, Vanderhart DL (1984) Native cellulose: a composite of two distinct crystalline forms. Science 223: 283–285 - PubMed
    1. Atanassov II, Atanassov II, Etchells JP, Turner SR (2009) A simple, flexible and efficient PCR-fusion/Gateway cloning procedure for gene fusion, site-directed mutagenesis, short sequence insertion and domain deletions and swaps. Plant Methods 5: 14. - PMC - PubMed
    1. Blakeney AB, Harris PJ, Henry RJ, Stone BA (1983) A simple and rapid preparation of alditol acetates for monosaccharide analysis. Carbohydr Res 113: 291–299
    1. Brown DM, Zeef LAH, Ellis J, Goodacre R, Turner SR (2005) Identification of novel genes in Arabidopsis involved in secondary cell wall formation using expression profiling and reverse genetics. Plant Cell 17: 2281–2295 - PMC - PubMed
    1. Burton RA, Gidley MJ, Fincher GB (2010) Heterogeneity in the chemistry, structure and function of plant cell walls. Nat Chem Biol 6: 724–732 - PubMed

Publication types

MeSH terms

LinkOut - more resources