Molecular Response to Neoadjuvant Chemotherapy in High-Grade Serous Ovarian Carcinoma
- PMID: 29523763
- PMCID: PMC6497146
- DOI: 10.1158/1541-7786.MCR-17-0594
Molecular Response to Neoadjuvant Chemotherapy in High-Grade Serous Ovarian Carcinoma
Abstract
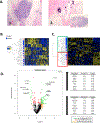
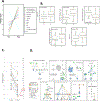
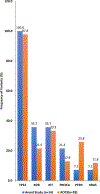
While high-grade serous ovarian carcinoma (HGSOC) is the most common histologic subtype of ovarian cancer, significant tumor heterogeneity exists. In addition, chemotherapy induces changes in gene expression and alters the mutational profile. To evaluate the notion that patients with HGSOC could be better classified for optimal treatment based on gene expression, we compared genetic variants [by DNA next-generation sequencing (NGS) using a 50 gene Ion Torrent panel] and gene expression (using the NanoString PanCancer 770 gene Panel) in the tumor from 20 patients with HGSOC before and after neoadjuvant chemotherapy (NACT). NGS was performed on plasma cell free DNA (cfDNA) on a select group of patients (n = 14) to assess the utility of using cfDNA to monitor these changes. A total of 86 genes had significant changes in RNA expression after NACT. Thirty-eight genetic variants (including SNPs) from 6 genes were identified in tumors pre-NACT, while 59 variants from 19 genes were detected in the cfDNA. The number of DNA variants were similar after NACT. Of the 59 variants in the plasma pre-NACT, only 6 persisted, whereas 33 of 38 specific variants in the tumor DNA remained unchanged. Pathway analysis showed the most significant alterations in the cell cycle and DNA damage pathways.Implications: Gene expression profiles at the time of interval debulking provide additional genetic information that could help impact treatment decisions after NACT; although, continued collection and analysis of matched tumor and cfDNA from multiple time points are needed to determine the role of cfDNA in the management of HGSOC. Mol Cancer Res; 16(5); 813-24. ©2018 AACR.
©2018 American Association for Cancer Research.
Conflict of interest statement
The authors declare no potential conflicts of interest.
Figures


Similar articles
-
Neoadjuvant chemotherapy induces phenotypic mast cell changes in high grade serous ovarian cancer.J Ovarian Res. 2024 Sep 28;17(1):192. doi: 10.1186/s13048-024-01516-y. J Ovarian Res. 2024. PMID: 39342316 Free PMC article.
-
Clonal Evolution of TP53 c.375+1G>A Mutation in Pre- and Post- Neo-Adjuvant Chemotherapy (NACT) Tumor Samples in High-Grade Serous Ovarian Cancer (HGSOC).Cells. 2019 Oct 1;8(10):1186. doi: 10.3390/cells8101186. Cells. 2019. PMID: 31581548 Free PMC article.
-
Identification of high-grade serous ovarian cancer miRNA species associated with survival and drug response in patients receiving neoadjuvant chemotherapy: a retrospective longitudinal analysis using matched tumor biopsies.Ann Oncol. 2016 Apr;27(4):625-34. doi: 10.1093/annonc/mdw007. Epub 2016 Jan 17. Ann Oncol. 2016. PMID: 26782955
-
Genomic Characterization of High-Grade Serous Ovarian Cancer: Dissecting Its Molecular Heterogeneity as a Road Towards Effective Therapeutic Strategies.Curr Oncol Rep. 2016 Jul;18(7):44. doi: 10.1007/s11912-016-0526-9. Curr Oncol Rep. 2016. PMID: 27241520 Review.
-
Low Grade Serous Ovarian Carcinoma: from the molecular characterization to the best therapeutic strategy.Cancer Treat Rev. 2015 Feb;41(2):136-43. doi: 10.1016/j.ctrv.2014.12.003. Epub 2014 Dec 23. Cancer Treat Rev. 2015. PMID: 25573350 Review.
Cited by
-
Biological Insights into Chemotherapy Resistance in Ovarian Cancer.Int J Mol Sci. 2019 Apr 30;20(9):2131. doi: 10.3390/ijms20092131. Int J Mol Sci. 2019. PMID: 31052165 Free PMC article.
-
Multi-omic Characterization of Pre- and Post-neoadjuvant Chemotherapy Treated Ovarian Cancer Reveals Mediators of Tumorigenesis and Chemotherapy Response.Cancer Res. 2025 Jul 22:10.1158/0008-5472.CAN-24-3804. doi: 10.1158/0008-5472.CAN-24-3804. Online ahead of print. Cancer Res. 2025. PMID: 40693832 Free PMC article.
-
Clinical Utility of Preoperative Assessment in Ovarian Cancer Cytoreduction.Diagnostics (Basel). 2020 Aug 7;10(8):568. doi: 10.3390/diagnostics10080568. Diagnostics (Basel). 2020. PMID: 32784719 Free PMC article. Review.
-
Potential clinical utility of liquid biopsies in ovarian cancer.Mol Cancer. 2022 May 11;21(1):114. doi: 10.1186/s12943-022-01588-8. Mol Cancer. 2022. PMID: 35545786 Free PMC article. Review.
-
lncRNA LINC02323 predicts adverse neoadjuvant chemotherapy outcomes of gastric cancer patients and regulates cell sensitivity to 5-fluorouracil by negatively modulating miR-139-3p.Ann Med. 2024 Dec;56(1):2424513. doi: 10.1080/07853890.2024.2424513. Epub 2024 Nov 7. Ann Med. 2024. PMID: 39506605 Free PMC article.
References
-
- Ledermann JA, Raja FA, Fotopoulou C, Gonzalez-Martin A, Colombo N, Sessa C. Newly diagnosed and relapsed epithelial ovarian carcinoma: ESMO Clinical Practice Guidelines for diagnosis, treatment and follow-up. Ann Oncol. 2013;24 Suppl 6: vi24–32. - PubMed
-
- Vergote I, Trope CG, Amant F, et al. Neoadjuvant chemotherapy or primary surgery in stage IIIC or IV ovarian cancer. N Engl J Med. 2010;363: 943–953. - PubMed
-
- Gill SE, McGree ME, Weaver AL, Cliby WA, Langstraat CL. Optimizing the treatment of ovarian cancer: Neoadjuvant chemotherapy and interval debulking versus primary debulking surgery for epithelial ovarian cancers likely to have suboptimal resection. Gynecol Oncol. 2017;144: 266–273. - PubMed
Publication types
MeSH terms
Grants and funding
LinkOut - more resources
Full Text Sources
Other Literature Sources
Medical

