. 2018 Mar 9;8(1):4220.
doi: 10.1038/s41598-018-22654-6.

Purkinje cell BKchannel ablation induces abnormal rhythm in deep cerebellar nuclei and prevents LTD

Affiliations

Purkinje cell BKchannel ablation induces abnormal rhythm in deep cerebellar nuclei and prevents LTD

Guy Cheron et al. Sci Rep. .

Abstract

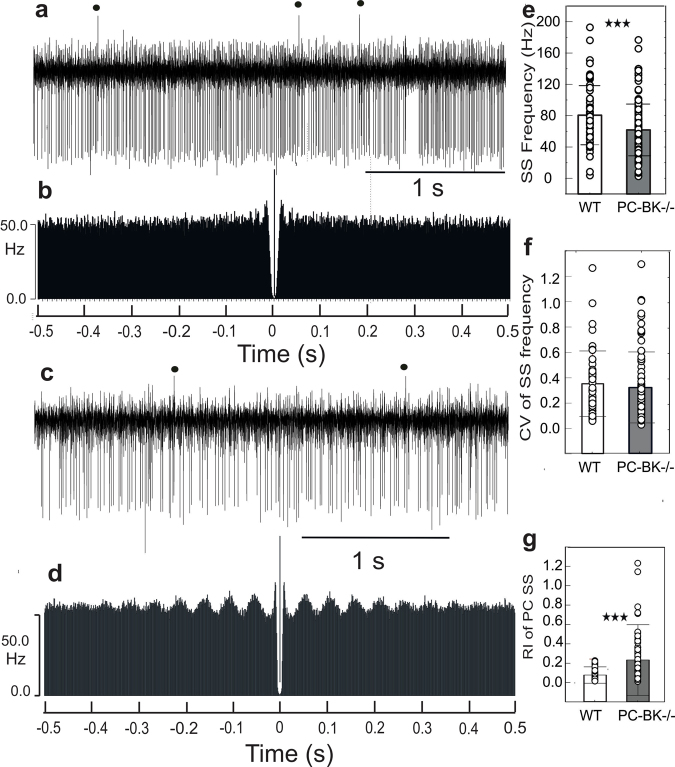
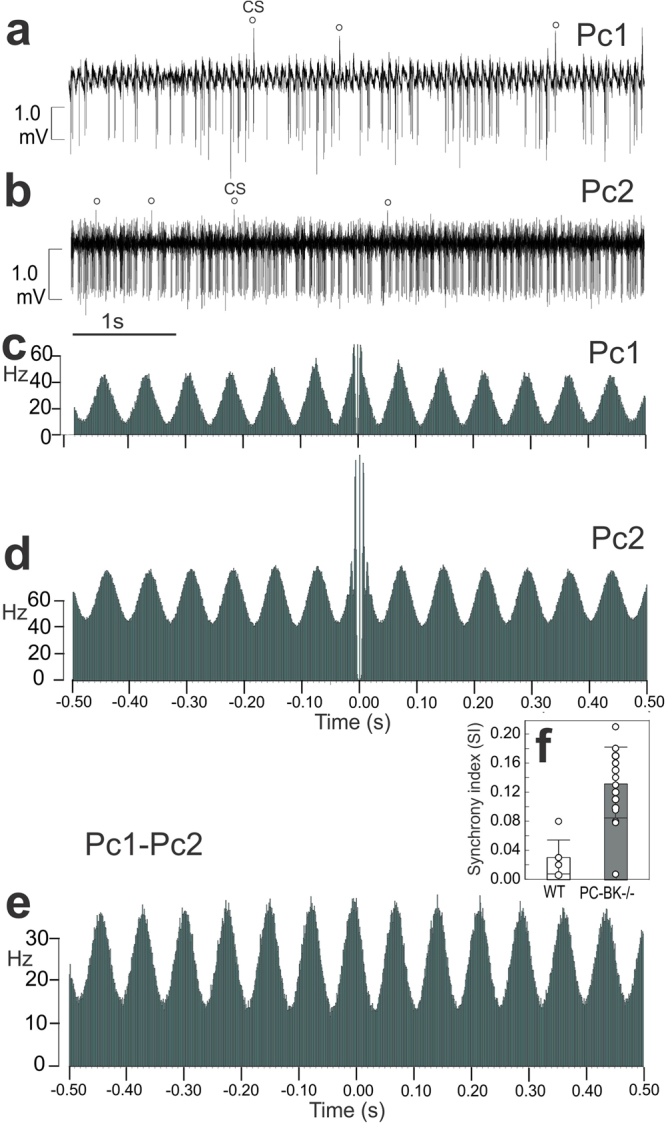
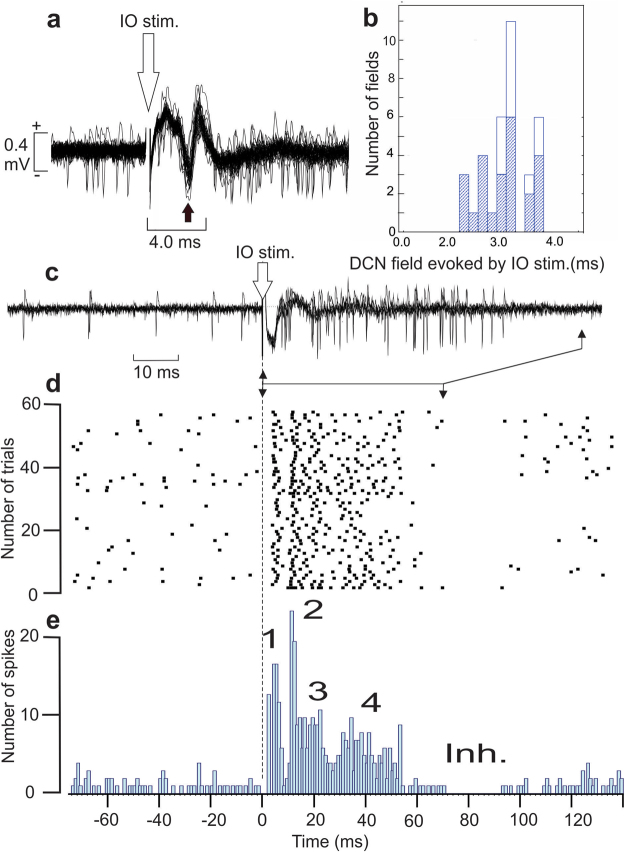
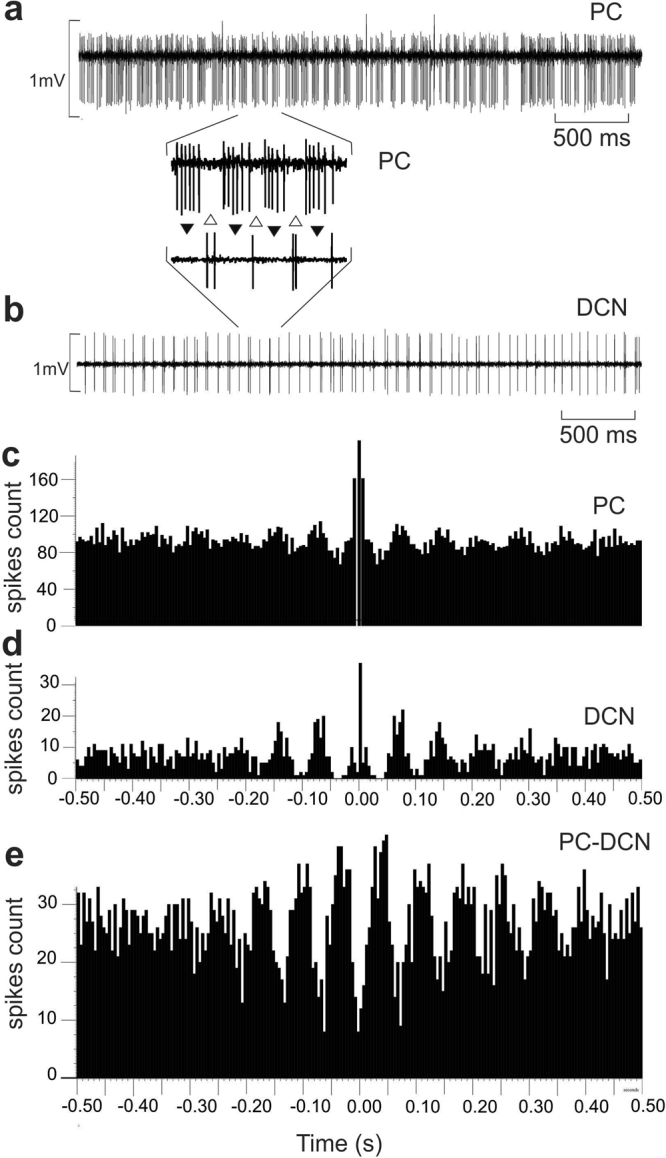
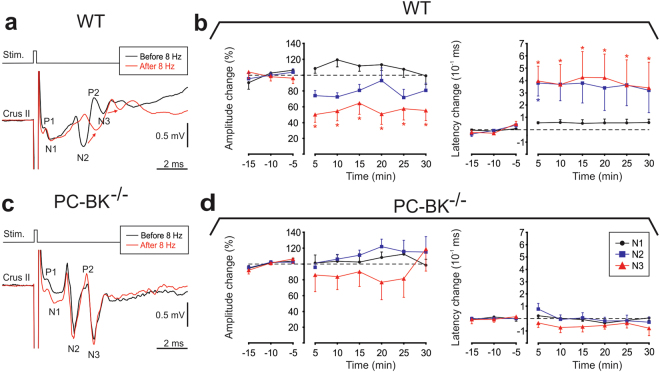
Purkinje cells (PC) control deep cerebellar nuclei (DCN), which in turn inhibit inferior olive nucleus, closing a positive feedback loop via climbing fibers. PC highly express potassium BK channels but their contribution to the olivo-cerebellar loop is not clear. Using multiple-unit recordings in alert mice we found in that selective deletion of BK channels in PC induces a decrease in their simple spike firing with a beta-range bursting pattern and fast intraburst frequency (~200 Hz). To determine the impact of this abnormal rhythm on the olivo-cerebellar loop we analyzed simultaneous rhythmicity in different cerebellar structures. We found that this abnormal PC rhythmicity is transmitted to DCN neurons with no effect on their mean firing frequency. Long term depression at the parallel-PC synapses was altered and the intra-burst complex spike spikelets frequency was increased without modification of the mean complex spike frequency in BK-PC-/- mice. We argue that the ataxia present in these conditional knockout mice could be explained by rhythmic disruptions transmitted from mutant PC to DCN but not by rate code modification only. This suggests a neuronal mechanism for ataxia with possible implications for human disease.


Conflict of interest statement

The authors declare no competing interests.

Figures

Figure 1
Figure 1
Schematic representation of the circuit involved in the present experimental paradigm. (a) PC of the Crus II and the DCN neurons (lateral nucleus) are recorded. Bipolar stimulation electrodes are chronically implanted in the red nucleus (magnocellular part) and in the inferior olive (dlPO dorsal lamella of the principal olive) of the contralateral side (RNc and IOc, respectively). The cortico-nuclear inhibitory projection of the PC to the DCN and the nucleo-olivary pathway are represented in black, the loop is closed by the climbing fiber (CF) projection (open symbol) from the IOc to the PC of the Crus II. The excitatory pathway from the DCN to the RNc is also represented. The pathway involved in the 8 Hz-inducing LTD paradigm is represented by the electrical stimulation of the whisker pad transmitted ipsilaterally via the trigeminal nucleus to the cerebellar mossy fiber (MF) producing the final excitatory input of the parallel fiber to the Crus II PC. (b) Simplified circuit of the olivocerebellar pathway presenting the 3 classical elements (the cerebellar cortex, the deep cerebellar nucleus and the inferior olive). The vertical arrows represent the signal circulation inside of the loop and the horizontal arrow the final output elaborated by the DCN neurons.
Figure 2
Figure 2
Rhythmic alteration of the SS firing behavior in PC-BK−/− mice. (a) PC firing behavior in one WT mouse. CS are marked by a black dot. (b) Autocorrelogram of the SS firing illustrated in (a). (c) PC firing behavior of a representative PC-BK−/− mouse. (d) Autocorrelogram of the SS firing illustrated in c. Note the numerous side peaks corresponding to beta oscillation (19.3 Hz).(e) Histogram (e,f,g) Box and whisker plots (mean ± SD) of the SS frequency, the CV of the SS frequency and the RI of the SS PC, respectively. The PC-BK−/− mice are represented with the grey bars and the WT with the white bars. (***, for P < 0.001).
Figure 3
Figure 3
Synchronization of the SS firing along the PF beam in PC-BK−/− mice. (a,b) Firing patterns of two PC (Pc1, Pc2) distant from 250 µm along the parallel fiber beam. CS occurrence is marked by an open circle. (c,d) Autocorrelograms of the SS firing of the Pc1 and Pc2, respectively. These autocorrelograms show a double rhythmicity related to the fast intraburst frequency (~ 200 Hz, center of the autocorrelogram) and the periodic bursting pattern in the beta range (~14 Hz) presenting numerous side peaks keeping the same amplitude along time. (e) Crosscorrelogram of the SS firing of the same PC illustrated in (c,d). This analysis was performed during a continuous time recording of 7 minutes indicating the robustness of the beta oscillation. (f) Box and whisker plots (mean ± SD) of the synchrony index (SI) measured in 18 PC pairs of PC-BK−/− and 7 PC pairs of WT mice. (***, for P < 0.001).
Figure 4
Figure 4
Increase of the intraburst frequency of the CS spikelets and SS silent period in PC-BK−/− mice. Left, superimposition of CS occurrence (n = 10)(marked by an arrow) triggering the silent period (SP) of the SS firing in an WT (a) and a PC-BK−/− mice (b). Right, averaged trace (n = 10) of the corresponding CS. Note the increased number of spikelets in the PC-BK−/− mouse. (c) FFT analysis performed around 3 isolated and consecutives CS (illustrated in the corresponding inset) highlighting the very high intraburst frequency of the CS in the PC-BK−/− mouse. =of the CS frequency (d), the intraburst frequency of the CS spikelets (e), the number of spikelets (f) and the SS silence evoked by the CS (g). The PC-BK−/− mice are represented with the grey and the WT with the white bars. (***, for P < 0.001).
Figure 5
Figure 5
Identification of the DCN neurons and firing rate properties. (a) Example of antidromic activation (black asterisk) of a DCN neuron from stimulation of the red nucleus (RN stim., arrow). Note the collision (white asterisk) between the spontaneous spike of the DCN neuron (black point) and the antidromic spike. (b) Histogram of the antidromic latency of the DCN neurons activated from the red nucleus in PC-BK−/− (gray) and in WT mice (white). (c,d) Box and whisker plots (means ± SD) of the DCN neurons firing rate, and coefficient of variation, respectively. The PC-BK−/− mice are represented in black bar and the WT in white bar. (**, for P < 0.01).
Figure 6
Figure 6
Rhythmic alteration of the DCN neurons firing behavior in PC-BK−/− mice. (a) Box and whisker plots (means ± SD) of the rhythm index (RI) of the DCN neurons. The PC-BK−/− mice are represented with the black and the WT with the white bars. (b) Example of firing discharge of a DCN neuron recorded in a WT mouse. (c) Autocorrelogram of the firing illustrated in (b). (d) Example of firing discharge of a DCN neuron recorded in a PC-BK−/− mouse. (e) Autocorrelogram of the firing illustrated in (d). Note the bursting behavior and the constant beta oscillatory profile recorded in the DCN of PC-BK−/− mouse in contrast to the tonic firing and the flat autocorrelogram in WT mice. (***, for P < 0.001).
Figure 7
Figure 7
Activation of the DCN neurons by the stimulation of the inferior olive nucleus. (a) Superimposition of the firing discharge of a DCN neuron during the stimulation (n = 54) of the inferior olive in a WT mouse. Note that the spikes are superimposed on a negative field potential occurring at about 3 ms. (b) Latency histogram of the negative peak recorded in WT (white areas) and in PC-BK−/− mice (gray areas). (c) Another example of DCN neurons activated by the inferior olive stimulation (n = 5) (IO stim.) but for which the negative field is less marked than in A allowing a better identification of the early spike responses. (d) Raster histogram of the DCN neuron illustrated in (c). (e) Histogram of the spike evoked responses produce by the stimulation of the inferior olive showing 4 successive activation sequences (1, 2, 3, 4) followed by a delayed inhibition (inh.).
Figure 8
Figure 8
Beta rhythm transmission from PC output to the DCN neurons. Simultaneous recordings of one PC and one DCN neuron in a PC-BK−/− mouse. (a) PC firing rate. (b) DCN neuron firing rate. (between a and b) magnification of 4 bursts containing 5 to 6 SS spikes corresponding to the absence of firing of the DCN neuron. The reciprocity of firing is indexed by the alternation of black and white triangles. (c) Autocorrelogram of the SS firing of the PC illustrated in (a). (d) Autocorrelogram of the DCN neuron illustrate in (b). (e) Crosscorrelogram of the PC SS firing and the DCN neuron firing. Note the presence of numerous side peaks in the respective autocorrelograms (c and d) and the out-of-phase functional correlation in (e).
Figure 9
Figure 9
Functional relationship between the DCN neuron activity and the CS firing in PC-BK−/− mouse. (a) Raster histogram of a DCN neuron triggered by the CS of the simultaneous recorded PC. (b) Correlogram corresponding to the DCN neuron firing illustrated in (a). (c) Superimposition of the DCN neuron spikes (n = 18). (d) Superimposition of the CS of the PC firing. Note the presence of two SS before the superimposed CS (n = 16). (e) Time expansion of the central part of the raster and correlogram illustrated in (a,b) showing that the peak of the DCN neuron firing occurs about 26 ms before the CS occurrence.
Figure 10
Figure 10
Absence of evoked plasticity (LTD) in PC-BK−/− mice. (a) Superimposition of the local field potential components (P1, N1, N2, P2, N3) evoked by single whisker stimulation before (black traces) and after 8 Hz LTD-conditioning stimulation (red traces) (pulse signal, Stim.); recorded in Crus IIa in WT mouse. Note the decrease of N2 and N3 amplitude and the related latency shift of these components after 8 Hz LTD-conditioning stimulation. (b) Changes in amplitude and latency of evoked local field potential components N1 (black dots), N2 (blue squares) and N3 (red triangles), 15 min before and 30 min after the 8 Hz LTD-conditioning stimulation in WT mice. (c) Same type of local field potential superimposition that in (a) but recorded in a PC-BK−/− mouse. Note the absence of amplitude decrease and latency shift of N2 and N3. (d) Changes in amplitude and latency of evoked local field potential components as in (b) but for the PC-BK−/− mice. Data points are expressed as mean ± SEM. Significant differences (p < 0.05) from control (pre-stimulation period) are indicated with asterisks.

Similar articles

Cited by

References

    1. Marty A. Ca-dependent K channels with large unitary conductance in chromaffin cell membranes. Nature. 1981;291:497–500. doi: 10.1038/291497a0. - DOI - PubMed
    1. Sah P, Faber ES. Channels underlying neuronal calcium-activated potassium currents. Prog. Neurobiol. 2002;66:345–353. doi: 10.1016/S0301-0082(02)00004-7. - DOI - PubMed
    1. Berkefeld H, et al. BKCa-Cav channel complexes mediate rapid and localized Ca2- activated K signaling. Science. 2006;314:615–620. doi: 10.1126/science.1132915. - DOI - PubMed
    1. Robitaille R, Garcia ML, Kaczorowski GJ, Charlton MP. Functional colocalization of calcium and calcium-gated potassium channels in control of transmitter release. Neuron. 1993;11:645–655. doi: 10.1016/0896-6273(93)90076-4. - DOI - PubMed
    1. Rancz EA, Haüsser M. Dendritic calcium spikes are tunable triggers of cannabinoid release and short-term synaptic plasticity in cerebellar Purkinje neurons. J. Neurosci. 2006;26:5428–5437. doi: 10.1523/JNEUROSCI.5284-05.2006. - DOI - PMC - PubMed

Publication types

MeSH terms

Substances

LinkOut - more resources