

Antimicrobial Photodynamic therapy enhanced by the peptide aurein 1.2
- PMID: 29523862
- PMCID: PMC5844988
- DOI: 10.1038/s41598-018-22687-x
Antimicrobial Photodynamic therapy enhanced by the peptide aurein 1.2
Abstract
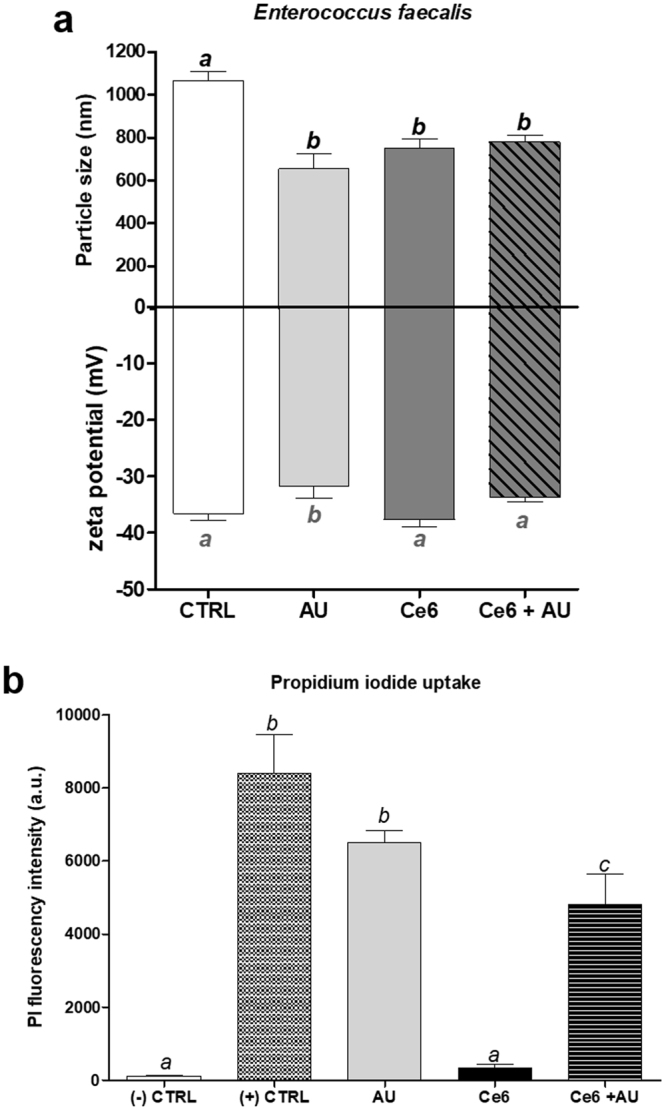
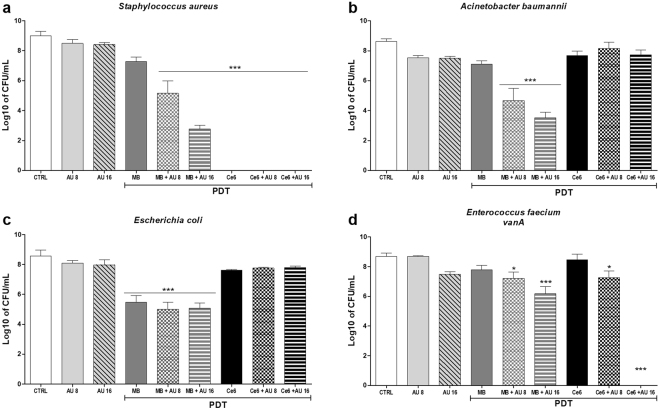
In the past few years, the World Health Organization has been warning that the post-antibiotic era is an increasingly real threat. The rising and disseminated resistance to antibiotics made mandatory the search for new drugs and/or alternative therapies that are able to eliminate resistant microorganisms and impair the development of new forms of resistance. In this context, antimicrobial photodynamic therapy (aPDT) and helical cationic antimicrobial peptides (AMP) are highlighted for the treatment of localized infections. This study aimed to combine the AMP aurein 1.2 to aPDT using Enterococcus faecalis as a model strain. Our results demonstrate that the combination of aPDT with aurein 1.2 proved to be a feasible alternative capable of completely eliminating E. faecalis employing low concentrations of both PS and AMP, in comparison with the individual therapies. Aurein 1.2 is capable of enhancing the aPDT activity whenever mediated by methylene blue or chlorin-e6, but not by curcumin, revealing a PS-dependent mechanism. The combined treatment was also effective against different strains; noteworthy, it completely eliminated a vancomycin-resistant strain of Enterococcus faecium. Our results suggest that this combined protocol must be exploited for clinical applications in localized infections as an alternative to antibiotics.
Conflict of interest statement
The authors declare no competing interests.
Figures


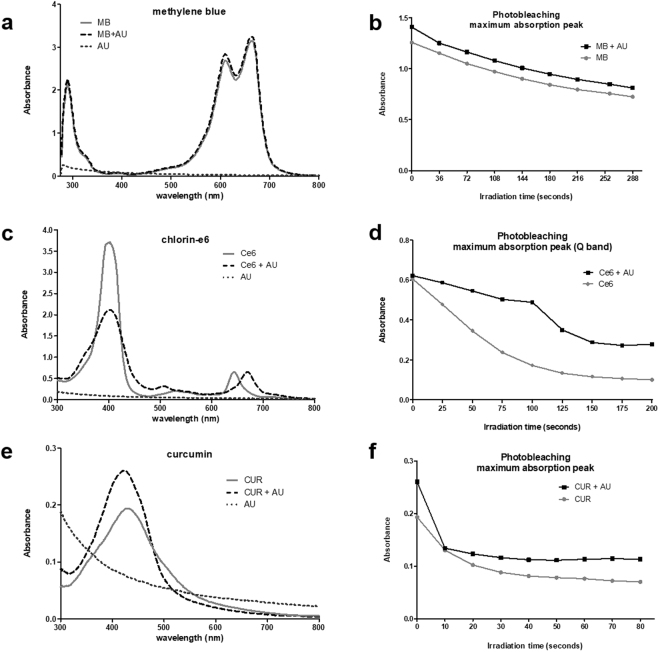
 ; 156 µM), AU (
 ; 16 µM) and MB combined with AU (
 ), in aqueous solutions. (b) Photobleaching kinetics assessment of MB alone and in the presence of AU irradiated with a total energy dose of 45 J/cm². Statistical analyses revealed no significant difference between the two slopes (p = 0.2581). (c) Normalized UV-VIS spectra of Ce6 (
 ; 84 µM), AU (
 ; 16 µM) and Ce6 combined with AU (
 ), in aqueous solutions. (d) Photobleaching kinetics assessment of Ce6 alone and in the presence of AU irradiated with a total energy dose of 30 J/cm². Statistical analyses revealed a significant difference between the two slopes (p < 0.0001). (e) Normalized UV-VIS spectra of CUR (
 ; 68 µM), AU (
 ; 16 µM) and CUR combined with AU (
 ), in aqueous solutions. (f) Photobleaching kinetics assessment of CUR alone and in the presence of AU irradiated with a total energy dose of 12.5 J/cm². Statistical analyses revealed a significant difference between the two slopes (p = 0.0244). All assays were executed with Synergy H1M (Synergy H1 Multi-Mode Reader, BioTek, Winooski, VT, USA). CUR: curcumin; Ce6: chlorin-e6; MB: methylene blue; AU: aurein 1.2.
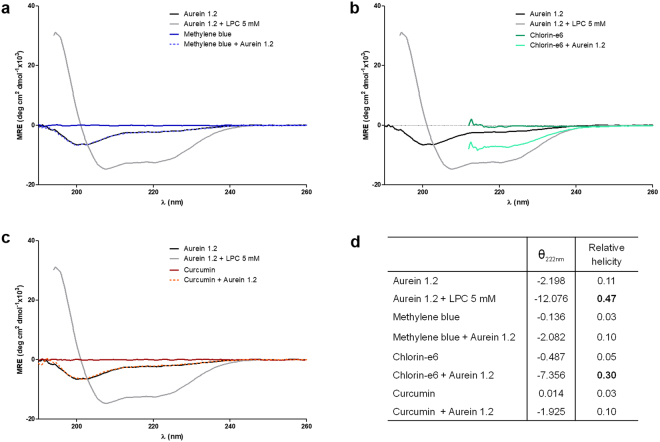
References
-
- World Health Organization. Antimicrobial resistance. at http://www.who.int/drugresistance/documents/surveillancereport/en/ (2014).
-
- Kishen A. Advanced therapeutic options for endodontic biofilms. Endod. Top. 2012;22:99–123. doi: 10.1111/j.1601-1546.2012.00284.x. - DOI
Publication types
MeSH terms
Substances
LinkOut - more resources
Full Text Sources
Other Literature Sources
Miscellaneous
