

Parametric mapping using spectral analysis for 11C-PBR28 PET reveals neuroinflammation in mild cognitive impairment subjects
- PMID: 29523926
- PMCID: PMC5993844
- DOI: 10.1007/s00259-018-3984-5
Parametric mapping using spectral analysis for 11C-PBR28 PET reveals neuroinflammation in mild cognitive impairment subjects
Abstract
Purpose: Neuroinflammation and microglial activation play an important role in amnestic mild cognitive impairment (MCI) and Alzheimer's disease. In this study, we investigated the spatial distribution of neuroinflammation in MCI subjects, using spectral analysis (SA) to generate parametric maps and quantify 11C-PBR28 PET, and compared these with compartmental and other kinetic models of quantification.
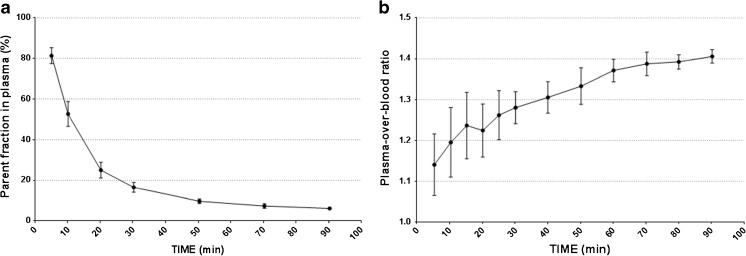
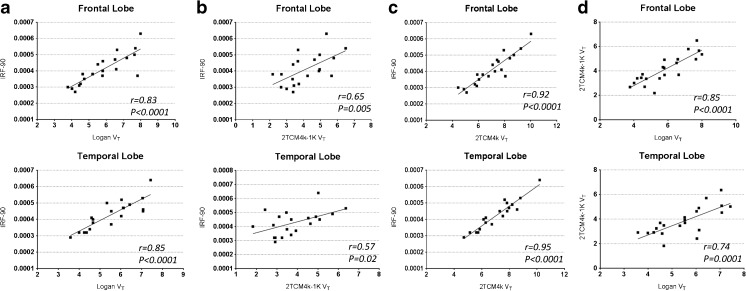
Methods: Thirteen MCI and nine healthy controls were enrolled in this study. Subjects underwent 11C-PBR28 PET scans with arterial cannulation. Spectral analysis with an arterial plasma input function was used to generate 11C-PBR28 parametric maps. These maps were then compared with regional 11C-PBR28 VT (volume of distribution) using a two-tissue compartment model and Logan graphic analysis. Amyloid load was also assessed with 18F-Flutemetamol PET.
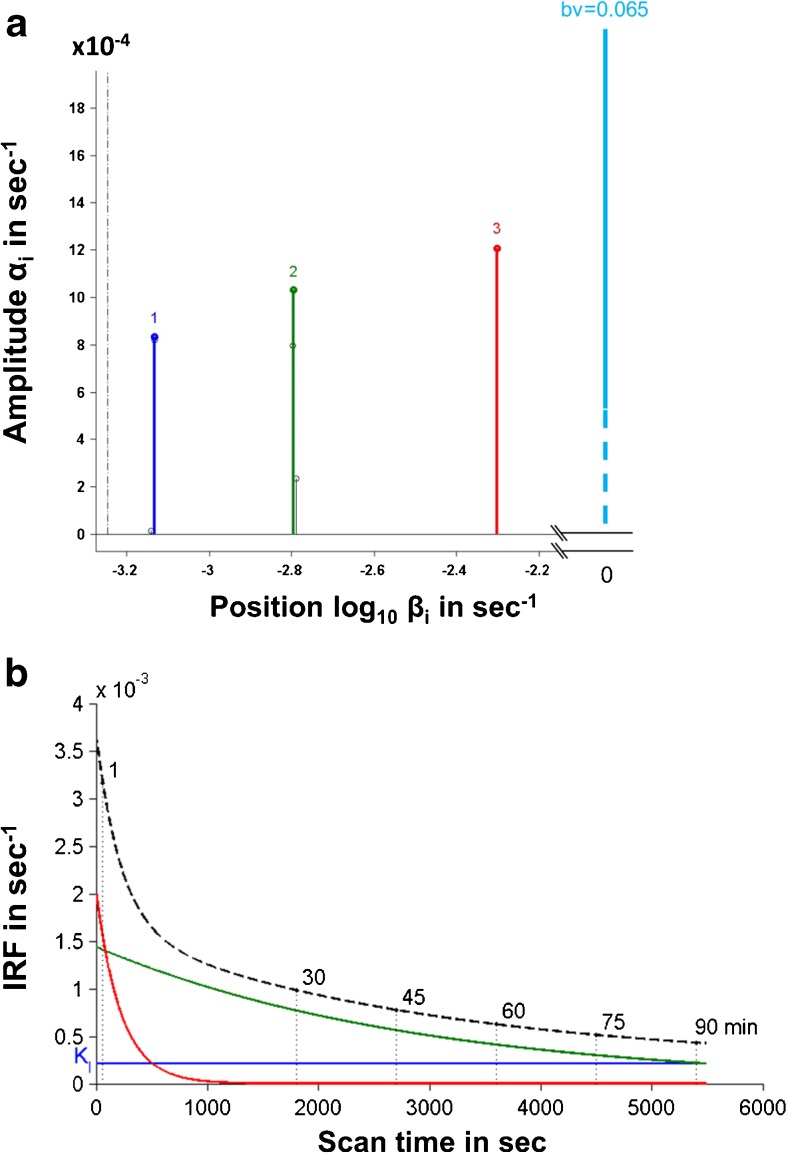
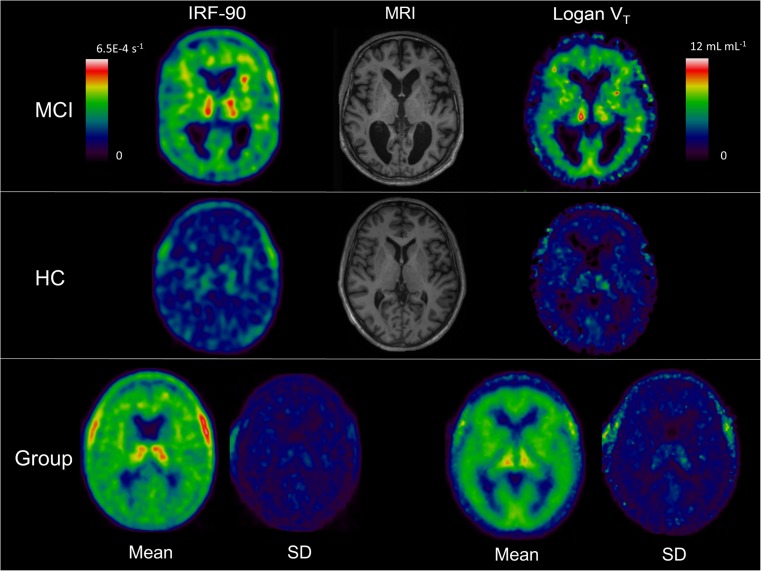
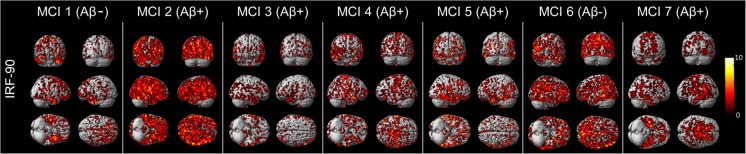
Results: With SA, three component peaks were identified in addition to blood volume. The 11C-PBR28 impulse response function (IRF) at 90 min produced the lowest coefficient of variation. Single-subject analysis using this IRF demonstrated microglial activation in five out of seven amyloid-positive MCI subjects. IRF parametric maps of 11C-PBR28 uptake revealed a group-wise significant increase in neuroinflammation in amyloid-positive MCI subjects versus HC in multiple cortical association areas, and particularly in the temporal lobe. Interestingly, compartmental analysis detected group-wise increase in 11C-PBR28 binding in the thalamus of amyloid-positive MCI subjects, while Logan parametric maps did not perform well.
Conclusions: This study demonstrates for the first time that spectral analysis can be used to generate parametric maps of 11C-PBR28 uptake, and is able to detect microglial activation in amyloid-positive MCI subjects. IRF parametric maps of 11C-PBR28 uptake allow voxel-wise single-subject analysis and could be used to evaluate microglial activation in individual subjects.
Keywords: 11C–PBR28; Compartmental modelling; Logan graphic analysis; MCI; PET; Spectral analysis.
Conflict of interest statement
Conflict of interest
Dr. Edison was funded by the Medical Research Council and now by Higher Education Funding Council for England (HEFCE). He has also received grants from Alzheimer’s Research UK, Alzheimer’s Drug Discovery Foundation, Alzheimer’s Society, UK, Novo Nordisk, and GE Healthcare. He is also a consultant to Pfizer. Prof. Brooks has received research grants and non-financial support from the Medical Research Council, grants from Alzheimer’s Research Trust, during the conduct of the study; other from GE Healthcare, personal fees from AstraZeneca, personal fees from Cytox, personal fees from Shire, personal fees from Novartis, personal fees from GSK, Holland, personal fees from Navidea, personal fees from UCB, personal fees from Acadia, grants from Michael J Fox Foundation, grants from European Commission, outside the submitted work. Mattia Veronese is supported by the National Institute for Health Research (NIHR) Biomedical Research Centre at South London and Maudsley NHS Foundation Trust and by King’s College London.
Ethical approval
All procedures performed in studies involving human participants were in accordance with the ethical standards of the institutional and/or national research committee and with the 1964 Helsinki Declaration and its later amendments or comparable ethical standards.
Informed consent
Informed consent was obtained from all individual participants included in the study.
Figures
Similar articles
-
Microglial activation in early Alzheimer trajectory is associated with higher gray matter volume.Neurology. 2019 Mar 19;92(12):e1331-e1343. doi: 10.1212/WNL.0000000000007133. Epub 2019 Feb 22. Neurology. 2019. PMID: 30796139 Free PMC article.
-
Microglial activation correlates in vivo with both tau and amyloid in Alzheimer's disease.Brain. 2018 Sep 1;141(9):2740-2754. doi: 10.1093/brain/awy188. Brain. 2018. PMID: 30052812
-
Parametric Mapping for TSPO PET Imaging with Spectral Analysis Impulsive Response Function.Mol Imaging Biol. 2021 Aug;23(4):560-571. doi: 10.1007/s11307-020-01575-9. Epub 2021 Jan 21. Mol Imaging Biol. 2021. PMID: 33475944 Free PMC article.
-
11C PiB and structural MRI provide complementary information in imaging of Alzheimer's disease and amnestic mild cognitive impairment.Brain. 2008 Mar;131(Pt 3):665-80. doi: 10.1093/brain/awm336. Epub 2008 Feb 7. Brain. 2008. PMID: 18263627 Free PMC article.
-
In vivo radioligand binding to translocator protein correlates with severity of Alzheimer's disease.Brain. 2013 Jul;136(Pt 7):2228-38. doi: 10.1093/brain/awt145. Epub 2013 Jun 17. Brain. 2013. PMID: 23775979 Free PMC article.
Cited by
-
Pharmacological considerations for treating neuroinflammation with curcumin in Alzheimer's disease.J Neural Transm (Vienna). 2022 Jun;129(5-6):755-771. doi: 10.1007/s00702-022-02480-x. Epub 2022 Mar 16. J Neural Transm (Vienna). 2022. PMID: 35294663 Review.
-
PET imaging shows no changes in TSPO brain density after IFN-α immune challenge in healthy human volunteers.Transl Psychiatry. 2020 Mar 9;10(1):89. doi: 10.1038/s41398-020-0768-z. Transl Psychiatry. 2020. PMID: 32152285 Free PMC article.
-
Association of neuroinflammation with episodic memory: a [11C]PBR28 PET study in cognitively discordant twin pairs.Brain Commun. 2020 Apr 14;2(1):fcaa024. doi: 10.1093/braincomms/fcaa024. eCollection 2020. Brain Commun. 2020. PMID: 32954285 Free PMC article.
-
Microglial activation in early Alzheimer trajectory is associated with higher gray matter volume.Neurology. 2019 Mar 19;92(12):e1331-e1343. doi: 10.1212/WNL.0000000000007133. Epub 2019 Feb 22. Neurology. 2019. PMID: 30796139 Free PMC article.
-
MicroRNA: A Linking between Astrocyte Dysfunction, Mild Cognitive Impairment, and Neurodegenerative Diseases.Life (Basel). 2022 Sep 16;12(9):1439. doi: 10.3390/life12091439. Life (Basel). 2022. PMID: 36143475 Free PMC article. Review.
References
-
- Higuchi M, Ji B, Maeda J, Sahara N, Suhara T. In vivo imaging of neuroinflammation in Alzheimer’s disease. Clin Exp Neuroimmunol. 2016;7(2):139–144. doi: 10.1111/cen3.12308. - DOI
MeSH terms
Substances
Grants and funding
LinkOut - more resources
Full Text Sources
Other Literature Sources
Medical
Molecular Biology Databases
