

Plasma Vascular Endothelial Growth Factor Concentrations after Intravitreous Anti-Vascular Endothelial Growth Factor Therapy for Diabetic Macular Edema
- PMID: 29525602
- PMCID: PMC6568257
- DOI: 10.1016/j.ophtha.2018.01.019
Plasma Vascular Endothelial Growth Factor Concentrations after Intravitreous Anti-Vascular Endothelial Growth Factor Therapy for Diabetic Macular Edema
Abstract
Purpose: To assess systemic vascular endothelial growth factor (VEGF)-A levels after treatment with intravitreous aflibercept, bevacizumab, or ranibizumab.
Design: Comparative-effectiveness trial with participants randomly assigned to 2 mg aflibercept, 1.25 mg bevacizumab, or 0.3 mg ranibizumab after a re-treatment algorithm.
Participants: Participants with available plasma samples (N = 436).
Methods: Plasma samples were collected before injections at baseline and 4-week, 52-week, and 104-week visits. In a preplanned secondary analysis, systemic-free VEGF levels from an enzyme-linked immunosorbent assay were compared across anti-VEGF agents and correlated with systemic side effects.
Main outcome measures: Changes in the natural log (ln) of plasma VEGF levels.
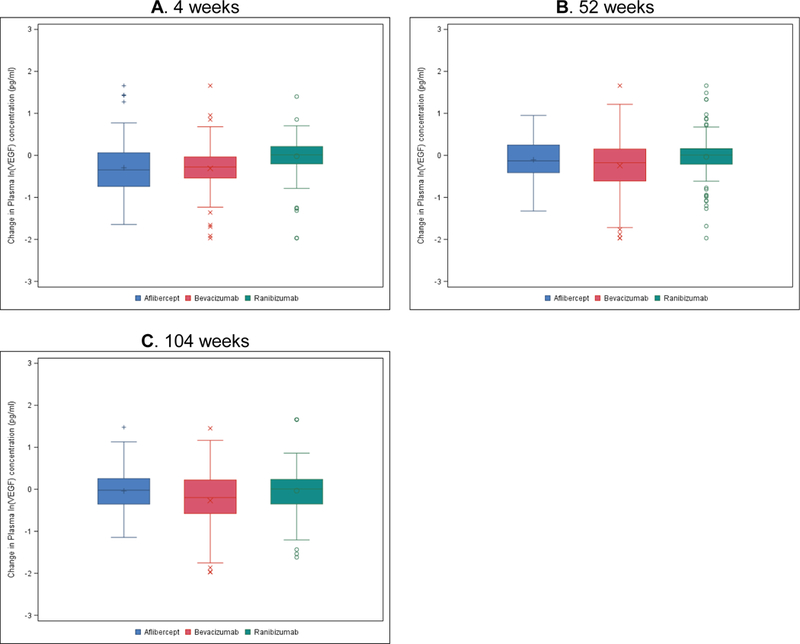
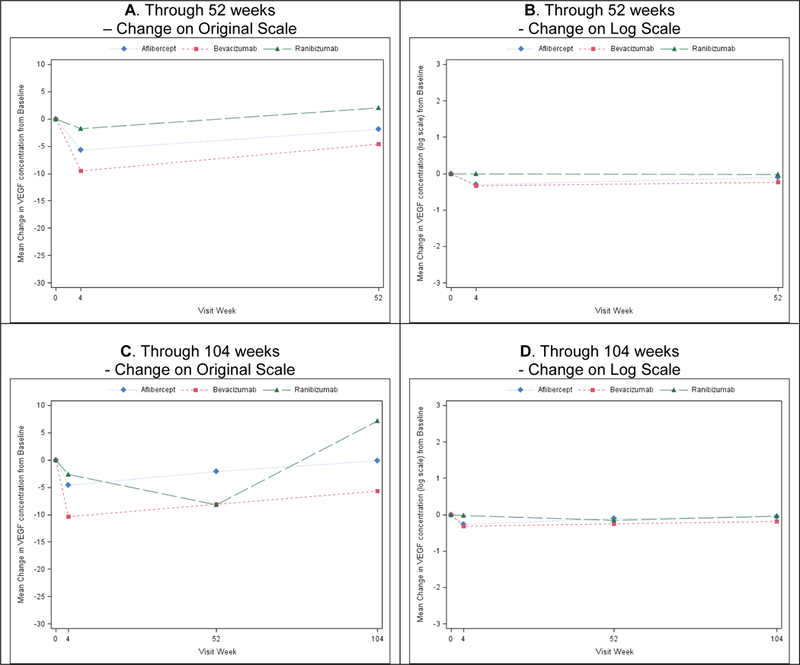
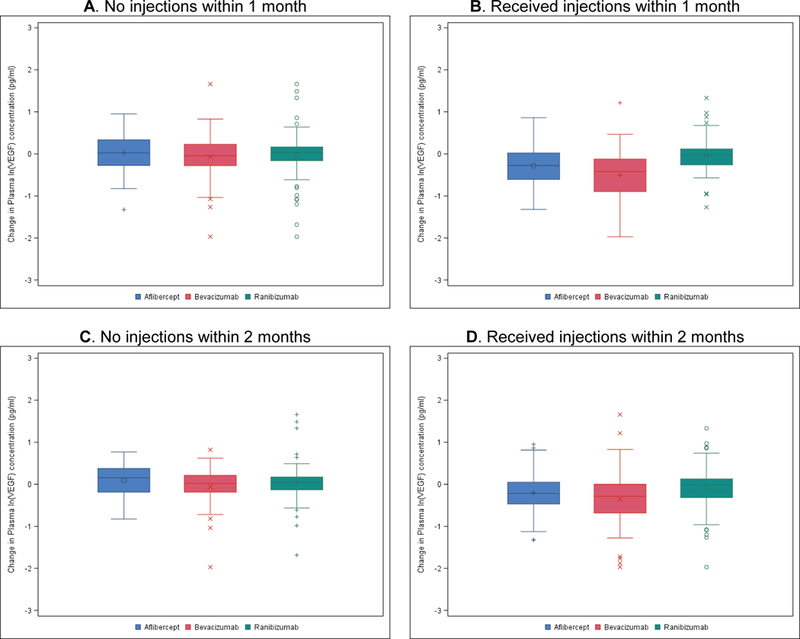
Results: Baseline free VEGF levels were similar across all 3 groups. At 4 weeks, mean ln(VEGF) changes were -0.30±0.61 pg/ml, -0.31±0.54 pg/ml, and -0.02±0.44 pg/ml for the aflibercept, bevacizumab, and ranibizumab groups, respectively. The adjusted differences between treatment groups (adjusted confidence interval [CI]; P value) were -0.01 (-0.12 to +0.10; P = 0.89), -0.31 (-0.44 to -0.18; P < 0.001), and -0.30 (-0.43 to -0.18; P < 0.001) for aflibercept-bevacizumab, aflibercept-ranibizumab, and bevacizumab-ranibizumab, respectively. At 52 weeks, a difference in mean VEGF changes between bevacizumab and ranibizumab persisted (-0.23 [-0.38 to -0.09]; P < 0.001); the difference between aflibercept and ranibizumab was -0.12 (P = 0.07) and between aflibercept and bevacizumab was +0.11 (P = 0.07). Treatment group differences at 2 years were similar to 1 year. No apparent treatment differences were detected at 52 or 104 weeks in the cohort of participants not receiving injections within 1 or 2 months before plasma collection. Participants with (N = 9) and without (N = 251) a heart attack or stroke had VEGF levels that appeared similar.
Conclusions: These data suggest that decreases in plasma free-VEGF levels are greater after treatment with aflibercept or bevacizumab compared with ranibizumab at 4 weeks. At 52 and 104 weeks, a greater decrease was observed in bevacizumab versus ranibizumab. Results from 2 subgroups of participants who did not receive injections within at least 1 month and 2 months before collection suggest similar changes in VEGF levels after stopping injections. It is unknown whether VEGF levels return to normal as the drug is cleared from the system or whether the presence of the drug affects the assay's ability to accurately measure free VEGF. No significant associations between VEGF concentration and systemic factors were noted.
Copyright © 2018 American Academy of Ophthalmology. Published by Elsevier Inc. All rights reserved.
Figures
Comment in
-
Re: Jampol et al.: Plasma vascular endothelial growth factor concentrations after intravitreous anti-vascular endothelial growth factor therapy for diabetic macular edema (Ophthalmology. 2018;7:1054-1063).Ophthalmology. 2018 Nov;125(11):e81-e82. doi: 10.1016/j.ophtha.2018.05.003. Ophthalmology. 2018. PMID: 30318047 No abstract available.
-
Reply.Ophthalmology. 2018 Nov;125(11):e82. doi: 10.1016/j.ophtha.2018.05.004. Ophthalmology. 2018. PMID: 30318048 No abstract available.
References
-
- Ranpura V, Hapani S, Chuang J, et al. Risk of cardiac ischemia and arterial thromboembolic events with the angiogenesis inhibitor bevacizumab in cancer patients: a meta-analysis of randomized controlled trials. Acta Oncol 2010;49:287–97. - PubMed
-
- Kong L, Bhatt AR, Demny AB, et al. Pharmacokinetics of bevacizumab and its effects on serum VEGF and IGF-1 in infants with retinopathy of prematurity. Invest Ophthalmol Vis Sci 2015;56:956–61. - PubMed
-
- Avery RL, Gordon GM. Systemic Safety of Prolonged Monthly Anti-Vascular Endothelial Growth Factor Therapy for Diabetic Macular Edema: A Systematic Review and Meta-analysis. JAMA Ophthalmol 2016;134:21–9. - PubMed
Publication types
MeSH terms
Substances
Grants and funding
LinkOut - more resources
Full Text Sources
Other Literature Sources
Medical
