. 2018 Apr 10;10(4):1340-1354.
doi: 10.1016/j.stemcr.2018.02.002. Epub 2018 Mar 8.

Combined Loss of JMJD1A and JMJD1B Reveals Critical Roles for H3K9 Demethylation in the Maintenance of Embryonic Stem Cells and Early Embryogenesis

Affiliations

Combined Loss of JMJD1A and JMJD1B Reveals Critical Roles for H3K9 Demethylation in the Maintenance of Embryonic Stem Cells and Early Embryogenesis

Shunsuke Kuroki et al. Stem Cell Reports. .

Abstract

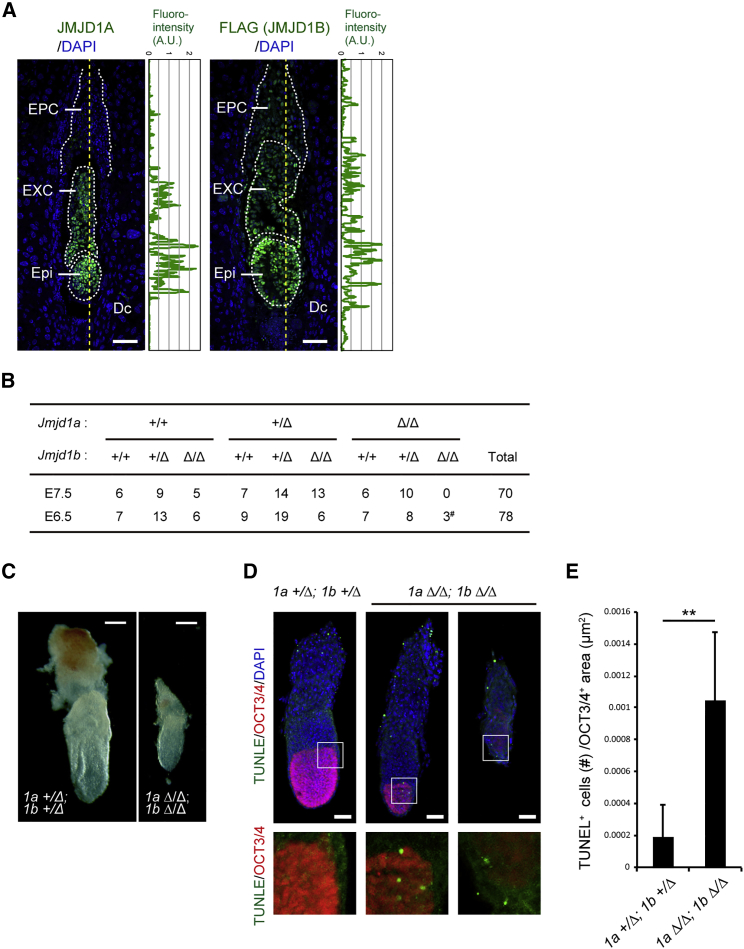
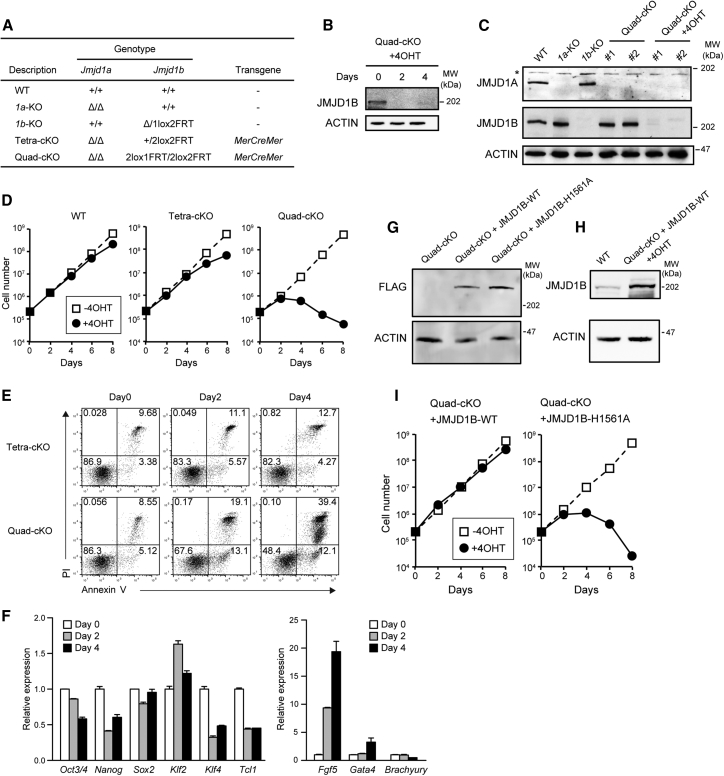
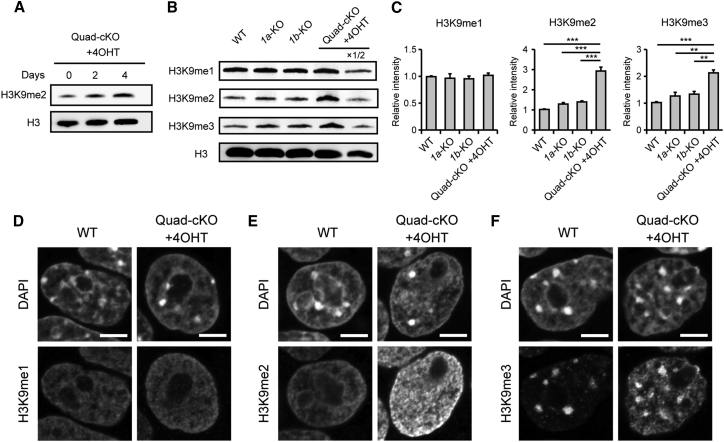
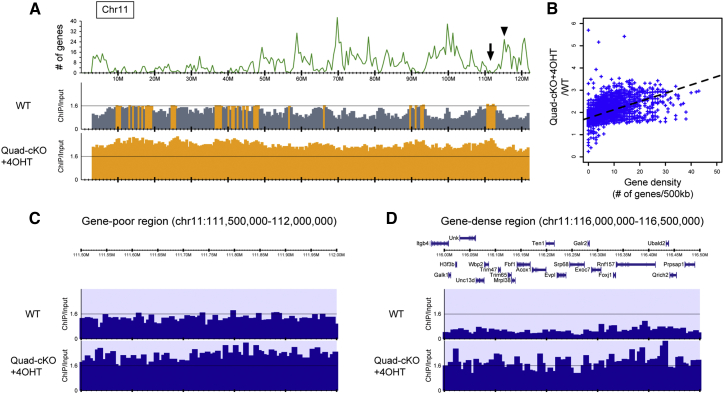
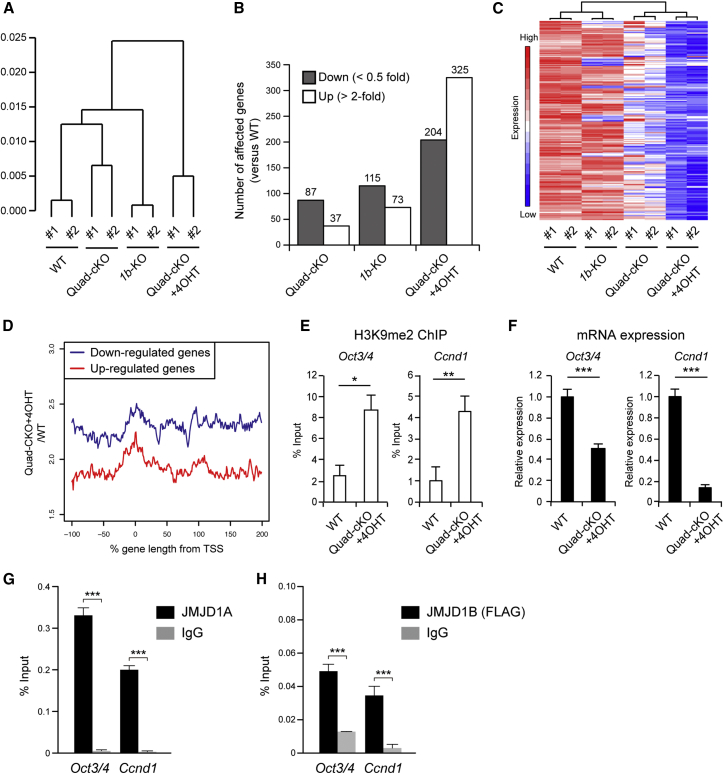
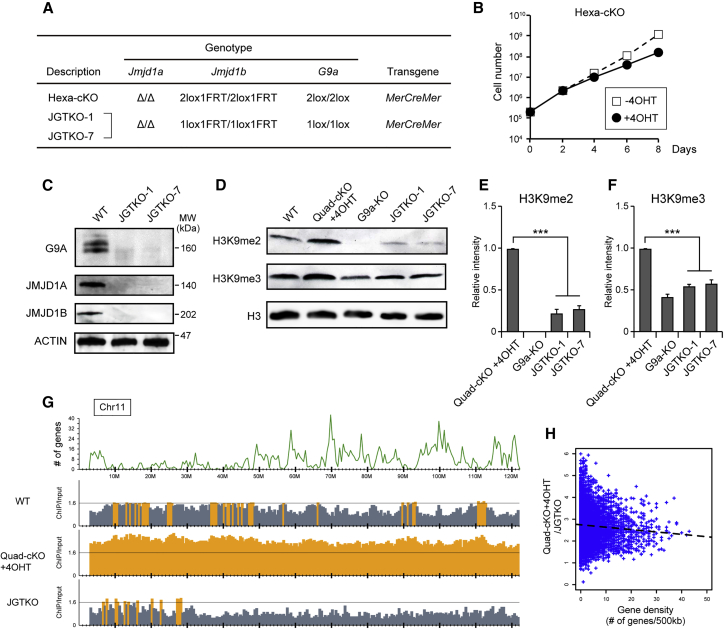
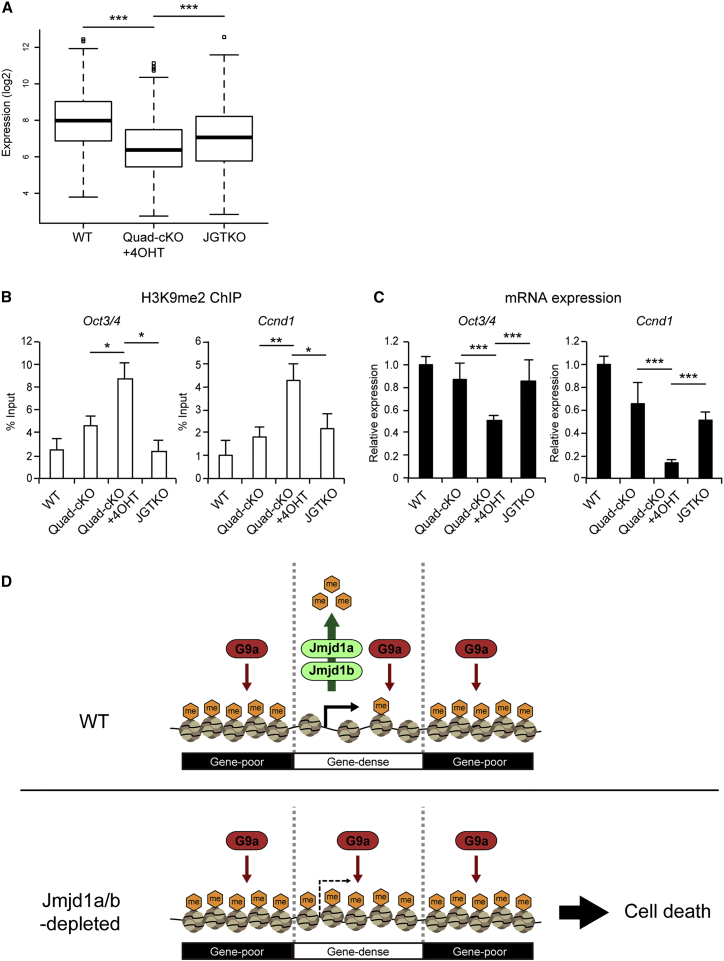
Histone H3 lysine 9 (H3K9) methylation is unevenly distributed in mammalian chromosomes. However, the molecular mechanism controlling the uneven distribution and its biological significance remain to be elucidated. Here, we show that JMJD1A and JMJD1B preferentially target H3K9 demethylation of gene-dense regions of chromosomes, thereby establishing an H3K9 hypomethylation state in euchromatin. JMJD1A/JMJD1B-deficient embryos died soon after implantation accompanying epiblast cell death. Furthermore, combined loss of JMJD1A and JMJD1B caused perturbed expression of metabolic genes and rapid cell death in embryonic stem cells (ESCs). These results indicate that JMJD1A/JMJD1B-meditated H3K9 demethylation has critical roles for early embryogenesis and ESC maintenance. Finally, genetic rescue experiments clarified that H3K9 overmethylation by G9A was the cause of the cell death and perturbed gene expression of JMJD1A/JMJD1B-depleted ESCs. We summarized that JMJD1A and JMJD1B, in combination, ensure early embryogenesis and ESC viability by establishing the correct H3K9 methylated epigenome.

Keywords: embryonic stem cell; histone demethylation; histone methylation; transcription.


Figures

Figure 1
Figure 1
JMJD1A and JMJD1B Are Essential for Mouse Embryogenesis (A) Immunofluorescence analysis of longitudinal sections of the E6.5 embryos with JMJD1A (left) and JMJD1B (right). E6.5 wild-type embryos were stained with anti-JMJD1A antibodies and DAPI (left). E6.5 Jmjd1b+/Flag−KI embryos were stained with anti-FLAG antibodies and DAPI (right). Fluorescence intensities along the dashed lines were quantified and plotted on the right side of the images. Scale bars, 100 μm. Epi, epiblast; EXC, extraembryonic ectoderm; EPC, ectoplacental cone; Dc, decidual cells. A.U., arbitrary unit. (B) Jmjd1a+/Δ; Jmjd1a+/Δ males and females were crossed, and the resultant embryos were genotyped at the indicated embryonic periods. Jmjd1aΔ/Δ; Jmjd1aΔ/Δ embryos were found at E6.5, but not at E7.5. #, growth-retarded embryos. (C) Gross appearances of Jmjd1a/Jmjd1b double-deficient embryos at E6.5 (left) when compared with a littermate control (right). 1a and 1b represent Jmjd1a and Jmjd1b, respectively. Scale bar, 100 μm. (D) Whole-mount immunostaining analysis for the epiblast marker OCT3/4. Embryos were counterstained with DAPI and TUNEL to detect apoptotic cells. Scale bars, 100 μm. (E) TUNEL-positive cells in the epiblast lineage were counted and summarized. Jmjd1a+/Δ; Jmjd1a+/Δ, n = 7; Jmjd1aΔ/Δ; Jmjd1aΔ/Δ, n = 3 different embryos (biological replicates). Data are presented as means ± SD. ∗∗p < 0.01 (Student's t test).
Figure 2
Figure 2
Depletion of JMJD1A and JMJD1B Induces Growth Arrest in ESCs (A) List of the established ESC lines and their genotypes. MerCreMer, Cre flanked by mutated estrogen receptor ligand-binding domains. (B) Time-course analysis of 4OHT-dependent depletion of JMJD1B in Quad-cKO cells. (C) Immunoblot analyses of JMJD1A/JMJD1B-depleted ESC lines. Whole extracts of the indicated ESC lines were fractionated using SDS-PAGE and then applied to immunoblot analysis with antibodies against JMJD1A and JMJD1B. JMJD1A and JMJD1B were depleted in the Quad-cKO cell lines cultured with 800 nM 4OHT for 4 days. Asterisk () represents non-specific signals. (D) The indicated ESC lines were cultured in the presence or absence of 4OHT. Cell numbers were determined every 2 days. Growth arrest became apparent when the Quad-cKO cell line was cultured in the presence of 4OHT for 4 days (right). In contrast, wild-type (left) and Tetra-cKO (middle) cells grew in the presence of OHT. (E) Time-course analysis of JMJD1 depletion-induced cell death. The indicated ESC lines were cultured in the presence of 4OHT, following which the cells were stained with PI and annexin V and analyzed using flow cytometry. (F) Expression levels of pluripotency-associated (left) and lineage-associated (right) genes in Quad-cKO cells treated with 4OHT were examined using RT-qPCR. We used Fgf5, Gata4, and Brachyury as the markers for primitive ectoderm, endoderm, and mesoderm, respectively. Representative data are presented from independent triplicate experiments. Error bars indicate means ± SD derived from technical replicates. (G and H) Rescue of the growth arrest phenotype by exogenous introduction of JMJD1B into Quad-cKO cell line. (G) Expression vectors for FLAG-tagged wild-type JMJD1B or enzymatically inactive H1561A mutants of JMJD1B were individually and stably introduced into the Quad-cKO cell line. The expression levels of exogenously expressed proteins were compared by immunoblot analysis. (H) Comparison of protein expression levels of endogenously expressed JMJD1B and exogenously expressed JMJD1B using anti-JMJD1B antibody. JMJD1B expression levels were compared between wild-type ESCs and 4OHT-treated Quad-cKO cells expressing FLAG-JMJD1B-WT. (I) Quad-cKO cell lines expressing wild-type JMJD1B (left) or the enzymatically inactive H1561A mutant of JMJD1B (right) were cultured in the presence of 4OHT. Exogenous expression of wild-type JMJD1B rescued the growth arrest phenotype of Quad-cKO cells in the presence of 4OHT, whereas the enzymatically inactive H1561A mutant did not.
Figure 3
Figure 3
JMJD1A and JMJD1B Substantially Contribute to H3K9 Demethylation in ESCs (A) Time-course analysis of JMJD1B-depletion-induced increase in H3K9me2 in 4OHT-treated Quad-cKO cells. (B) Immunoblot analyses of H3K9 methylation levels in the indicated ESC lines. (C) The methylation levels of H3K9me1 (left), H3K9me2 (middle), and H3K9me3 (right) in the indicated ESC lines were determined by immunoblot analysis. The intensities of H3K9me signals of wild-type cells were defined as 1. Data are presented as means ± SD (n = 3 independent experiments). ∗∗p < 0.01; ∗∗∗p < 0.001 (Student's t test). (D–F) Nuclear distribution profiles of H3K9me1 (D), H3K9me2 (E), and H3K9me3 (F) in JMJD1A/JMJD1B-depleted ESCs compared with those in the wild-type ESCs. Scale bars, 5 μm.
Figure 4
Figure 4
JMJD1A/JMJD1B-Mediated H3K9 Demethylation Targets Gene-Dense Euchromatin (A) Distribution profiles of H3K9me2 along chromosome 11. The upper panel shows the number (#) of mm10 RefSeq genes smoothed with a width of 500 kb. The middle and lower panels represent the ratios of normalized read density between ChIP and whole-cell lysate (input) samples (ChIP/input) in wild-type and JMJD1A/JMJD1B-depleted cells (Quad-cKO+4OHT), respectively. The ratio of ChIP/input >1.6 is shown in orange. (B) Correlation between gene density and increased H3K9me2 levels due to JMJD1A/JMJD1B depletion. The x and y axes indicate the number of mm10 RefSeq genes and the quotient of ChIP/input of Quad-cKO+4OHT divided by ChIP/input of wild-type (WT), respectively, smoothed with a 500 kb width. The dashed lines represent regression lines. (C and D) Distribution profile of H3K9me2 in a gene-poor region (C), arrow showing the position in (A), or a gene-dense region (D), arrowhead showing the position in (A) within chromosome 11. The upper panels show the positions of the protein-coding genes, whereas lower tracks depict ChIP/input in the indicated samples.
Figure 5
Figure 5
Depletion of JMJD1A and JMJD1B Alters Gene Expression Profile in ESCs RNAs were prepared from ESCs and subjected to a microarray analysis using an Affymetrix mouse genome 430 2.0 array. (A) Hierarchical clustering analysis of gene expression profiles in wild-type cells (TT2 lines), JMJD1A-deficient cells (Quad-cKO cell lines), JMJD1B-deficient cells, and JMJD1A/JMJD1B-double-depleted cells (Quad-cKO cell lines cultured with 4OHT). The farthest distance was observed between the cluster of JMJD1A/JMJD1B-double-depleted cells and the other cell clusters, indicating that the compound depletion of JMJD1A and JMJD1B has the most prominent effect on transcription. (B) Numbers of genes affected by the JMJD1A and/or JMJD1B depletion in ESCs. Downregulated genes (<0.5-fold) and upregulated genes (>2.0-fold) due to each mutation are represented as dark and white bars, respectively. (C) Comparison of mRNA levels in the 204 genes between the indicated samples, which were downregulated by JMJD1A/JMJD1B double depletion. Heatmap analysis demonstrated that single depletion had a moderate effect on the transcription of these genes compared with double depletion. (D) Quantitative analysis of H3K9me2 levels of the genes regulated by JMJD1A and JMJD1B. Averaged increase in H3K9me2 around the gene bodies down- (blue) and upregulated (red) due to JMJD1A/JMJD1B depletion was plotted. The x axes indicate % gene length; 0% and 100% represent transcription start site and transcription end site, respectively. The y axes indicate the average of the quotient of ChIP/input of Quad-cKO+4OHT divided by ChIP/input of wild-type. (E) H3K9 methylation levels of the promoter regions of Oct3/4 (left) and Ccnd1 (right) of the indicated ESCs. (F) mRNA expression levels of Oct3/4 (left) and Ccnd1 (right) of the indicated ESCs. (G) ChIP analysis for JMJD1A at the promoter regions of Oct3/4 (left) and Ccnd1 (right) with anti-JMJD1A antibodies. (H) ChIP analysis of JMJD1B at the promoter regions of Oct3/4 (left) and Ccnd1 (right) using anti-FLAG antibody. To detect endogenous JMJD1B with anti-FLAG antibody, we established knockin ESC line carrying1b+/Flag−KI allele, in which the modified 1b allele produces JMJD1B protein with a FLAG tag at its carboxy terminus (Figure S1). For (E–H), data are presented as means ± SD from n = 3 independent experiments. p < 0.05; ∗∗p < 0.01; ∗∗∗p < 0.001 (Student's t test).
Figure 6
Figure 6
Collaborative Roles of JMJD1A/JMJD1B Demethylases and G9A Methyltransferase for Tuning the H3K9 Methylation Levels and Regulating ESC Function (A) Genotypes of the established ESC line. Hexa-cKO cell line carries alleles for the null mutation of Jmjd1a, the conditional mutation of Jmjd1b, and the conditional mutation of G9a. ESC lines lacking JMJD1A, JMJD1B, and G9A (named JGTKO-1 and JGTKO-7) were established by cloning from a pool of Hexa-cKO cells cultured in the presence of 4OHT. (B) Growth curve of Hexa-cKO cell line in the presence or absence of 4OHT. (C) JMJD1A, JMJD1B, and G9A proteins were absent in JGTKO-1 and JGTKO-7 ESC lines. Whole-cell extracts were fractionated by SDS-PAGE, and then subjected to immunoblot analysis with the indicated antibodies. (D–F) G9a mutation rescues the H3K9 overmethylation phenotype of JMJD1A/JMJD1B-double-depleted cells. H3K9me2 and H3K9me3 levels in the indicated cell lines were examined by immunoblot analysis (D) and summarized (E and F, respectively). The intensities of H3K9me signals of Quad-cKO + 4OHT were defined as 1. Data are presented as means ± SD from n = 3 independent experiments. ∗∗∗p < 0.001 (Student's t test). (G) Distribution profiles of H3K9me2 of JGTKO cells along chromosome 11. The top panel shows the number of mm10 RefSeq genes smoothed over 500 kb. The middle panels represent the ratios of normalized ChIP/input of ESCs of the indicated genotypes, including wild-type and JMJD1A/JMJD1B-depleted cells. The ratio of ChIP/input >1.6 is shown in orange. (H) Correlation between gene density and decreased H3K9me2 levels due to G9a mutation in JMJD1A/JMJD1B-depleted cells. The x and y axes indicate the number of mm10 RefSeq genes and the quotient of ChIP/input of Quad-cKO+4OHT divided by ChIP/input of JGTKO cells, respectively, smoothed over 500 kb. Dashed lines represent regression curves.
Figure 7
Figure 7
G9a Mutation Rescues JMJD1A/JMJD1B-Depletion-Induced Transcriptional Downregulation (A) Comparison of average expression levels of 204 genes that were downregulated by JMJD1A/JMJD1B depletion between the mutant ESCs. Introduction of G9a mutation in JMJD1A/JMJD1B-deficient background significantly restored the expression levels of those genes. ∗∗∗p < 0.001 (Student's t test). (B and C) JMJD1A/JMJD1B and G9A antagonistically tune the H3K9 methylation levels of Oct3/4 and Ccnd1 to ensure accurate transcription. (B) The H3K9me2 levels in the promoter regions of Oct3/4 (left) and Ccnd1 (right) were examined by performing ChIP-qPCR analyses. Increased H3K9me2 levels in these genes in JMJD1A/JMJD1B-double-depleted cells were rescued by G9A depletion. (C) The expression levels of Oct3/4 (left) and Ccnd1 (right) were examined by RT-qPCR analyses. Reduced expression levels of these genes in JMJD1A/JMJD1B-double-depleted cells were rescued by G9A depletion. mRNA expression levels of wild-type cells were defined as 1. For (B) and (C), data are presented as means ± SD. n = 3 independent experiments. p < 0.05; ∗∗p < 0.01; ∗∗∗p < 0.001 (Student's t test). (D) Schematic representation of the roles of JMJD1A/JMJD1B in ESCs. JMJD1A/JMJD1B ensure cell viability and transcriptional accuracy by antagonizing G9a-mediated H3K9 overmethylation in gene-rich euchromatin in ESCs. In wild-type ESCs, JMJD1A/JMJD1B preferentially remove H3K9 methylation marks from gene-rich euchromatin. The compound loss of JMJD1A/JMJD1B results in G9a-mediated H3K9 overmethylation in euchromatin, thereby inducing cell death and impaired gene expression.

References

    1. Abe Y., Rozqie R., Matsumura Y., Kawamura T., Nakaki R., Tsurutani Y., Tanimura-Inagaki K., Shiono A., Magoori K., Nakamura K. JMJD1A is a signal-sensing scaffold that regulates acute chromatin dynamics via SWI/SNF association for thermogenesis. Nat. Commun. 2015;6:7052. - PMC - PubMed
    1. Copeland N.G., Jenkins N.A., Court D.L. Recombineering: a powerful new tool for mouse functional genomics. Nat. Rev. Genet. 2001;2:769–779. - PubMed
    1. Feldman N., Gerson A., Fang J., Li E., Zhang Y., Shinkai Y., Cedar H., Bergman Y. G9a-mediated irreversible epigenetic inactivation of Oct-3/4 during early embryogenesis. Nat. Cell Biol. 2006;8:188–194. - PubMed
    1. Ferry L., Fournier A., Tsusaka T., Adelmant G., Shimazu T., Matano S., Kirsh O., Amouroux R., Dohmae N., Suzuki T. Methylation of DNA ligase 1 by G9a/GLP recruits UHRF1 to replicating DNA and regulates DNA methylation. Mol. Cell. 2017;67:550–565.e5. - PubMed
    1. Greer E.L., Shi Y. Histone methylation: a dynamic mark in health, disease and inheritance. Nat. Rev. Genet. 2012;13:343–357. - PMC - PubMed

Publication types

MeSH terms