. 2018 Apr 10;10(4):1267-1281.
doi: 10.1016/j.stemcr.2018.02.003. Epub 2018 Mar 8.

Gene Correction Reverses Ciliopathy and Photoreceptor Loss in iPSC-Derived Retinal Organoids from Retinitis Pigmentosa Patients

Affiliations

Gene Correction Reverses Ciliopathy and Photoreceptor Loss in iPSC-Derived Retinal Organoids from Retinitis Pigmentosa Patients

Wen-Li Deng et al. Stem Cell Reports. .

Erratum in

Abstract

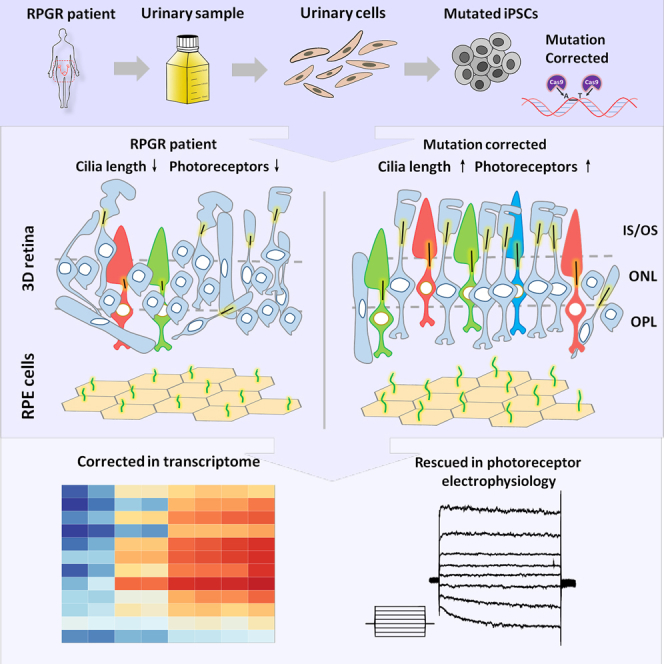
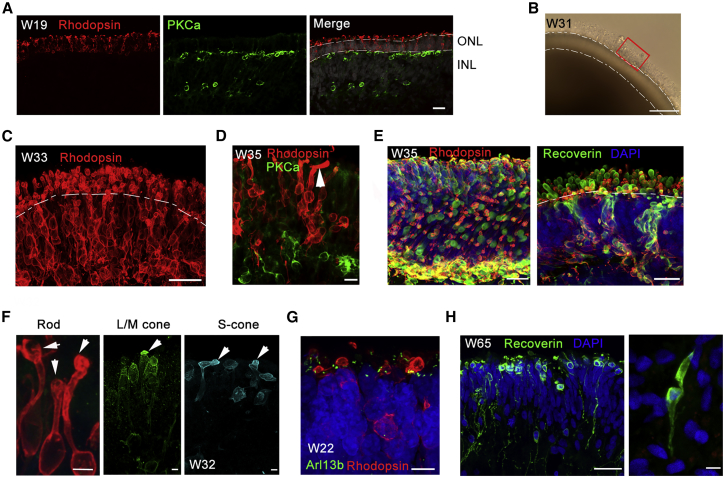
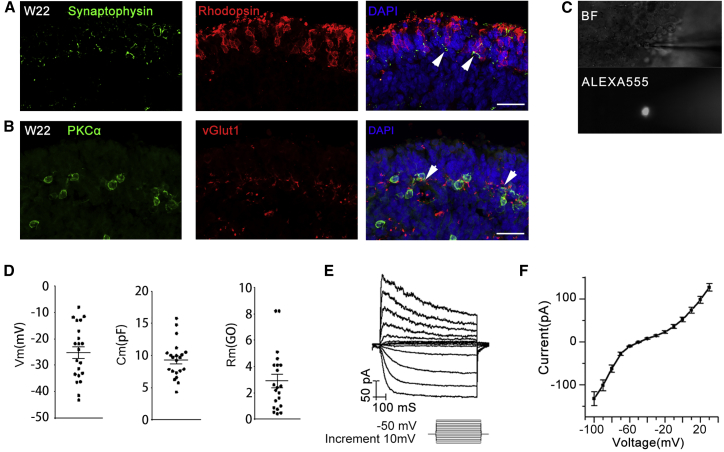
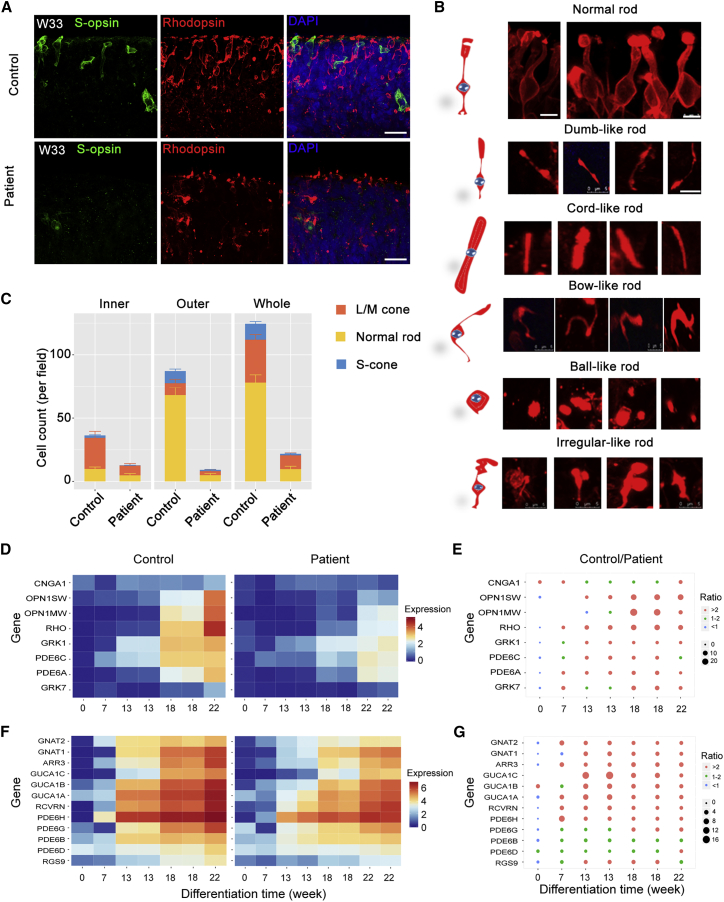
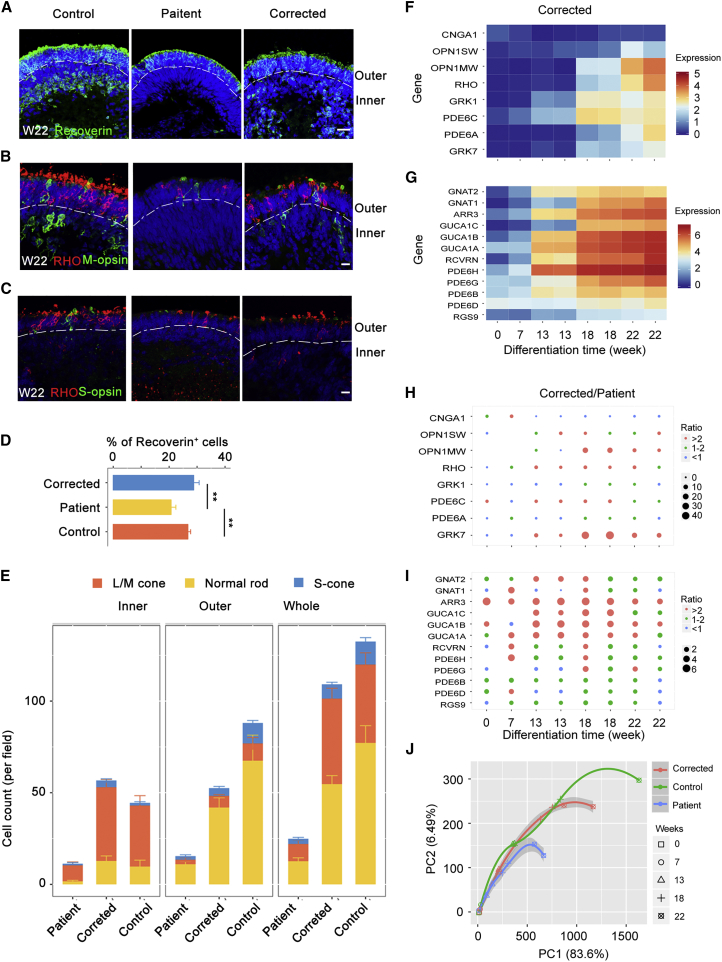
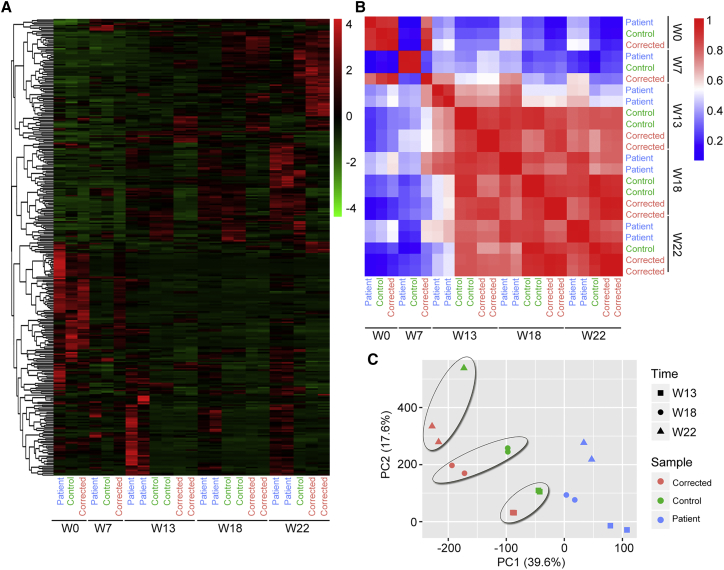
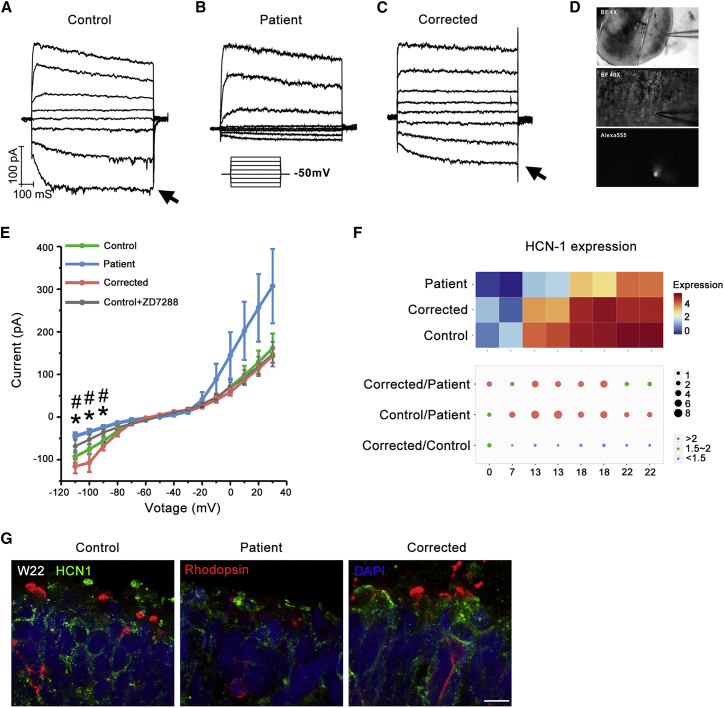
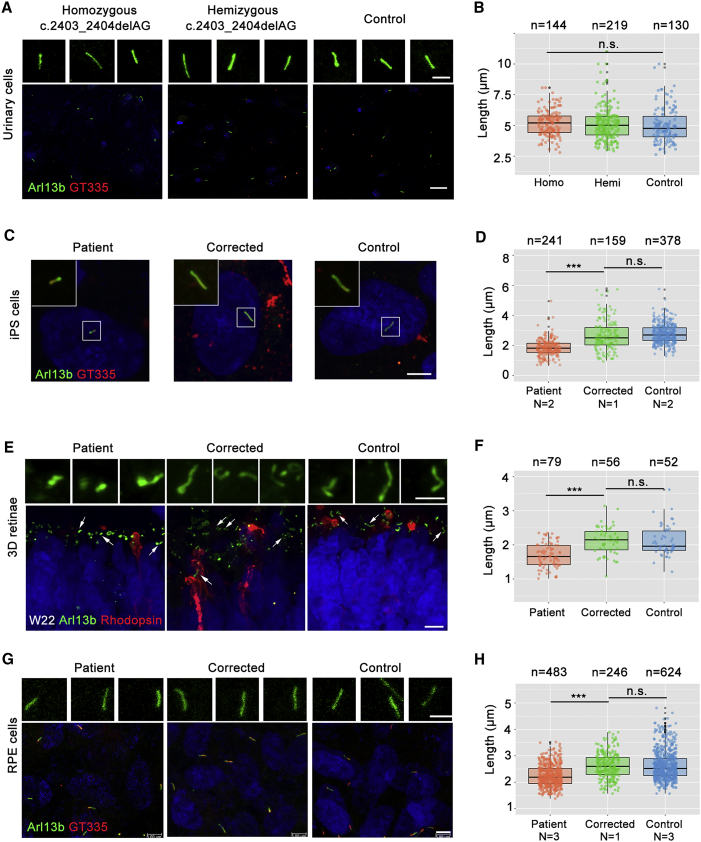
Retinitis pigmentosa (RP) is an irreversible, inherited retinopathy in which early-onset nyctalopia is observed. Despite the genetic heterogeneity of RP, RPGR mutations are the most common causes of this disease. Here, we generated induced pluripotent stem cells (iPSCs) from three RP patients with different frameshift mutations in the RPGR gene, which were then differentiated into retinal pigment epithelium (RPE) cells and well-structured retinal organoids possessing electrophysiological properties. We observed significant defects in photoreceptor in terms of morphology, localization, transcriptional profiling, and electrophysiological activity. Furthermore, shorted cilium was found in patient iPSCs, RPE cells, and three-dimensional retinal organoids. CRISPR-Cas9-mediated correction of RPGR mutation rescued photoreceptor structure and electrophysiological property, reversed the observed ciliopathy, and restored gene expression to a level in accordance with that in the control using transcriptome-based analysis. This study recapitulated the pathogenesis of RPGR using patient-specific organoids and achieved targeted gene therapy of RPGR mutations in a dish as proof-of-concept evidence.

Keywords: RPE cells; RPGR; ciliopathy; cilium; disease modeling; electrophysiology; patient-derived iPSCs; photoreceptor; retinal organoid; retinitis pigmentosa.


Figures

None
Graphical abstract
Figure 1
Figure 1
Generation of 3D Retinal Organoids Derived from Control iPSCs with OS-like Structure (A) A polarized structure was formed in which Rhodopsin-positive cells represented the outer nuclear layer, and PKCα-positive cells represented an inner nuclear layer at W19 of the control optic cups. Rhodopsin and PKCα are rod and rod bipolar cell markers, respectively. Scale bar, 20 μm. (B) Bright-field image of a 3D retinal organoid at W31. A red rectangle indicates the OS-like structure on the apical side of the organoid. Scale bar, 100 μm. (C) Rhodopsin-expressing rod cells align on the apical side with a lined OS. Vibratome section. Scale bar, 25 μm. (D) Extended OS of rod photoreceptor (arrow) demonstrates the maturation of photoreceptor cells. Scale bar, 10 μm. (E) Immunostaining of Rhodopsin and Recoverin illustrates the structure of photoreceptor cells in a vibratome section of the control optic cups at W35. Scale bar, 25 μm. (F) Amplified photoreceptor cells expressing rod (Rhodopsin) and cone (L/M-opsin, S-opsin) cell markers. Arrows, OSs. Scale bar, 5 μm. (G) The cilium marker Arl13b reveals the location of connecting cilia, with Rhodopsin+ rod cells. Scale bar, 7.5 μm. (H) Long-term culture (W65) of 3D retinae promotes the extension of photoreceptor/cone bipolar axons (left) and cone photoreceptor OS (right). Scale bar, 25 μm (left) and 5 μm (right).
Figure 2
Figure 2
Mature 3D Retinal Organoids Derived from Control iPSCs with Synaptic Connection and Electrophysiological Properties (A and B) Synaptic-specific protein, Synaptophysin, and vGlut1 expression indicates the formation of a connection between rod photoreceptor cells (A, arrows indicate the overlap of Rhodopsin and Synaptophysin) and bipolar cells (B, arrows indicate the overlap of PKCα and vGlut1). Scale bar, 25 μm. (C–F) Examination of the electrophysiological properties of the OS-containing photoreceptor cells in 3D retinal organoid at W24. (C) Representative bright-field (BF) and fluorescent (filled with Alexa 555) images of a recorded cell located at the outer layer of the control iPSC-derived 3D retinal organoid. (D) Resting membrane potential (Vm, left, without junction potential correction), membrane capacitance (Cm, middle), and membrane resistance (Rm, right) of recorded cells. Each black dot represents an individual cell (n = 21). (E) Representative trace of typical current responses of OS-containing photoreceptor cell elicited by a series of voltage steps from −100 mV to 30 mV with a 10 mV increment. (F) Average I-V curve obtained from control iPSC-derived OS-containing photoreceptor cells (n = 21). Results are pooled from three independent experiments. Data are presented as mean value ±SEM.
Figure 3
Figure 3
Patient 3D Retinal Organoids Show Diseased Photoreceptors (A) Immunostaining of the rod marker Rhodopsin (red) and the S-cone marker S-opsin (green) shows significant differences in cell morphology and cell counts in retinal organoids at W33. The same phenomenon has been observed in the L/M-cone (see also Figures S3G and S3I). Scale bar, 25 μm. (B) Photoreceptor abnormalities can be observed in patient iPSC-derived 3D retina. Five subtypes of abnormal rod photoreceptors are identified based on the morphology. Scale bar, 5 μm. (C) Comparison of photoreceptor counts in inner, outer, and whole-patient and control retinal organoids. Orange, yellow, and blue represent L/M-cones, normal rods, S-cones respectively. n = 3 organoids for each cell type. Data are from three independent experiments. (D and F) Heatmaps illustrate the gene expression profile of retina-related genes at different organoid stages containing RNA-seq dataset at week 0, 7, 13, 18, and 22. Most of the genes exhibited elevated expression in control retinae compared with that of the patient from week 7. Different colors represent the value of In (FPKM [fragments per kilobase of transcript per million mapped reads] + 1). (E and G) The size of the dot represents the FPKM ratio of control to patient. The genes correspond with those in D and F. Significant differences can be observed in photoreceptor-associated genes. Orange dots, >2 fold change; green dots, 1–2 fold change; blue dots, <1 fold change.
Figure 4
Figure 4
RPGR Gene Correction Restores Photoreceptor Defects (A and D) The number of Recoverin-positive cells is lower in patient 3D retinae than in normal and corrected retinae at W22. Scale bar, 25 μm. n = 3 organoids for each cell type. Data are from three independent experiments. Statistical significance was determined using Student's t test, ∗∗p < 0.01. (B and C) The number of L/M-cones, S-cones, and normal rods is greater in corrected and control retinal organoids than in patient ones at W22. Scale bar, 10 μm. (E) Quantification of three types of photoreceptors in inner, outer, and whole retinal organoids. The photoreceptor number in patient 3D retinae is highly escalated by RPGR gene correction. n = 3 organoids for each cell type. Data are from three independent experiments. (F and G) Heatmaps illustrate the gene expression profile of retina-related genes in corrected 3D retinae RNA-seq dataset at indicated stages. The expression tendency of those genes is similar to the control's and widely different from the patient's (see also Figures 3D and 3F). (H and I) The size of dot represents the FPKM ratio of corrected to patient. The genes are consistent with those in heatmaps. Significant differences in photoreceptor-associated genes can be observed and similar results are found in Figures 3E and 3G. Orange dots, >2 fold changes; green dots, approximately 1–2 fold change; blue dots, <1 fold change. (J) PCA of these 20 photoreceptor-related genes shows a closer correlation between the control and corrected retinal organoids especially at the late stage of retina differentiation. However, the patient retinae show a serious delay of photoreceptor development compared with the control and corrected ones. PC1, 83.6%; PC2, 6.49%.
Figure 5
Figure 5
The RPGR Gene Mutation Affects RNA Expression in the Late Stage of Patient Retinal Organoids (A) Hierarchical cluster based on gene expression in each sample. Heatmap shows simplified transcriptome variations between the patient 1, control 1, and corrected 1 retinal organoids at W0, W7, W13, W18, and W22. Two biological replicates were performed for the patient and corrected samples at W13, W18, and W22 and for the control samples at W13 and W18. (B) Heatmap showing Pearson's correlation between patient, control, and corrected retinal organoids at different time points. (C) PCA of 314 genes that significantly changed in control and corrected retinal organoids in comparison with patient ones (fold change >2 or <2) showing a closer correlation between the control and corrected retinal organoids at W13, W18, and W22. PC1, 39.6%; PC2, 17.6%.
Figure 6
Figure 6
Genetic Correction Restored Hyperpolarization-Activated Potassium Current (Ih) in Cells from Patient Retinal Organoids at W36 (A–C) Representative traces of current responses elicited by a series of voltage steps from −110 mV to 30 mV with a 20 mV increment (protocol shown as inset). Notice Ih (arrow) in cells recorded from control retinal organoids (A), which was absent from patient ones (B) and restored in corrected ones (C). (D) BF and fluorescent (filled with Alexa 555) images of a recorded cell located at the outer layer of retinal organoids. (E) Comparison of I-V curves of cells recorded from control 1 (blue, n = 24), patient 1 (orange-red, n = 21), and corrected 1 retinal organoids (green, n = 15). Ih, activated between −80 mV and −110 mV, was significantly larger in cells from control and corrected organoids, and markedly reduced by the application of 40 M HCN blocker ZD7288 (wild-type [WT] + ZD7288, gray). Asterisk (), patient retinal organoids significantly different from control and corrected. Hash (#), significant difference between WT and WT + ZD7288. Results are pooled from three independent experiments. Data are presented as mean ± SEM. Statistical significance was determined using unpaired t test. (F) Heatmaps illustrate the gene expression profile of HCN-1 in RNA-seq dataset at week 22. Different colors represent the value of log2 (FPKM+1). The size of dot represents the FPKM ratio of corrected to patient, control to patient, and corrected to control. Orange dots, >2 fold changes; green dots, approximately 1.5–2 fold change; blue dots, <1.5 fold change. (G) Sample images of the immunostaining of patient, corrected, and control retinal organoids at W22. Scale bar, 7.5 μm.
Figure 7
Figure 7
RPGR Gene Correction Rescues Cilium Elongation (A, C, E, and G) Representative immunofluorescence images stained with cilium marker, GT335 (red) and Arl13b (green). (B, D, F, and H) Quantification of cilia length presented in (A), (C), (E), and (G), respectively. All cell numbers counted in each group are obtained from three independent experiments and shown above the graphs. Color dots indicate each cilium, black dots indicate the deviation of the data, and the three horizontal black lines represent the upper quartile, the median, and the lower quartile respectively. ∗∗∗p < 0.001, n.s., not significant, unpaired t test. (A) Urinary cells from a nuclear family of RPGR mutation, including homozygote (patient 3), hemizygote (patient 3’s mother), and familial control (patient 3’s father). Scale bar, 5 μm (up) and 25 μm (down). (C) Scale bar, 5 μm. (D) The cilia lengths of iPSCs of control 1, control 2, patient 1, patient 2, and corrected 1 are presented. Donor numbers are indicated with N below the graphs. (E) Arrows indicate the magnified cilia showing above. Scale bar, 2 μm (up) and 7.5 μm (down). (F) n = 3 organoids for each cell type. (G) Scale bar, 2.5 μm (up) and 5 μm (down). (H) The cilia lengths of iPSC-derived RPE of three controls, three patients, and corrected 1 are measured. Donor numbers are indicated with N below the graphs.

Comment in

  • Gene corrections in sight.
    Weber C. Weber C. Nat Cell Biol. 2018 Jun;20(6):634. doi: 10.1038/s41556-018-0117-0. Nat Cell Biol. 2018. PMID: 29784915 No abstract available.

References

    1. Brunner S., Skosyrski S., Kirschner-Schwabe R., Knobeloch K.P., Neidhardt J., Feil S., Glaus E., Luhmann U.F., Rüther K., Berger W. Cone versus rod disease in a mutant Rpgr mouse caused by different genetic backgrounds. Invest. Ophthalmol. Vis. Sci. 2010;51:1106–1115. - PubMed
    1. Cangiano L., Asteriti S., Cervetto L., Gargini C. The photovoltage of rods and cones in the dark-adapted mouse retina. J. Physiol. 2012;590:3841–3855. - PMC - PubMed
    1. Cheong C., Sung Y.H., Lee J., Choi Y.S., Song J., Kee C., Lee H.W. Role of INK4a locus in normal eye development and cataract genesis. Mech. Ageing Dev. 2006;127:633–638. - PubMed
    1. Daiger, S.P., Sullivan, L.S., and Rossiter, B.J.F. (2013). RetNet. The Retinal Information Network. https://sph.uth.edu/retnet/.
    1. Eiraku M., Takata N., Ishibashi H., Kawada M., Sakakura E., Okuda S., Sekiguchi K., Adachi T., Sasai Y. Self-organizing optic-cup morphogenesis in three-dimensional culture. Nature. 2011;472:51–56. - PubMed

Publication types

MeSH terms