

doi: 10.1080/2326263X.2017.1307625.
Epub 2017 Apr 10.
Therapeutic Applications of BCI Technologies
Affiliations
- PMID: 29527538
- PMCID: PMC5843196
- DOI: 10.1080/2326263X.2017.1307625
Item in Clipboard
Therapeutic Applications of BCI Technologies
Brain Comput Interfaces (Abingdon).
2017.
Abstract
Brain-computer interface (BCI) technology can restore communication and control to people who are severely paralyzed. There has been speculation that this technology might also be useful for a variety of diverse therapeutic applications. This survey considers possible ways that BCI technology can be applied to motor rehabilitation following stroke, Parkinson's disease, and psychiatric disorders. We consider potential neural signals as well as the design and goals of BCI-based therapeutic applications. These diverse applications all share a reliance on neuroimaging and signal processing technologies. At the same time, each of these potential applications presents a series of unique challenges.
Figures
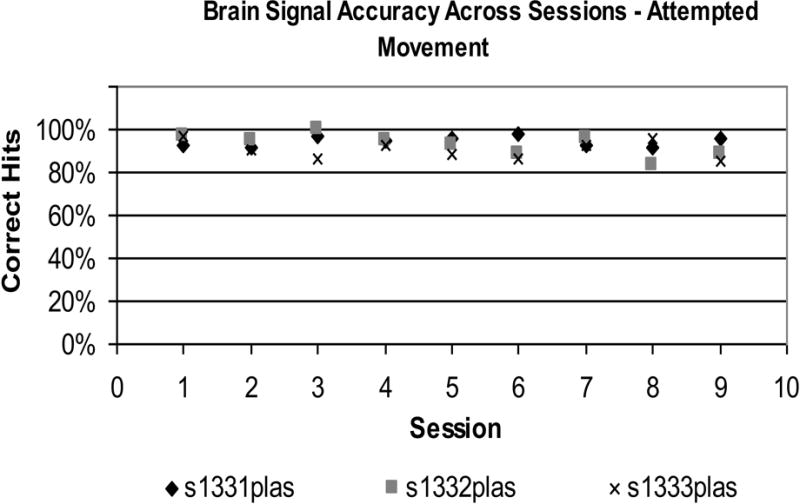
Accuracy of sensorimotor rhythm (SMR) control across 9 training sessions for 3 subjects performing the imagined wrist/hand task (A), the attempted wrist/hand task (B), or the relaxation task (C). In A and B, accuracy is high throughout, almost always falling in the range 80-100%. In C, accuracy is slightly lower but remains in the range 70-100% except for 2 of the 27 sessions. (Modified from [4]).

Schematic Example of Motor-Related Cortical Potential (MRCP), Electromyographical Signal (EMG), and Event Identification. Onset MRCP is identified as signal deviation at least 1 std from the resting state mean for at least 100ms. Onset of motor activity is identified from EMG signal deviation at least 1 std from the resting state mean for at least 100ms. Planning time is calculated as the difference in the two latencies’ onset. MRCP amplitude is the value of the MRCP peak minus the mean resting value.
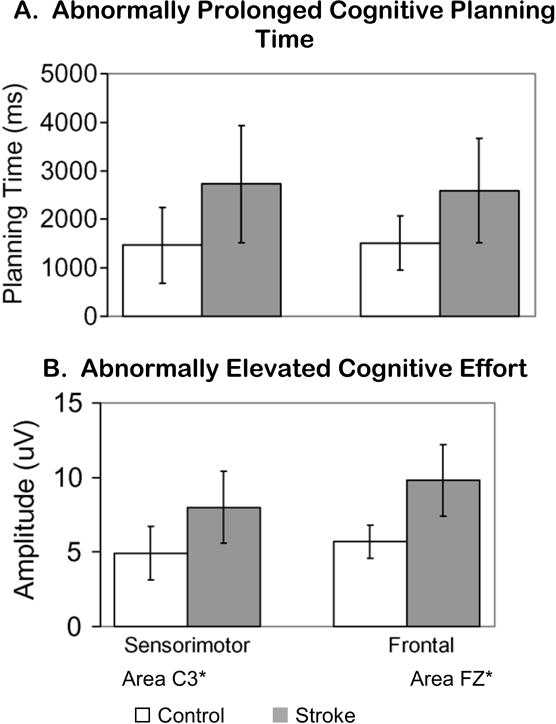
For both A and B, horizontal axis is cortical electrode location: C3 for sensorimotor area or Fz for frontal area. (A) Vertical axis is planning time in milliseconds, during a shoulder/elbow reach task. In both sensorimotor and frontal regions, cognitive planning time was abnormally prolonged for stroke (shaded bars) versus healthy controls (white bars). (B) Vertical axis is amplitude of cortical signal. In both sensorimotor and frontal regions, amplitude was abnormally elevated for stroke (shaded bars) versus healthy controls (white bars). Reprinted from [45].

a. Use of EEG-based MRCP Latency Measures To Show Difference In Pre- Versus Post-treatment Planning Time (due to the small case series, caution should be used in interpreting results; this is an example, only (b) Use of EEG-based MRCP signal amplitude to show difference in Pre- versus post-treatment signal amplitude. (due to the small case series, caution should be used in interpreting results; this is an example, only). Signal was measured at the C3 electrode, during shoulder/elbow reach. Reprinted from [45].

Example of EEG-derived spectral power and signal feature selection for BCI system. (a) Brain signal at CP3 and CP6 electrodes at 21 to 24 HZ produced a usable signal for motor training. This level of brain activity is illustrated according to R2, which is a measure without units, and the vertical bar shows the range of R2. The brain map shows signed R2 = −0.10 (at 21 – 24 Hz) for the CP3 electrode region during attempted right finger extension (shown by the more dense color region in the left, lesioned hemisphere). In the right hemisphere, the signed R2 value was −0.12 (at 21 to 24 Hz) for the CP6 electrode (right, non-lesioned hemisphere. (b) Relationship of the CP3 electrode to the left hemisphere lesion (red outlined region). In this case, the lesion from stroke was in the left hemisphere, resulting in right arm coordination impairment. Therefore, brain training was needed for the left hemisphere, targeted to enhance function in the paretic right arm. For the BCI system, we selected the CP3 electrode in the left hemisphere and at the frequency band of 21 to 24 Hz, because of its proximity to the normal region of control for the right arm and the fairly robust signal in that power spectrum (with permission from [113], figure 2).

MRCP signal amplitude is higher and earlier for eccentric vs concentric muscle contractions. F, frontal; C, central; P, parietal; T, temporal; O, occipital; Z, middle; Reprinted from [46].
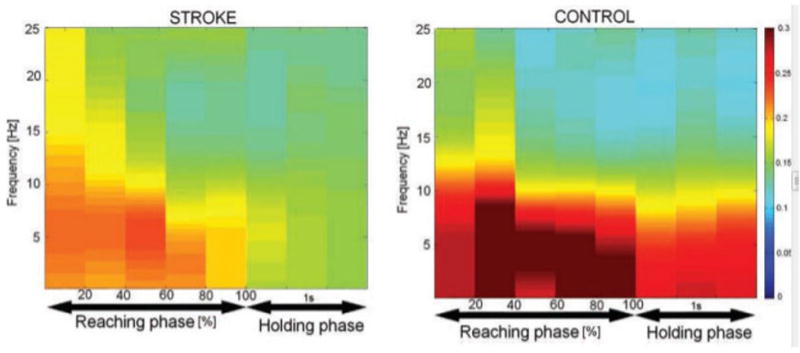
EEG-EMG Connectivity. Group-averaged corticomuscular coherence between brain regions (columns) and muscles (rows) of the blue graphs. EEG signal was from parietal, central, frontal, left whole brain (non-lesioned side for stroke) and right whole brain (lesioned side for stroke). EMGs were from anterior deltoid, triceps brachii, and biceps brachii muscles. Rows of blue plots: For each of the three muscles, the upper row shows coherence with the scalp areas for the controls and the lower row for stroke. For each plot in each row or column, the y-axis is signal frequency, the x-axis is time, and the color bar indicates the level of coherence (red, higher level; blue, lower level). The figure shows that stroke patients had no significant corticomuscular coherence at the higher-frequency band (30–50 Hz). (For more detailed interpretation of the references to color in this figure legend, the reader is referred to the web version of this paper.) (with permission from [46]).

For 23 stroke survivors and five regions of interest (ROI’s), correlations are shown between upper limb motor function task performance (Arm Motor Abilities Test (AMAT) and each of two different brain measures during a shoulder/elbow reach task. Brain measures are shown as either brain volume of activation (from fMRI BOLD signal, voxel count, shown as the symbol ‘o’) or intensity of brain activation (from fMRI BOLD signal, amplitude, shown as the symbol ‘x’,). Correlations ranged from .43 to .75. The AMAT is composed of 13 complex upper limb functional tasks such as pick up the knife and fork and cut the meat, button your sweater, and comb your hair) (With permission from [114]). Key: M1 – Primary motor SS – Somatosensory LPM – Lateral premotor SMA – Supplementary motor area PP – Posterior parietal area AMAT – Arm Motor Abilities Test (timed and summed for 13 complex functional tasks requiring shoulder/elbow movements, converted to z-score) O – voxel count score derived from fMRI during shoulder/elbow functional reach task, for each of the relevant ROI’s shown, converted to z-score X - signal intensity derived from fMRI during shoulder/elbow functional reach task,for each of the relevant ROI’s shown, z-score

The left hemisphere M1 Centroids (Ipsilesional Hemisphere) for all study subjects (healthy control (green cubes) and stroke (red cubes) subjects) in relationship to the average control group centroid (black sphere), during a functional reach task and fMRI data acquisition. The actual location within M1 for the sphere (average control centroid) in MNI coordinates is as follows: med/lat, × = −31; ant/post y = −26; caudal/rostral z = 61; the relative Euclidean distances between the individual squares and the sphere are within relative scale to each other. The ‘walls’ of the figure are provided to give visual assistance to the 3-D effect, and are not intended to be in a particular scale. Reprinted from [114].

Six participants attempted volitional modulation of subthalamic beta-band oscillatory power; they were instructed to increase power to turn a sphere orange and to decrease power to turn a sphere blue. Top: Difference of spectrograms (last 5 orange trials - last 5 blue trials) averaged across the six participants. The colored bar is in dB. Bottom: Average power from the time-frequency window indicated in the top panel for each trial. The solid line is the mean across participants and the dashed line is the mean +/− the standard error. Beta power appeared to diverge between “Orange” and “Blue” cued trials after 6 trials of each class.
References
-
- Wolpaw JR, Birbaumer N, McFarland DJ, Pfurtscheller G, Vaughan TM. Brain-computer interfaces for communication and control. Clin Neurophysiol. 2002;113:767–791. - PubMed
-
- Wolpaw JR, Wolpaw EW. Brain-computer interfaces: something new under the sun. In: Wolpaw JR, Wolpaw EW, editors. Brain-Computer Interfaces: Principles and Practice. New York: Oxford University Press; 2012. pp. 3–14.
-
- Daly JJ, Wolpaw JR. Brain-computer interfaces in neurological rehabilitation. Lancet Neurol. 2008;7:1032–1043. - PubMed
-
- Daly JJ, Sitaram R. BCI Therapeutic applications for improving brain function. In: Wolpaw RR, Wolpaw EW, editors. Brain-Computer Interfaces: Principles and Practice. New York: Oxford University Press; 2012. pp. 351–362.
Grants and funding
LinkOut - more resources
Full Text Sources
Other Literature Sources