. 2018 Mar 12:7:e26016.
doi: 10.7554/eLife.26016.

Nociceptive interneurons control modular motor pathways to promote escape behavior in Drosophila

Affiliations

Nociceptive interneurons control modular motor pathways to promote escape behavior in Drosophila

Anita Burgos et al. Elife. .

Abstract

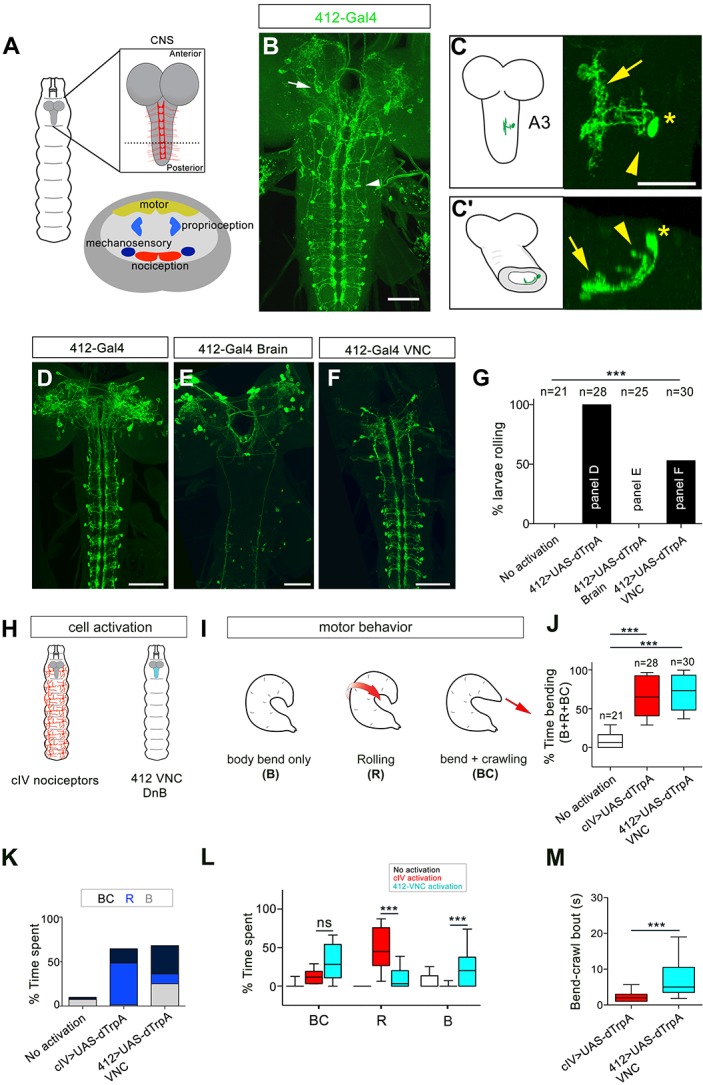
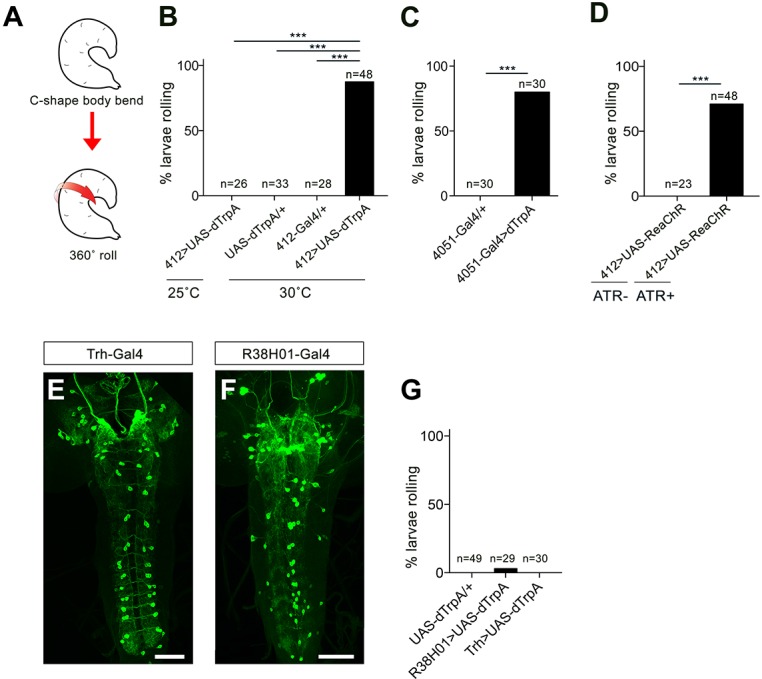
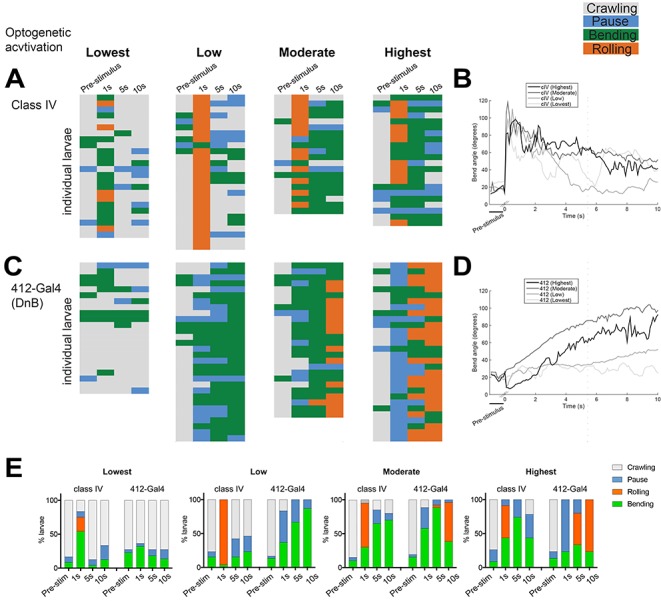
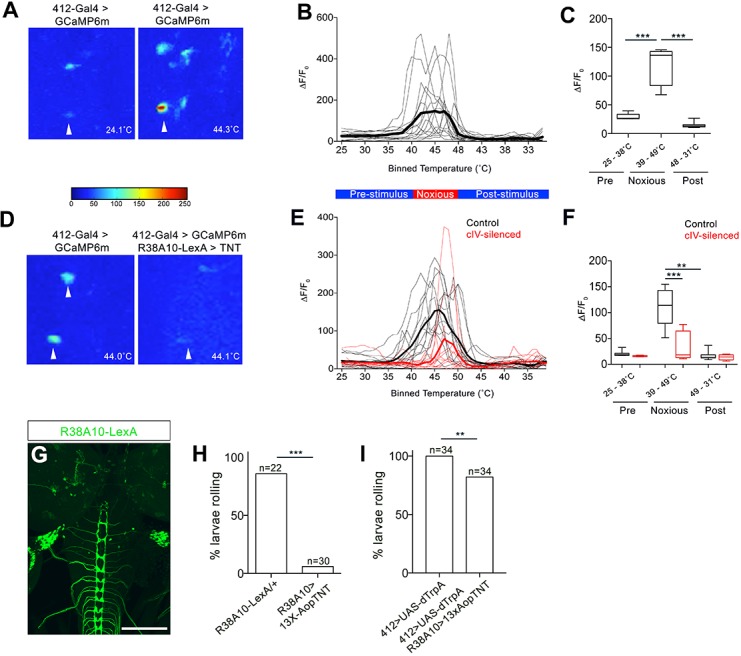
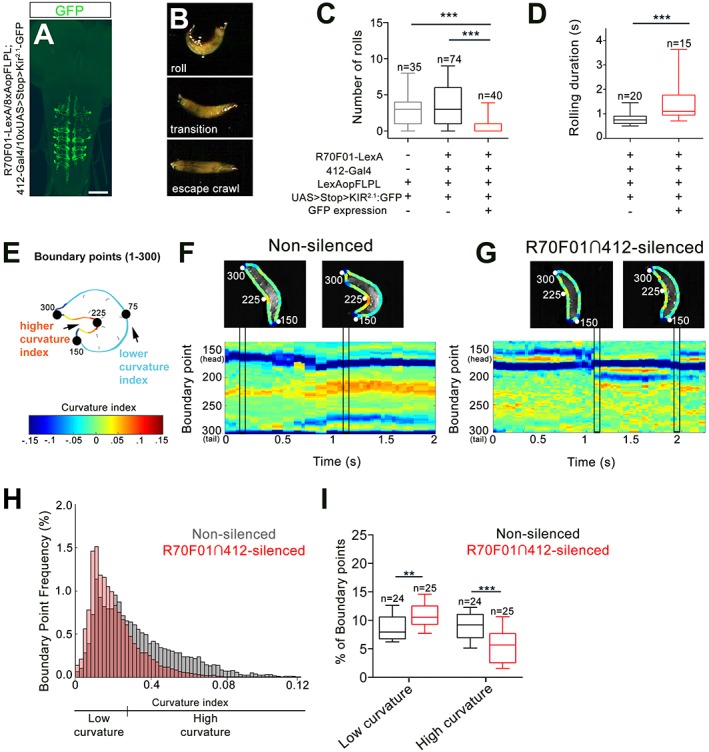
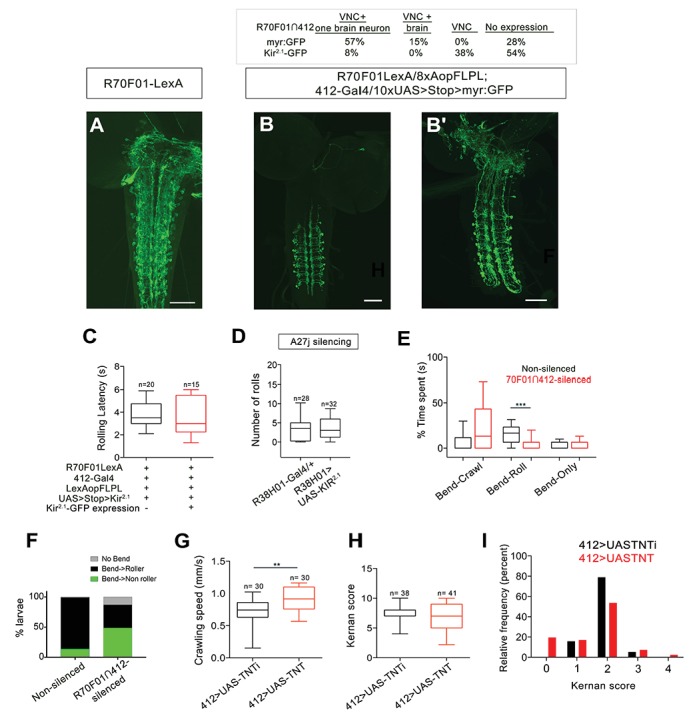
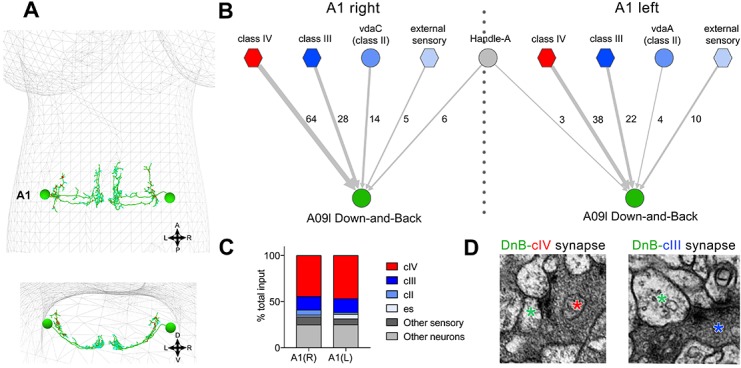
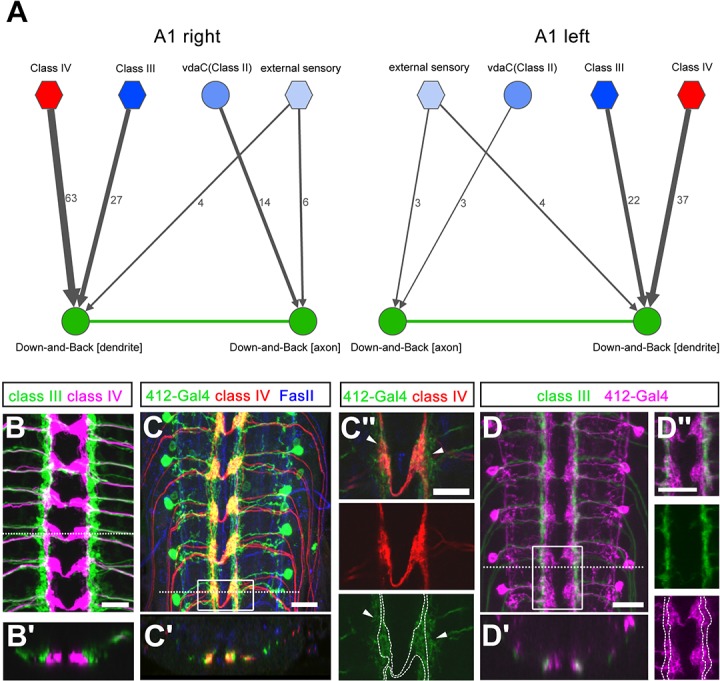
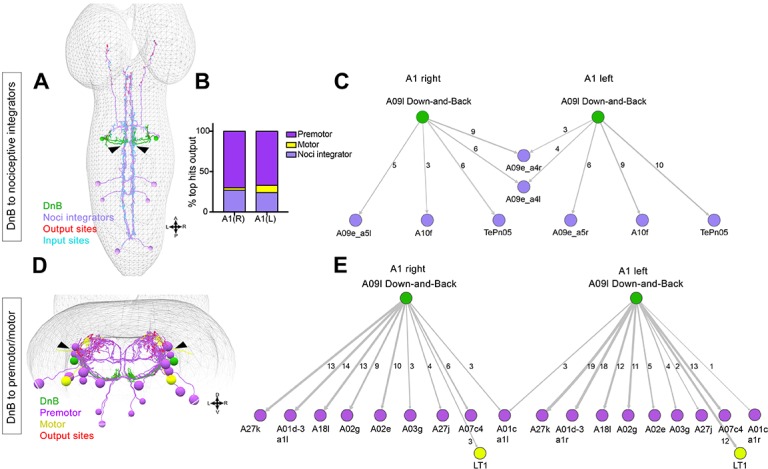
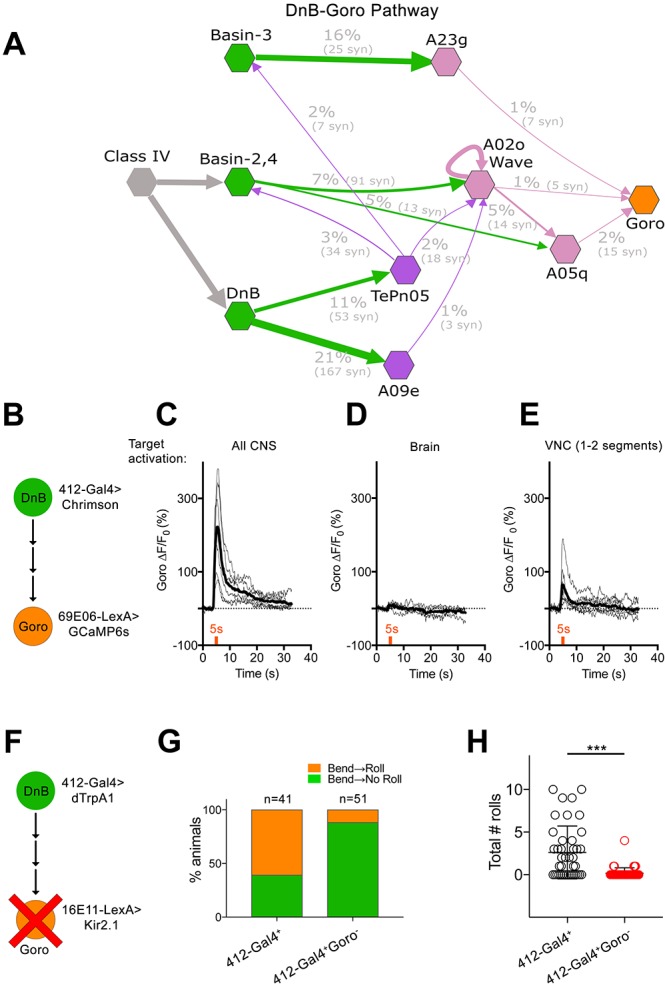
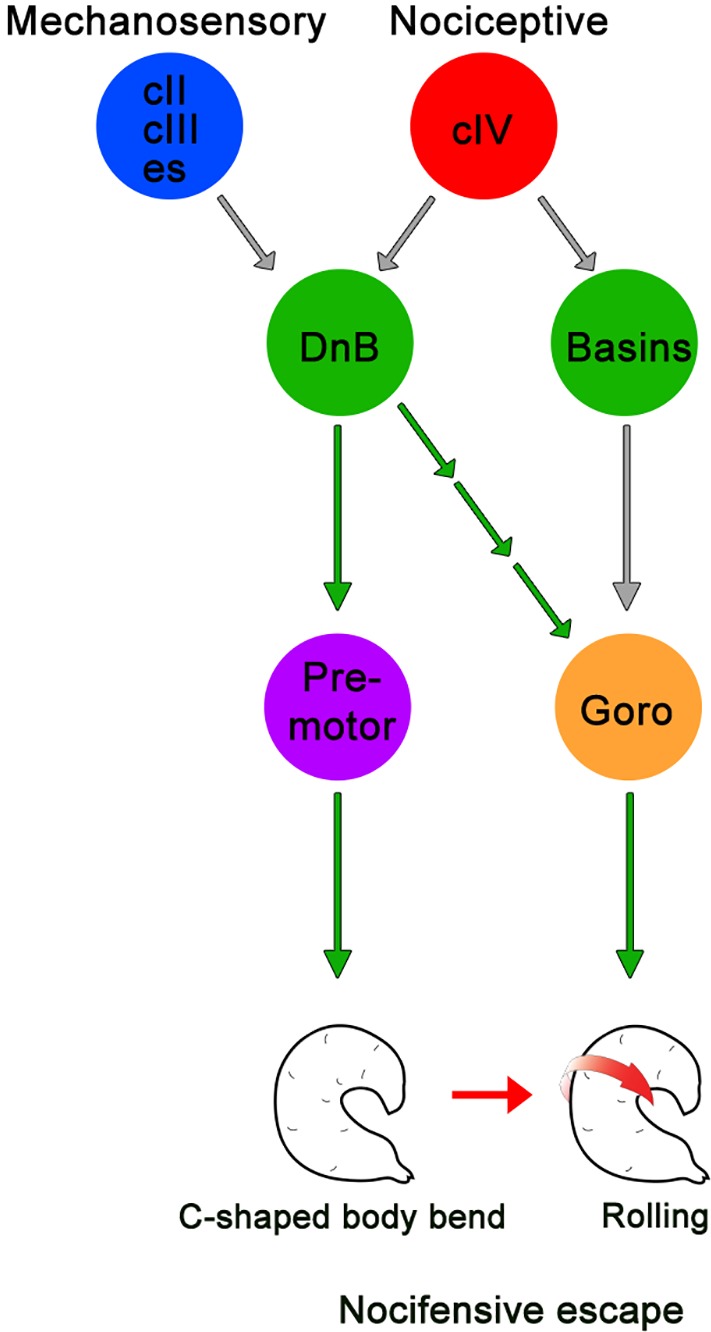
Rapid and efficient escape behaviors in response to noxious sensory stimuli are essential for protection and survival. Yet, how noxious stimuli are transformed to coordinated escape behaviors remains poorly understood. In Drosophila larvae, noxious stimuli trigger sequential body bending and corkscrew-like rolling behavior. We identified a population of interneurons in the nerve cord of Drosophila, termed Down-and-Back (DnB) neurons, that are activated by noxious heat, promote nociceptive behavior, and are required for robust escape responses to noxious stimuli. Electron microscopic circuit reconstruction shows that DnBs are targets of nociceptive and mechanosensory neurons, are directly presynaptic to pre-motor circuits, and link indirectly to Goro rolling command-like neurons. DnB activation promotes activity in Goro neurons, and coincident inactivation of Goro neurons prevents the rolling sequence but leaves intact body bending motor responses. Thus, activity from nociceptors to DnB interneurons coordinates modular elements of nociceptive escape behavior.

Keywords: D. melanogaster; behavior; interneuron; larva; neuroscience; nociception; sensory circuit; sensory neuron.


Conflict of interest statement

AB, KH, TO, CQ, GS, DG, MS, WT, MZ, AC, WG No competing interests declared

Figures

Figure 1.
Figure 1.. Identification of candidate nociceptive interneurons.
(A) Schematic showing the Drosophila larval CNS. Red scaffold represents class IV (cIV) projections. Enlarged transverse section through ventral nerve cord (VNC) is shown below. Color-coded regions depict modality specific locations where sensory axons terminate and motor neuropil. (B) 412-Gal4 drives expression in interneurons in the VNC (arrowhead) and neurons in the brain lobes (arrow), anti-dsRed, green. (C–C') Dorsal view of the morphology of DnB neuron in segment A3. Medial process is indicated by an arrow and lateral projection by an arrowhead. An asterisk marks the cell body. (C') Transverse section of neuron in C. (D–F) Intersectional strategy to target GFP either to D) the brain and VNC, (E) brain only or F) VNC only. Green channel shows anti-GFP labeling. (G) Percent exhibiting nocifensive rolling during dTrpA1 activation of subsets of 412-Gal4 neurons corresponding to panels D-F. (H) Schematic of cIV nociceptors (left) and location of 412-Gal4 VNC neurons (right). (I) Schematic of different motor behaviors observed in response to cIV or 412-Gal4 VNC activation. Body bend only, B, larvae entered a curved C-shape but did not roll or crawl; Rolling, R, animals entered C-shape and performed 360˚ rotations; Bend + crawling, BC, larvae attempted to crawl while remaining in a C-shape. Red arrows show direction of locomotion. (J) Total amount of time spent in bent-body positions (B + R + BC) upon dTrpA1-induced activation of cIV neurons and 412-Gal4 VNC neurons. (K) Percent of time upon dTrpA1 activation spent in bent-body positions with crawling (black) rolling (blue) or paused (bend-only, gray). (L) Percent of time spent during 29 s trial in bent-body positions: bend-crawl, rolling, or bend-only. (M) Plot showing length of bend-crawl bouts in seconds upon cIV or 412-Gal4 VNC activation. Box plots show median (middle line) and 25th to 75th percentiles with whiskers representing 10 to 90 percentiles. P values are indicated as *p<0.05, ***p<0.001, as determined by One-way ANOVA with Tukey’s multiple comparison’s test (J), Kruskal-Wallis with Dunn’s correction for multiple testing (L), or Mann-Whitney (M). Scale bars = 50 µm (B, D–F), 20 µm (C). (See also Figure 1—figure supplements 1–4).
Figure 1—figure supplement 1.
Figure 1—figure supplement 1.. 4051-Gal4 expression pattern.
(A) Expression pattern of 4051-Gal4. (B–B'') Co-labeling of 4051-Gal4 and 412-QF in DnB neurons (arrowheads). Some additional expression of 412-QF appeared in trachea after InSITE swapping procedure. (C) Expression of 4051-Gal4 in single hemisegment. Genotype: (A–C) UAS-mCD8GFP/+;4051-Gal4/412-Qf,QUASTdTomato/+. Scale bars = 50 µm (A); 20 µm (B–C).
Figure 1—figure supplement 2.
Figure 1—figure supplement 2.. Further analysis of 412-Gal4 expression.
(A–C') 412-Gal4, UAS-mCD8:GFP does not label cIV cell bodies or dendrites labeled by ppk-CD4-tdTomato (anti-GFP, green; anti-dsRed, red). (D) Expression of 412-Gal4 in single hemisegment. Two non-DnB cell types are labeled in 412-Gal4 pattern: A26e (arrowhead) and A27j (arrow). (E) A26e neuron, GFP channel only, Boxed region from (E): A26e cell body (arrowhead), Overlap between A26e and serotonin antibody (anti-GFP, green; anti-5HT, red) (top); 5HT staining; dsRed channel only (bottom). (F) A27j neuron, GFP channel only, Boxed region from (F): A27j cell body (arrowhead), Overlap between A27j and GABA antibody (anti-GFP, green; anti-GABA, red) (top) GABA staining, dsRed channel only (bottom). Genotypes: (A–C') ppk:CD4tdTomato/+; 412-Gal4, UAS-mCD8:GFP /+ (D–F) 412-Gal4, UAS-mCD8:GFP /+. Scale bars = 50 µm (A– C'); 20 µm (D); 10 µm (E–F).
Figure 1—figure supplement 3.
Figure 1—figure supplement 3.. DnB polarity analysis.
(A–A') 412-Gal4 driven dendritic marker, DenMark (anti-dsRed, red) localizes to medial-directed projection, and medial arbors (arrow). UAS-mCD8:GFP (anti-GFP, green) is abundant throughout all projections. FasII labels axon fascicles. Asterisk marks the cell body. (A') DenMark channel alone. (B–B') 412-Gal4-driven BRP.shortmCherry labels putative presynaptic sites sparsely in the medial domain (arrow) and strongly in the lateral domain (arrowhead; anti-dsRed, magenta). UAS-mCD8:GFP (anti-GFP, green) labels all processes. Asterisk labels the cell body. (B') BRP.shortmCherry channel alone. Genotypes: (A–A') UAS-DenMark/+; 412-Gal4, UAS-mCD8:GFP/+. (B–B') UAS-BRP.shortmCherry/+;412-Gal4, UAS-mCD8:GFP/+. Scale bars = 20 µm (A–B’).
Figure 1—figure supplement 4.
Figure 1—figure supplement 4.. 412-Gal4, 4051-Gal4, and off target activation.
(A) Schematic representation of nocifensive escape behavior, which includes C-shaped body bending and 360˚ rolls. (B) Percentage of animals exhibiting rolling behavior during dTrpA1 activation driven by 412-Gal4. (C) Percentage of animals exhibiting rolling behavior during dTrpA1 activation driven by 4051-Gal4. (D) Percentage of animals exhibiting rolling behavior with optogenetic activation of 412-Gal4 neurons using ReaChR with and without all-trans-retinal (ATR). (E) Expression pattern of Trh-Gal4 labeling serotonergic neurons. (F) Expression pattern of R38H01-Gal4 includes labeling of A27j neurons. (G) Percentage of larvae rolling upon R38H01-Gal4 or Trh-Gal4 dTrpA1. activation. *p-value<0.05, ***p- value <0.001 by Chi squared test with Bonferroni correction for cases of multiple testing. Genotypes: (B) (i) UAS-dTrpA1/+;412-Gal4/+ (ii) UAS-dTrpA1/+ (iii) 412-Gal4/+ (C) (i) 4051-Gal4/+ (ii) UAS-dTrpA/+;4051-Gal4/+(D) UAS-ReaChR/412-Gal4 (E) 20X-UAS-mCD8GFP/+;Trh-Gal4/412-QF,QUASTdTomato (F) 20X-UAS-mCD8GFP/Per-Gal4;412-Qf,QUASTdTomato/+ (G) (i) UAS-dTrpA/+ (ii) UAS-dTrpA/+;38H01-Gal4/+ (iii) UAS-dTrpA/+;Trh-Gal4/+. Scale bars: 50 μm (E–F).
Figure 2.
Figure 2.. DnBs promote bending and rolling in a dose-dependent manner.
(A, C) Behavior ethograms upon optogenetic stimulation of 412-Gal4 or class IV neurons. Groups of animals expressing ReaChR in either population were subjected to optogenetic activation at different light intensities for 10 s: Lowest (~45 Lux), Low (~200. Lux), Moderate (~850 Lux) and Highest (~1450 Lux). Behavior events are color-coded: crawling (grey), pause (blue), bending (green), and rolling (orange). (A) Behaviors triggered upon optogenetic activation of class IV neurons. Lowest, n = 24. Low, n = 26 Moderate, n = 20; Highest, n = 23. (B) Behaviors triggered upon optogenetic activation of 412-Gal4 neurons. Lowest, n = 22. Low, n = 30; Moderate, n = 26; Highest, n = 30. (C) Percent of larvae exhibiting crawling (grey), pausing (blue), rolling (orange) and bending (green) across different activation intensities. (See also Figure 2E).
Figure 3.
Figure 3.. DnBs are activated by noxious heat downstream cIV sensory neurons.
(A) Representative heat maps showing Ca2+ responses in DnB cell bodies (arrowhead) before (~24˚C) and during (~44˚C) local noxious heat stimulation of the body wall. (B) Individual Ca2+ responses (thin lines) and average of all trials (bold) represented as ∆F/F0 in DnB cell bodies (n = 15). Larvae received local heat stimulation at segment A7 using a heat probe that was increased from ~24–49˚C, then cooled to ~30˚C. (C) GCaMP signal binned for 25–38˚C (below noxious threshold), 39–49˚C (above noxious threshold), and 48–31˚C (post-stimulus cool down). (D) Representative heat maps showing Ca2+ responses in DnB cell bodies at ~44˚C (arrowhead) with or without cIVs silenced with R38A10-LexA driving TNT. (E) Individual Ca2+ responses (thin lines) and average of all trials (bold) in DnB cell bodies during heating and cooling, Black lines represent control (n = 12) and red lines represent cIV silenced trials (n = 11). (F) GCaMP signal binned for 25–38˚C (below noxious threshold), 39–49˚C (above noxious threshold), and 49–31˚C (post-stimulus cooling) for control and cIV silenced trials. (G) R38A10-LexA driven 13XlexAop2-IVS-myr::GFP labels cIV sensory neurons (anti-GFP, green) and sparse labeling of brain neurons. (H) Percent of larvae rolling in response to local noxious stimuli decreased when cIV neurons were silenced using R38A10-LexA to drive tetanus toxin light chain (TNT). (I) Percentage of animals exhibiting rolling responses when 412-Gal4 neurons were induced by dTrpA1 with and without cIV-silencing via R38A10-LexA driven tetanus toxin light chain (TNT). *p-value<0.05, **p-value<0.01, ***p- value <0.001 by Chi squared test with Bonferroni correction for cases of multiple testing (H–I). Kruskal-Wallis with Dunn’s correction for multiple testing and post-hoc Unpaired T-test or Wilcoxon test (C) or post-hoc T-test or Wilcoxon test (F). Scale bars = 70 µm (G).
Figure 4.
Figure 4.. DnBs are required for body bending during nocifensive rolling.
(A) Labeling DnB neurons using R70F01-LexA driving 8X-Aop2-FLPL, and 412-Gal4 driving 10XUAS > Stop > Kir2.1-GFP (anti-GFP, green). (B) Global heat stimulus leads to rolling (top), transition period (middle), and an increase in forward crawling speed (escape crawl; bottom). (C) Number of rolls per trial. ‘Non-silenced’ animals lacked Kir2.1-GFP expression and ‘R70F01412-silenced’ animals exhibited GFP expression. (D) Rolling duration of the 1st roll for animals that completed 360˚ rotations. (E) Schematic of larva with curvature analysis. Program outlines boundary of larval body and assigns a curvature index value at each of 300 boundary points. The curvature values are represented as a heat map along the larval body. (F) Representative kymograph showing curvature indices (CI) along C-bend (spanning boundary points 150 and 300) in non-silenced animals during the duration of the first roll. Larval images above kymographs represent CI at each boundary point position along the outline of the entire body at time points when the animal acquires a low curvature (left) or high curvature shape (right; indicated in plots as vertical tracks). (G) Representative kymograph showing curvature indices along C-bend in R70F01412-silenced animals. Kymograph is as represented in (F). (H) Frequency distribution of concave curvature indices (CI) of all boundary points across the bending duration for animals that rolled (360˚ turn) and ‘attempted’ rolling (i.e. 0–360˚ rotations) separated into low curvature (CI <0.027) and high curvature (CI >0.027) values. (I) Percentage of boundary points that fall into the category of low curvature (CI <0.027) and high curvature (CI >0.027) values. Scale bar = 50 µm (A). Box plots show median (middle line) and 25th to 75th percentiles with whiskers representing 10 to 90 percentiles. P values are indicated as *p<0.05, **p<0.01 ***p<0.001, as tested by Kruskal Wallis with Dunn’s correction followed by post hoc Mann Whitney (C), Mann-Whitney (D), or MANOVA with bonferroni correction, followed by posthoc unpaired T-test (I). (See also Figure 4—figure supplement 1).
Figure 4—figure supplement 1.
Figure 4—figure supplement 1.. Intersectional labeling strategy, effect of silencing A27j neurons and effect of silencing 412-Gal4 neurons on somatosensory behavior.
(A) R70F01-LexA driven 13XLexAop2-IVS-myr::GFP labels DnBs and additional VNC and brain neurons (anti-GFP, green). (B–B') Chart showing distribution of expression patterns using R70F01412 to drive either myr:GFP or Kir2.1-GFP. Representative images showing R70F01412 driving myr:GFP: DnB labeling (with one brain neuron) (B) and DnB neurons labeled along with sparse labeling of brain neurons (B'). (C) Latency to initiate first roll during global heat stimulus in non-silenced and R70F01412-silenced animals. (D) Silencing A27j neurons using R38H01-Gal4 to drive Kir2.1 does not reduce rolling. (E) Percent of time non-silenced and R70F01412-silenced animals spent engaging in bend-crawling, rolling, or bend-only behavior. (F) Percent of larvae exhibiting no bend, bend that leads to rolling (bend→roller), or bending that does not lead to rolling (bend→non-roller). (G) Crawling speed with 412-Gal4 driving either UAS-TNT to silence neurons or UAS-TNTi as a control. (H) Average cumulative Kernan score after four consecutive trials/animal of the gentle touch assay. (I) Relative frequency (percent) shown for each Kernan score, 0: no response, 1: hesitates, 2: withdraws anterior or turns, 3: single reverse backward movement, 4: multiple waves of reverse locomotion. Gentotypes: (A) w-; Sp or CyO/R70F01-LexA; 13XLexAop2-IVS-myr:GFP/+ (B–B') R70F01-LexA/8X-LexAop2FLPL; 412-Gal4/10XUAS > Stop > myr:GFP (C,E–F) R70F01-LexA/8X-LexAop2FLPL; 412-Gal4/UAS > Stop > Kir2.1-GFP (D) (i) R38H01-Gal4/+ (ii) R38H01-Gal4/UAS-Kir2.1-eGFP (G–I) (i) UAS-TNTi/+;412-Gal4/+ (ii) UAS-TNT/+;412-Gal4/+. Scale bars = 50 µm (A–B'). Box plots show median (middle line) and 25th to 75th percentiles with whiskers representing 10 to 90 percentiles; **p- value = 0.0018 as determined by Mann-Whitney (G). ***p values =< 0.0001 Kruskal-Wallis with Dunn's Correction and Post-hoc Mann-Whitney (E).
Figure 5.
Figure 5.. Connectome of sensory and interneuron inputs to DnB neurons.
(A) First instar larval brain with bilateral reconstruction of DnB neuron morphology in segment A1. Cyan and red dots indicate input and output synapses, respectively. Top, dorsal view; bottom, transverse view. (B) Connectome of inputs onto DnB neurons in right and left A1 hemisegments. Numbers of synaptic connections between segment A1 neurons in top row and DnB neurons are shown. Width of arrow corresponds to degree of synaptic connectivity. Circles represent individual neurons, and hexagons represent groups of neurons. (C) Percent of input provided to total postsynaptic sites on right and left A1 DnB as a function of cell class (not restricted to segment A1). cIV nociceptors provide dominant input to DnBs. (D) Electron micrographs of DnB-cIV and DnB-cIII synapses. (See also Figure 5—figure supplement 1).
Figure 5—figure supplement 1.
Figure 5—figure supplement 1.. Down-and-Back neurons receive spatially segregated sensory input.
(A) Connectome of sensory input synapse onto DnB axon vs. dendrite in right and left A1 hemisegments. Numbers of synaptic connections between sensory neurons in top row and DnB neurons are shown. Width of arrow corresponds to degree of synaptic connectivity. Circles and hexagons represent individual neurons, and groups of neurons, respectively. (B–B') Co-labeling cIII (anti-GFP, green) and cIV (anti-dsRed, magenta) axons in the CNS. Dotted line represents the location of the transverse section shown in (B'). (C–C'') Overlap of cIV axons labeled by ppk:CD4tdTom (anti-dsRed, red), and 412-Gal4, UAS-mCD8:GFP (anti-GFP, green) neurons. (C) dorsal view, dotted line indicates transverse section represented in C'. Anti-FasII (blue) labels axon fascicles. Boxed region is enlarged in (C''). C'' shows overlap of processes in single confocal section. Location of nociceptive terminals is outlined in the lower panel to show overlap with DnB dendrites. Arrowheads indicate extension of 412-Gal4 labeled processes outside of cIV axon zone. (D–D'') Co-labeling of cIII axons (anti-GFP, green) and 412-Gal4 neurons (anti-dsRed, magenta). Dotted line represents transverse section shown in D'. Boxed region is shown as a single plane image in D''. Location of cIII axon terminals is outlined in the lower panel to show overlap with DnB dendrites. Genotypes: (B–B') dTrpA1-QF/QUAS-mtdTom3XHA; nompC-LexA, 10X-LexAop2-myr-GFP/+ (C– C'') +/ppk-CD4-TdTom;412-Gal4, UAS-mCD8:GFP/+. (D –D'') nompC-LexA, 10XLexAop2-IVS-myr-GFP/412-Gal4, UAS-CD4-tdTom. Scale bars = 10 µm (C''), 15 µm (B, C, D–D'').
Figure 6.
Figure 6.. Connectome of DnB to premotor and nociceptive interneuron outputs.
(A) First instar larval CNS showing reconstruction of DnB neurons (green), and nociceptive integrating interneurons (purple). Output synapses are indicated in red and input synapses in cyan. Nociceptive interneurons primarily receive input from output sites on DnB dendrites. (B) Percent of top hits’ (>3 synapses) output from right (DnB a1R) and left (DnB a1L) A1 DnB neurons as a function of cell type. Premotor circuits and nociceptive integrators are dominant outputs of DnB neurons. (C) Identities of nociceptive integrating targets for right and left DnB neurons in A1. Numbers of synapses reconstructed are indicated. Width of arrow corresponds to degree of synaptic connectivity. (D) First instar larval CNS showing reconstruction of DnB neurons (green), premotor (purple), and motor targets (yellow). Premotor neuron output synapses (red dots) located primarily in motor domain (arrowhead). (E) Identities of premotor targets for right and left DnB neurons in A1. Numbers of synapses reconstructed are indicated. Dominant outputs are A27k and A01d-3 premotor neurons. Width of arrow corresponds to degree of synaptic connectivity. (See also Figure 6—figure supplement 1).
Figure 6—figure supplement 1.
Figure 6—figure supplement 1.. Additional properties of Down-and-Back output signaling.
(A) mCD8:GFP driven by 412-Gal4, labeled with anti-GFP (green). (A') Cha3.3kb-Gal80 reduces expression of mCD8:GFP (anti-GFP, green) in DnB neurons. (B) DnB neuron (anti-GFP, green); (C') Boxed region: DnB cell body (arrowhead) shows overlap with ChAT (anti-ChAT; dsRed), (C'') ChAT; dsRed channel only. (C) DnB neuron (anti-GFP, green); (B') Boxed region: DnB cell body (arrowhead) shows no overlap with vGLUT (anti-vGLUT; dsRed); (B'') VGLUT; dsRed channel only. (D) DnB neuron (anti-GFP, green); (D') Boxed region: DnB cell body (arrowhead) shows no overlap with GABA (anti-GABA; dsRed), (D'') GABA; dsRed channel only. (E) tdTomato driven by 412-Gal4 labeling DnB neuron (anti-dsRed, red) (D') Single section showing DnB cell body overlapping with ChAT-eGFP (anti-GFP, green) (top: overlap, middle: tdTomato, red channel only, bottom: ChAT-eGFP cell body) (D''–D''') Single sections showing DnB axons; left panels DnB axon and ChAT-eGFP puncta overlap; middle: DnB axons, tdTomato channel; right panels: ChAT-eGFP puncta, GFP channel only. (F) Electron micrograph of DnB synapse showing dense core vesicles (arrowheads) indicative of peptidergic or aminergic release. (G) Neuropeptide precursor, PreproANF fused with emerald GFP (anti-GFP, magenta) is processed and expressed in DnB axons (arrowhead; anti-dsRed, green), suggesting that DnBs are peptidergic. Genotypes: (A,B,C) 412-Gal4, UAS-mCD8:GFP /+ (A') 412-Gal4, UAS-mCD8:GFP/Cha3.3Kb-Gal80 (D–D''') 412-Gal4, UAS-TdTomato/Chat-EGFP-Flash-Tev3xFlag. (G) UAS-Prepro:ANF-EMD;;412-Gal4,UAS-TdTomato/+. Scale bars = 50 µm (A– A') 20 µm (B,C,D,G).
Figure 7.
Figure 7.. DnBs promote rolling, but not C-bending, through Goro network.
(A) Wiring diagram of DnB to Goro rolling command-like neuron. Percentage represents fraction of total dendritic inputs provided by upstream neuron class. Percentages may underestimate contribution of neuron class due to lack of data from all segments. Number of reconstructed synapses is indicated in parentheses. Hexagons represent groups of neurons. (B) Experimental setup for Goro imaging experiments. Activity in DnB neurons is driven by UAS-Chrimson expression and optogenetic stimulation across the entire CNS (C), brain only (D) or 1–2 segments of DnB neurons in the VNC (E). GCaMP6s was targeted to Goro neurons using 69E06-LexA to monitor calcium responses. (C) ∆F/F0 measured in Goro axons (n = 6) upon full CNS optogenetic activation of 412-Gal4 neurons. (D) ∆F/F0 measured in Goro axons (n = 4) upon brain only (lacking DnBs) optogenetic activation of 412-Gal4 neurons. (E) ∆F/F0 measured in Goro axons (n = 7) upon optogenetic activation of 1–2 DnB neurons. (F) Experimental setup for DnB thermogenetic activation and Goro silencing. (G) Thermogenetic activation of 412-Gal4 neurons (412-Gal4+) leads to dominant bend-roll nociceptive phenotype (bend→roll, orange). A minority of larvae show bending without rolling responses (bend→ no roll, green). Coincident silencing of Goro neurons (412-Gal4+Goro-) subdues rolling responses but does not disrupt bending. (H) Total number of rolls shown by control larvae (412-Gal4 thermogenetic activation; black open circles) and upon coincident Goro silencing (red open circles). Error bars represent standard deviation. P values are indicated as *p<0.05, **p<0.01 ***p<0.001, as tested by Mann Whitney. List of neurons included at each node can be found in supplementary file. (See also Figure 7—figure supplement 1).
Figure 7—figure supplement 1.
Figure 7—figure supplement 1.. Silencing PMSI premotor neurons reduces rolling.
(A) Expression pattern of Per-Gal4, which includes PMSI premotor neurons. (B) Number of rolls decreases upon Per-Gal4 silencing with Kir2.1. (C) Percent of time spent engaged in Bend-crawl, Rolling, or Bend-only behavior upon. Per-Gal4 silencing. (D) Percent of larvae engaged in No-bend, bending followed by rolling: Bend→Roller, or bending without rolling: Bend→ Non Roller. Genotypes: (A) Per-Gal4/20x-UAS-CD8-GFP; 412-QF, QUAS-TdTomato (B–D) (i). PerGal4/+ (ii) PerGal4/+; UAS-Kir2.1-eGFP. Scale bar: 50 μm (A).
Figure 8.
Figure 8.. Summary model for DnB neurons controlling nocifensive escape.
DnB neurons receive dual mechanosensory and nociceptive input, and promote nocifensive escape behavior via co-activation of downstream premotor circuits and command-like Goro neurons.

References

    1. Ainsley JA, Pettus JM, Bosenko D, Gerstein CE, Zinkevich N, Anderson MG, Adams CM, Welsh MJ, Johnson WA. Enhanced locomotion caused by loss of the Drosophila DEG/ENaC protein Pickpocket1. Current Biology. 2003;13:1557–1563. doi: 10.1016/S0960-9822(03)00596-7. - DOI - PubMed
    1. Alekseyenko OV, Lee C, Kravitz EA. Targeted manipulation of serotonergic neurotransmission affects the escalation of aggression in adult male Drosophila melanogaster. PLoS One. 2010;5:e10806. doi: 10.1371/journal.pone.0010806. - DOI - PMC - PubMed
    1. Baines RA, Uhler JP, Thompson A, Sweeney ST, Bate M. Altered electrical properties in Drosophila neurons developing without synaptic transmission. Journal of Neuroscience. 2001;21:1523–1531. - PMC - PubMed
    1. Basler K, Struhl G. Compartment boundaries and the control of Drosophila limb pattern by hedgehog protein. Nature. 1994;368:208–214. doi: 10.1038/368208a0. - DOI - PubMed
    1. Chen TW, Wardill TJ, Sun Y, Pulver SR, Renninger SL, Baohan A, Schreiter ER, Kerr RA, Orger MB, Jayaraman V, Looger LL, Svoboda K, Kim DS. Ultrasensitive fluorescent proteins for imaging neuronal activity. Nature. 2013;499:295–300. doi: 10.1038/nature12354. - DOI - PMC - PubMed

Publication types

MeSH terms

LinkOut - more resources