. 2018 Apr 2;128(4):1538-1550.
doi: 10.1172/JCI96139. Epub 2018 Mar 12.

Insulin resistance causes inflammation in adipose tissue

Affiliations

Insulin resistance causes inflammation in adipose tissue

Mitsugu Shimobayashi et al. J Clin Invest. .

Abstract

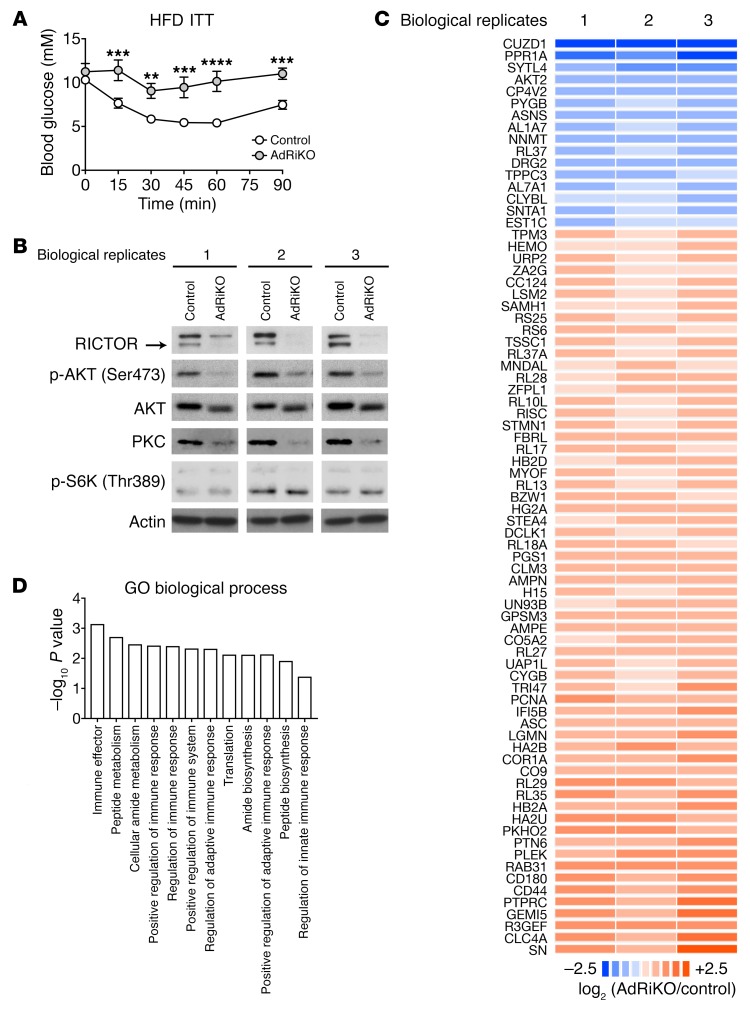
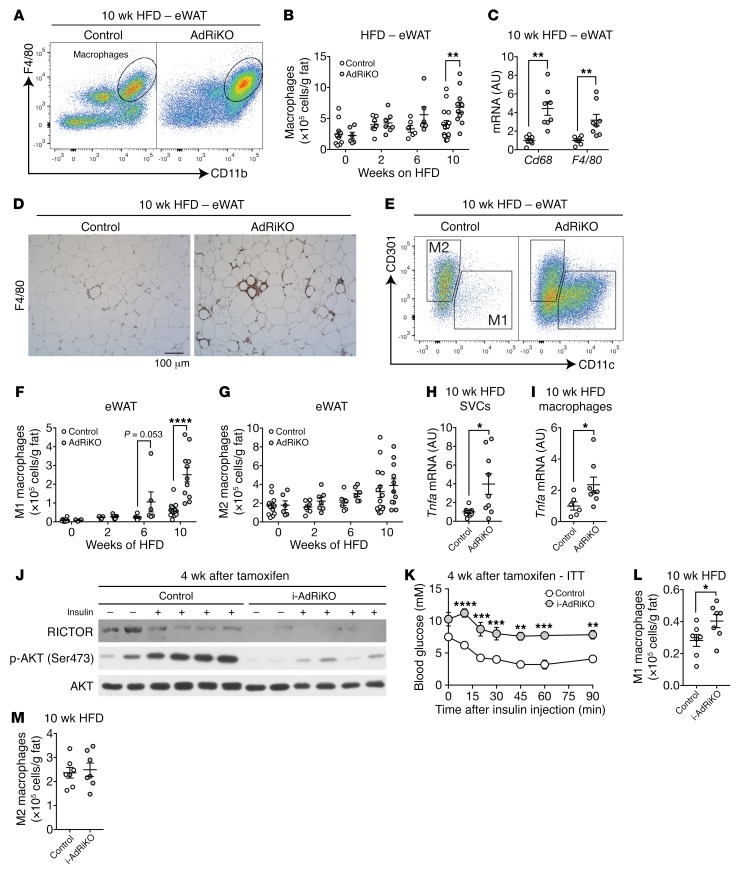
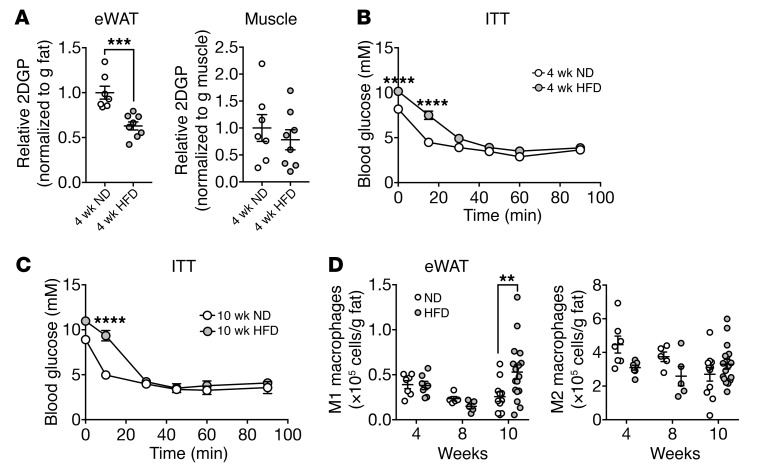
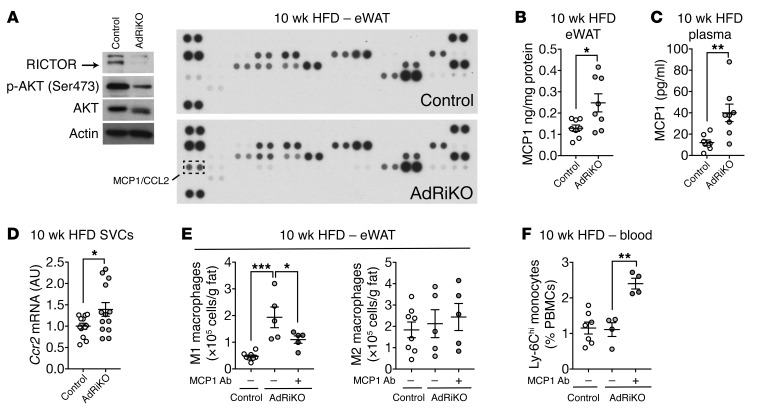
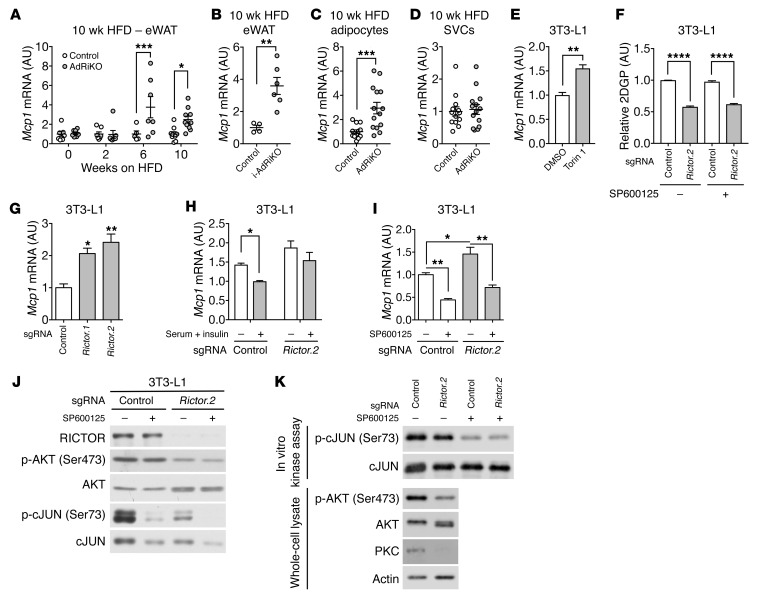
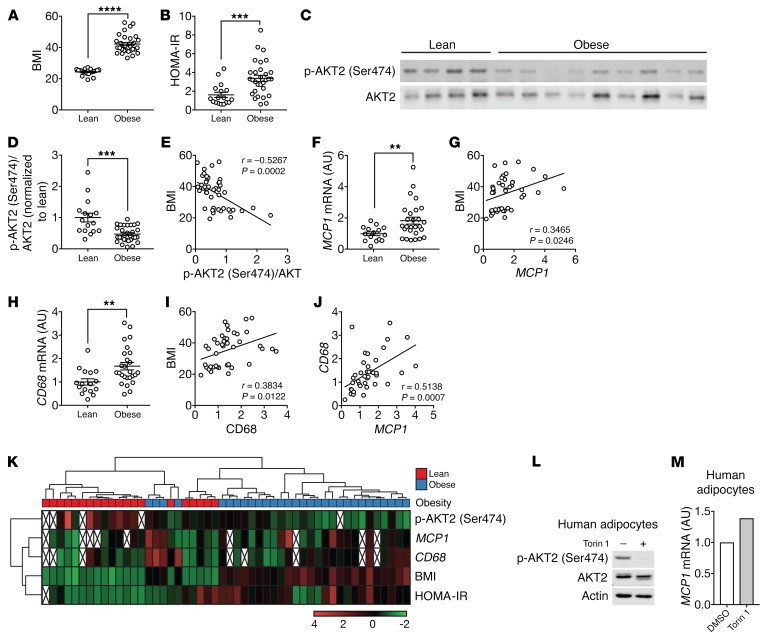
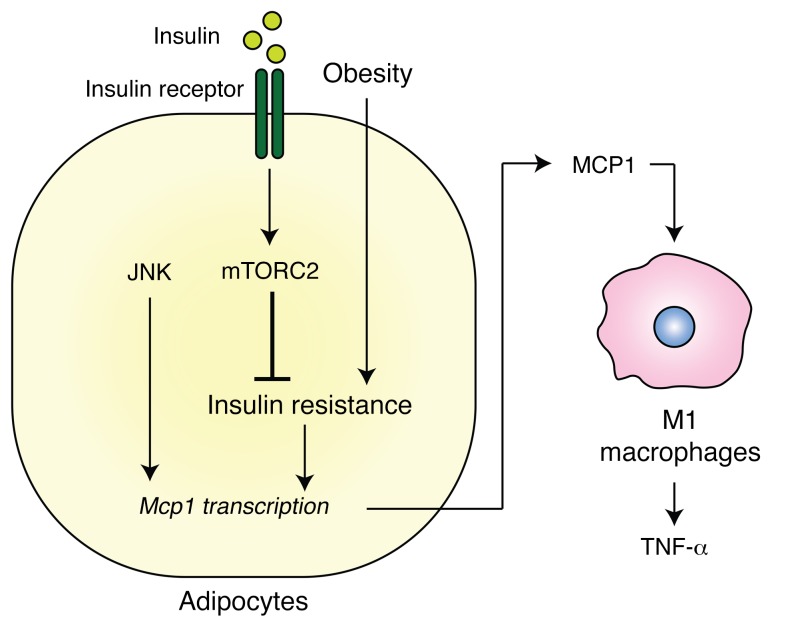
Obesity is a major risk factor for insulin resistance and type 2 diabetes. In adipose tissue, obesity-mediated insulin resistance correlates with the accumulation of proinflammatory macrophages and inflammation. However, the causal relationship of these events is unclear. Here, we report that obesity-induced insulin resistance in mice precedes macrophage accumulation and inflammation in adipose tissue. Using a mouse model that combines genetically induced, adipose-specific insulin resistance (mTORC2-knockout) and diet-induced obesity, we found that insulin resistance causes local accumulation of proinflammatory macrophages. Mechanistically, insulin resistance in adipocytes results in production of the chemokine monocyte chemoattractant protein 1 (MCP1), which recruits monocytes and activates proinflammatory macrophages. Finally, insulin resistance (high homeostatic model assessment of insulin resistance [HOMA-IR]) correlated with reduced insulin/mTORC2 signaling and elevated MCP1 production in visceral adipose tissue from obese human subjects. Our findings suggest that insulin resistance in adipose tissue leads to inflammation rather than vice versa.

Keywords: Adipose tissue; Inflammation; Macrophages; Metabolism; Obesity.


Conflict of interest statement

Conflict of interest: The authors have declared that no conflict of interest exists.

Figures

Figure 1
Figure 1. Quantitative proteome analysis reveals insulin/mTORC2 signaling functions in adipose tissue inflammation.
(A) ITT for AdRiKO and control mice fed a HFD for 10 weeks. Mice were fasted for 5 hours prior to the ITT. Data are presented as the mean ± SEM. **P < 0.01, ***P < 0.001, and ****P < 0.0001, by 2-way ANOVA. n = 10 (control) and n = 5 (AdRiKO). (B) Immunoblots of eWAT from HFD-fed AdRiKO and control mice. eWAT samples were collected from ad libitum–fed mice. The same lysates were used for proteome analysis. (C) Regulated proteome with 3 biological replicates. See also Supplemental Table 1. (D) GO term analysis of the regulated proteome. Data are presented as the mean ± SEM.
Figure 2
Figure 2. AdRiKO eWAT accumulates M1 macrophages.
(A and B) Numbers of macrophages (CD45+F4/80+CD11b+) in SVCs isolated from eWAT of HFD-fed AdRiKO and control mice. Representative FACS profiles are shown in A, and quantification is shown in B. **P < 0.01, by multiple Student’s t test. n = 6–15. (C) Gene expression of macrophage markers in eWAT from HFD-fed AdRiKO and control mice. **P < 0.01, by multiple Student’s t test. n = 7–8. (D) Representative F4/80 staining of eWAT from HFD-fed AdRiKO and control mice. n = 4. Scale bar: 100 μm. (EG) Numbers of M1 macrophages (CD45+F4/80+CD11b+CD11c+) and M2 macrophages (CD45+F4/80+CD11b+CD301+) in SVCs from eWAT of HFD-fed AdRiKO and control mice. Representative FACS profiles are shown in E, and quantification is shown in F and G. ****P < 0.0001 and P = 0.053, by multiple Student’s t test. n = 6–15. (H and I) Tnfa gene expression in SVCs (H) (n = 9) and isolated macrophages (I) (n = 6–8) from eWAT of HFD-fed AdRiKO and control mice. *P < 0.05, by unpaired Student’s t test. (J) Immunoblots of eWAT from i-AdRiKO and control mice. Mice were treated with tamoxifen for 5 days. After 4 weeks, mice were fasted for 5 hours and then treated with PBS or insulin. (K) ITT for i-AdRiKO and control mice 4 weeks after induction of Rictor knockout. Mice were fasted for 5 hours prior to the ITT. **P < 0.01, ***P < 0.001, and ****P < 0.0001, by 2-way ANOVA. n = 5 (control) and n = 6 (i-AdRiKO). (L and M) Numbers of M1 macrophages (CD45+F4/80+CD11b+CD11c+) (L) and M2 macrophages (CD45+F4/80+CD11b+CD301+) (M) in SVCs from eWAT of HFD-fed i-AdRiKO and control mice. *P < 0.05, by unpaired Student’s t test. n = 7. Data are presented as the mean ± SEM.
Figure 3
Figure 3. HFD-induced insulin resistance precedes the accumulation of M1 macrophages.
(A) Insulin-stimulated 2DGP accumulation in eWAT and muscle from WT mice fed a ND or HFD for 4 weeks. Mice were fasted for 5 hours, injected with insulin at 0 minutes and 2DG at 10 minutes, and sacrificed at 30 minutes. ***P < 0.001, by unpaired Student’s t test. n = 7–8. (B and C) ITT for WT mice fed a ND or HFD for 4 weeks (B) or 10 weeks (C). Mice were fasted for 5 hours prior to the ITT. ****P < 0.0001, by 2-way ANOVA. n = 15 (4 wk ND), n = 17 (4 wk HFD), n = 3 (10 wk ND), and n = 4 (10 wk HFD). (D) Numbers of M1 macrophages (CD45+F4/80+CD11b+CD11c+) and M2 macrophages (CD45+F4/80+CD11b+CD301+) in eWAT of WT mice fed a HFD for 4, 8, or 10 weeks. **P < 0.01, by multiple Student’s t test. n = 5–17. Rictorfl/fl mice were used as WT controls. Data are presented as the mean ± SEM.
Figure 4
Figure 4. Insulin/mTORC2 signaling inhibits Mcp1 transcription and M1 macrophage accumulation in vivo.
(A) Adipokine array of eWAT from HFD-fed AdRiKO and control mice. Immunoblots show the reduction of RICTOR expression and mTORC2 signaling. n = 8 (data from 8 mice were pooled). (B) MCP1 protein levels in eWAT from HFD-fed AdRiKO and control mice. *P < 0.05, by unpaired Student’s t test. n = 8. (C) MCP1 protein levels in plasma from HFD-fed AdRiKO and control mice. **P < 0.01, by unpaired Student’s t test. n = 8. (D) Ccr2 mRNA levels in SVCs isolated from eWAT of HFD-fed AdRiKO and control mice. *P < 0.05, by unpaired Student’s t test. n = 12. (E) Numbers of M1 macrophages (CD45+F4/80+CD11b+CD11c+) and M2 macrophages (CD45+F4/80+CD11b+CD301+) in eWAT. Mice were fed a HFD for 8 weeks and treated with a control or MCP1-neutralizing antibody for 2 weeks with ongoing HFD feeding. *P < 0.05 and ***P < 0.001, by 1-way ANOVA. n = 5–8. (F) Percentage of inflammatory monocytes in peripheral blood mononuclear cells (PBMCs). Mice were treated as in E. **P < 0.01, by 1-way ANOVA. n = 4–7. Data are presented as the mean ± SEM.
Figure 5
Figure 5. Insulin/mTORC2 signaling inhibits Mcp1 transcription in adipocytes.
(A) Mcp1 mRNA levels in eWAT from AdRiKO and control mice during the HFD time course. *P < 0.05 and ***P < 0.001, by multiple Student’s t test. n = 5–10. (B) Mcp1 mRNA levels in eWAT from HFD-fed i-AdRiKO and control mice. **P < 0.01, by unpaired Student’s t test. n = 4–6. (C and D) Mcp1 mRNA levels in adipocytes (C) and SVCs (D) isolated from eWAT of HFD-fed AdRiKO and control mice. ***P < 0.001, by unpaired Student’s t test. n = 13–14. (E) Mcp1 mRNA levels in 3T3-L1 adipocytes treated with DMSO or 250 nM torin 1 for 6 hours. **P < 0.01, by unpaired Student’s t test. N >3. (F) 2DGP accumulation in insulin-stimulated Rictor-knockout or control 3T3-L1 adipocytes treated with DMSO or the JNK inhibitor SP600125 (20 μM). N = 3. (G) Mcp1 mRNA levels in Rictor-knockout and control 3T3-L1 adipocytes. *P < 0.05 and **P < 0.01, by unpaired Student’s t test. N = 3. (H) Mcp1 mRNA levels in Rictor-knockout and control 3T3-L1 adipocytes treated with or without serum and insulin. *P < 0.05, by unpaired Student’s t test. N = 3. (I) Mcp1 mRNA levels in Rictor-knockout and control 3T3-L1 cells treated with DMSO or the JNK inhibitor SP600125 (20 μM) for 6 hours. *P < 0.05 and **P < 0.01, by 1-way ANOVA. N = 3. (J) Immunoblots of Rictor-knockout and control 3T3-L1 adipocytes treated with DMSO or the JNK inhibitor SP600125 (20 μM) for 6 hours. N = 3. (K) In vitro JNK kinase assay. Active JNK was immunoprecipitated from Rictor-knockout or control 3T3-L1 adipocytes, and JNK activity was assessed toward its substrate cJUN. SP600125 treatment served as a negative control. N = 3. Data are presented as the mean ± SEM.
Figure 6
Figure 6. Impaired insulin/mTORC2 signaling and increased MCP1 expression in oWAT of insulin-resistant obese patients.
(A and B) BMI and HOMA-IR of lean and obese patients. ***P < 0.001 and ****P < 0.0001, by Mann-Whitney U test. See also Supplemental Table 2. (C) Representative immunoblots for p-AKT2 (Ser474) and AKT2 in human oWAT. (D) Quantification of p-AKT2 (Ser474) normalized to total AKT2. ***P < 0.001, by Mann-Whitney U test. (E) p-AKT2 (Ser474)/AKT2 negatively correlated with BMI. Significance was determined by Pearson’s correlation analysis. (F) MCP1 mRNA levels in human oWAT. **P < 0.01, by Mann-Whitney U test. (G) MCP1 positively correlated with BMI. Significance was determined by Pearson’s correlation analysis. (H) CD68 mRNA levels in human oWAT. **P < 0.01, by Mann-Whitney U test. (I and J) CD68 positively correlated with BMI (I) and MCP1 levels (J). Significance in I and J was determined by Pearson’s correlation analysis. (K) Cluster analysis of BMI, HOMA-IR, p-AKT2 (Ser474)/AKT2, MCP1, and CD68 levels. (L and M) Effect of torin 1 on insulin/mTORC2 signaling (L) and MCP1 mRNA levels (M) in human primary adipocytes. Differentiated human primary adipocytes were treated with DMSO or 250 nM torin 1 for 6 hours.
Figure 7
Figure 7. Insulin resistance causes inflammation in adipose tissue.
Insulin resistance, due to obesity and loss of insulin/mTORC2 signaling, results in enhanced production of MCP1 in adipocytes. MCP1 in turn recruits monocytes and activates proinflammatory M1 macrophages.

References

    1. Rocha VZ, Libby P. Obesity, inflammation, and atherosclerosis. Nat Rev Cardiol. 2009;6(6):399–409. doi: 10.1038/nrcardio.2009.55. - DOI - PubMed
    1. Odegaard JI, Chawla A. Pleiotropic actions of insulin resistance and inflammation in metabolic homeostasis. Science. 2013;339(6116):172–177. doi: 10.1126/science.1230721. - DOI - PMC - PubMed
    1. Park J, Morley TS, Kim M, Clegg DJ, Scherer PE. Obesity and cancer — mechanisms underlying tumour progression and recurrence. Nat Rev Endocrinol. 2014;10(8):455–465. doi: 10.1038/nrendo.2014.94. - DOI - PMC - PubMed
    1. Lackey DE, Olefsky JM. Regulation of metabolism by the innate immune system. Nat Rev Endocrinol. 2016;12(1):15–28. doi: 10.1038/nrendo.2015.189. - DOI - PubMed
    1. McLaughlin T, Ackerman SE, Shen L, Engleman E. Role of innate and adaptive immunity in obesity-associated metabolic disease. J Clin Invest. 2017;127(1):5–13. doi: 10.1172/JCI88876. - DOI - PMC - PubMed

Publication types

MeSH terms

Substances