. 2018 Nov/Dec;39(6):1136-1145.
doi: 10.1097/AUD.0000000000000566.

A Dynamically Focusing Cochlear Implant Strategy Can Improve Vowel Identification in Noise

Affiliations

A Dynamically Focusing Cochlear Implant Strategy Can Improve Vowel Identification in Noise

Julie G Arenberg et al. Ear Hear. 2018 Nov/Dec.

Abstract

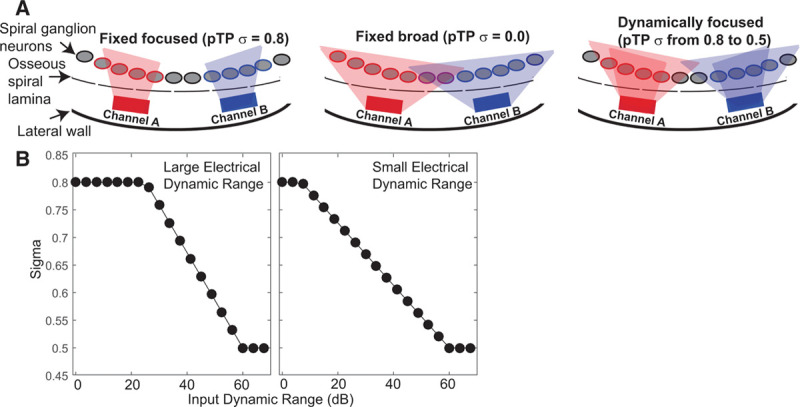
Objectives: The standard, monopolar (MP) electrode configuration used in commercially available cochlear implants (CI) creates a broad electrical field, which can lead to unwanted channel interactions. Use of more focused configurations, such as tripolar and phased array, has led to mixed results for improving speech understanding. The purpose of the present study was to assess the efficacy of a physiologically inspired configuration called dynamic focusing, using focused tripolar stimulation at low levels and less focused stimulation at high levels. Dynamic focusing may better mimic cochlear excitation patterns in normal acoustic hearing, while reducing the current levels necessary to achieve sufficient loudness at high levels.

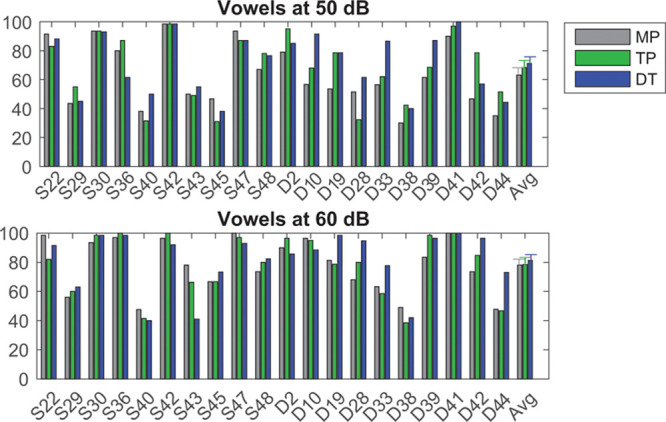
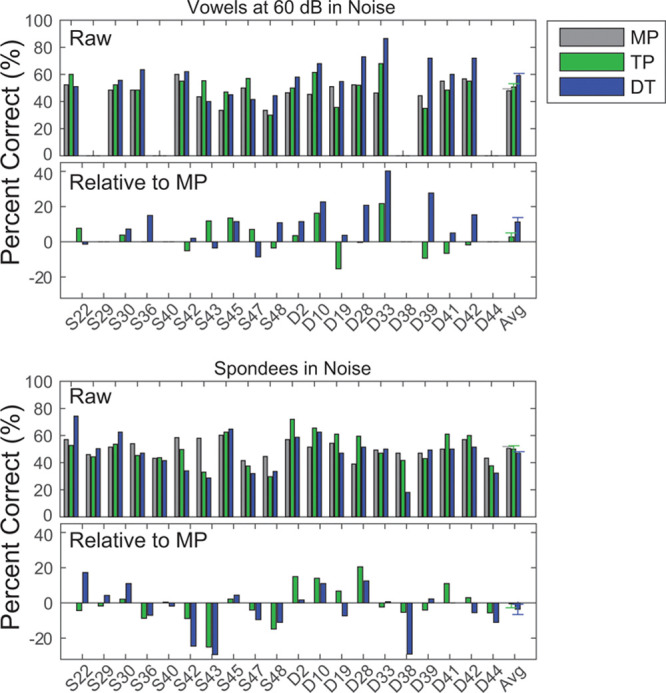
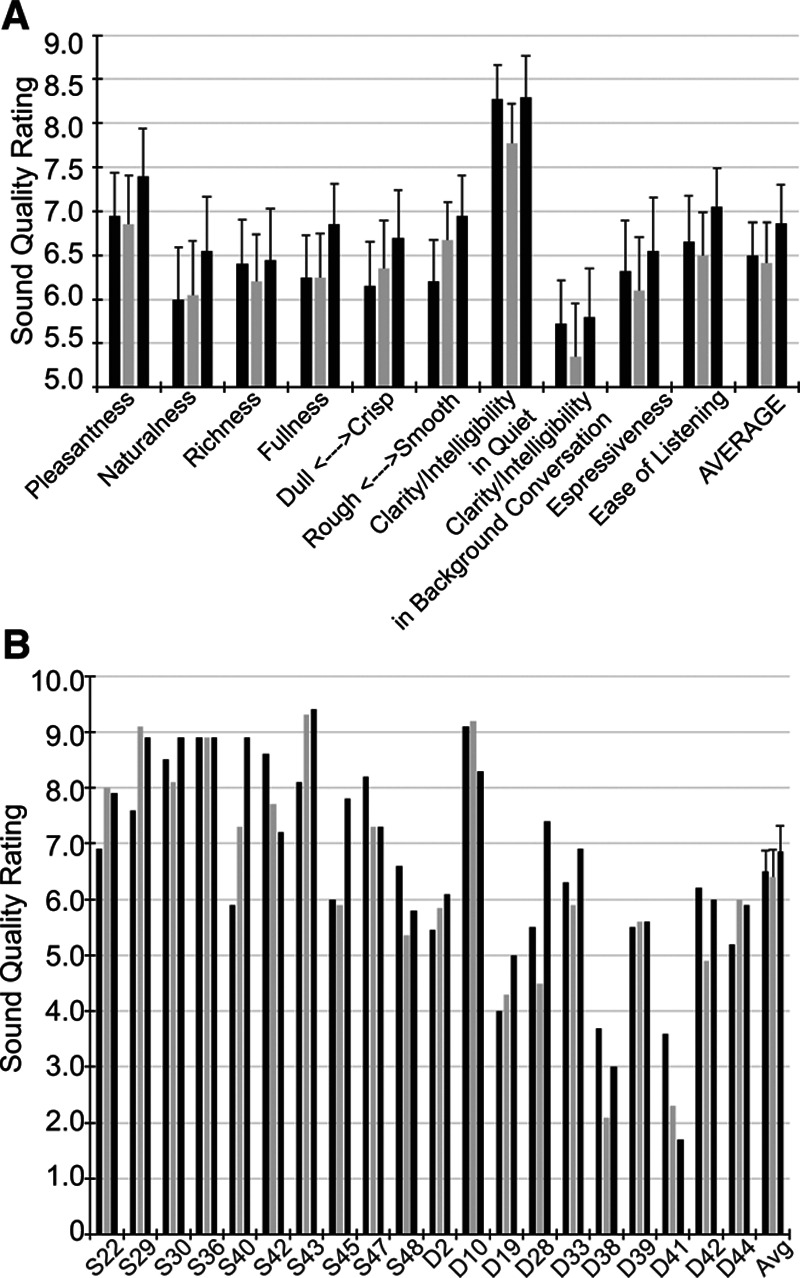
Design: Twenty postlingually deafened adult CI users participated in the study. Speech perception was assessed in quiet and in a four-talker babble background noise. Speech stimuli were closed-set spondees in noise, and medial vowels at 50 and 60 dB SPL in quiet and in noise. The signal to noise ratio was adjusted individually such that performance was between 40 and 60% correct with the MP strategy. Subjects were fitted with three experimental strategies matched for pulse duration, pulse rate, filter settings, and loudness on a channel-by-channel basis. The strategies included 14 channels programmed in MP, fixed partial tripolar (σ = 0.8), and dynamic partial tripolar (σ at 0.8 at threshold and 0.5 at the most comfortable level). Fifteen minutes of listening experience was provided with each strategy before testing. Sound quality ratings were also obtained.

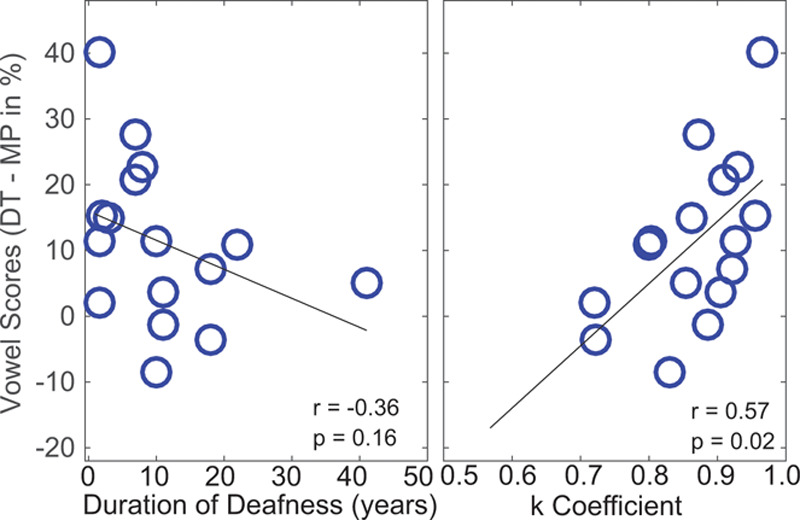
Results: Speech perception performance for vowel identification in quiet at 50 and 60 dB SPL and for spondees in noise was similar for the three tested strategies. However, performance on vowel identification in noise was significantly better for listeners using the dynamic focusing strategy. Sound quality ratings were similar for the three strategies. Some subjects obtained more benefit than others, with some individual differences explained by the relation between loudness growth and the rate of change from focused to broader stimulation.

Conclusions: These initial results suggest that further exploration of dynamic focusing is warranted. Specifically, optimizing such strategies on an individual basis may lead to improvements in speech perception for more adult listeners and improve how CIs are tailored. Some listeners may also need a longer period of time to acclimate to a new program.


Conflict of interest statement

The authors declare no conflicts of interest.

Figures

Fig. 1.
Fig. 1.
Schematic of dynamic focusing and the relationship between sigma and level. A, Two cochlear implant channels are represented by rectangles, spiral ganglion neurons by gray ovals, and the edge of the osseous spiral lamina by a dashed line. The spatial extent of currents required to activate neurons for each channel are indicated by the shaded areas. Partial tripolar with a fixed focused configuration is shown on the left (TP); the σ focusing coefficient was fixed at 0.8. The middle drawings show the monopolar (MP) configuration; σ was fixed at 0. The new dynamically focused configuration is shown on the right. This new mode stimulates with a highly focused configuration for threshold inputs (σ = 0.8) and a broader configuration for input levels near most comfortable levels (σ = 0.5). B, Two examples of the rate of change of the focusing coefficient as a function of the input stimulus level for a 60-dB input dynamic range (Litvak et al. 2007). The left panel shows an example channel with a large electrical dynamic range, while the right panel shows a channel with a small electrical dynamic range.
Fig. 2.
Fig. 2.
Performance (as % correct) is plotted for MP (gray), TP (green), and DT (blue) strategies for vowel identification when stimuli were presented at 50 (top) and 60 (bottom) dB SPL equivalent. The right most set of bars represents the average data, and error bars represent the standard error of the mean. DT indicates dynamic tripolar; MP, monopolar; TP, partial tripolar.
Fig. 3.
Fig. 3.
The top pair of panels represents the raw scores (top) for vowel identification when presented in background noise and the same scores plotted relative to the score with MP (bottom). Note that subjects S29, S40, D38, and D44 were not tested in background noise. The lower pair of panels represents the raw (top) and relative (bottom) scores for spondee identification in noise. Conventions as in previous figure. MP indicates monopolar.
Fig. 4.
Fig. 4.
Sound quality ratings averaged across listeners and for individuals. A, Each bar height indicates the sound quality rating (qualities label the x axis) averaged across listeners for MP (black), TP (light gray), and DT (dark gray). The average of sound qualities across listeners is shown in the right-most set of bars. B, Each bar height indicates the sound quality ratings averaged across sound qualities for individual subjects (labeled along the x axis). Error bars represent standard error of the means. DT indicates dynamic tripolar; MP, monopolar; TP, partial tripolar.
Fig. 5.
Fig. 5.
The difference between performance on vowel identification in noise with DT minus performance with MP (ordinate) is plotted as a function of duration of deafness (left) and as a function of estimated K coefficient (right). Each circle represents data from one subject, and only subjects tested in background noise were included. DT indicates dynamic tripolar; MP, monopolar.
Fig. 6.
Fig. 6.
The computed tomography–estimated distance of each electrode from the inner wall of the cochlea is plotted as a function of estimated K coefficient. Each subject is represented by color with multiple data points for each electrode (14 per subject). The black line is a least-squares, best fit line to the data.

Similar articles

Cited by

References

    1. Anderson E. S., Nelson D. A., Kreft H., et al. Comparing spatial tuning curves, spectral ripple resolution, and speech perception in cochlear implant users. J Acoust Soc Am, 2011). 130, 364–375.. - PMC - PubMed
    1. Arenberg J.G., Furukawa S., Middlebrooks J. C. Auditory cortical images of tones and noises. J Assoc Res in Otolaryngol, 2000). 1, 183–194.. - PMC - PubMed
    1. Bates D., Maechler M., Bolker B., et al. Fitting linear mixed-effects models using Ime4. J Stat Softw, 2015). 67, 1–48..
    1. Berenstein C. K., Mens L. H., Mulder J. J., et al. Current steering and current focusing in cochlear implants: Comparison of monopolar, tripolar, and virtual channel electrode configurations. Ear Hear, 2008). 29, 250–260.. - PubMed
    1. Bierer J. A., Faulkner K. F. Identifying cochlear implant channels with poor electrode-neuron interface: Partial tripolar, single-channel thresholds and psychophysical tuning curves. Ear Hear, 2010). 31, 247–258.. - PMC - PubMed

Publication types