. 2018 May;24(4):438-449.
doi: 10.1038/nm.4491. Epub 2018 Mar 12.

Dentate granule cell recruitment of feedforward inhibition governs engram maintenance and remote memory generalization

Affiliations

Dentate granule cell recruitment of feedforward inhibition governs engram maintenance and remote memory generalization

Nannan Guo et al. Nat Med. 2018 May.

Abstract

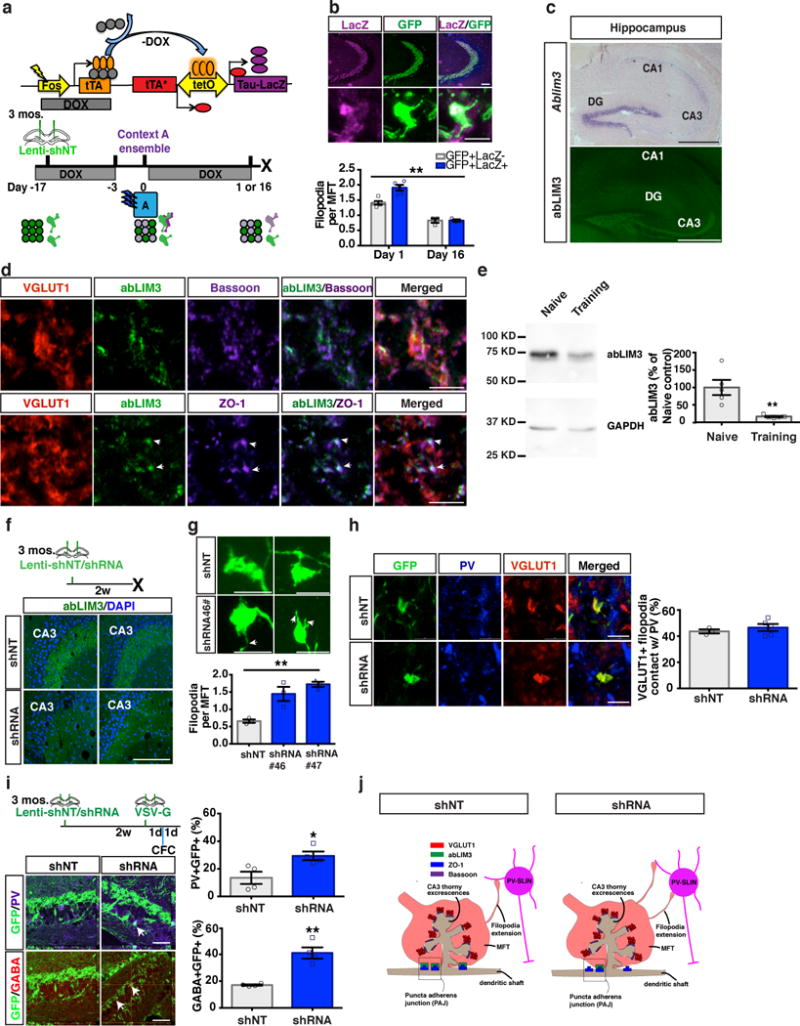
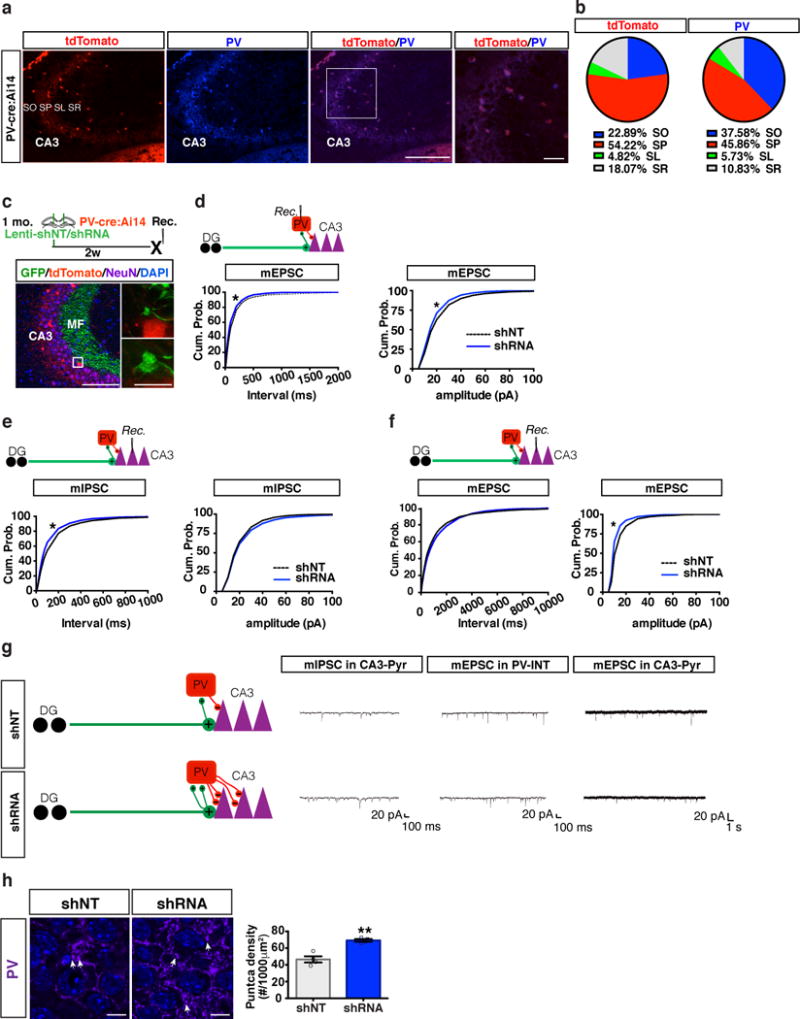
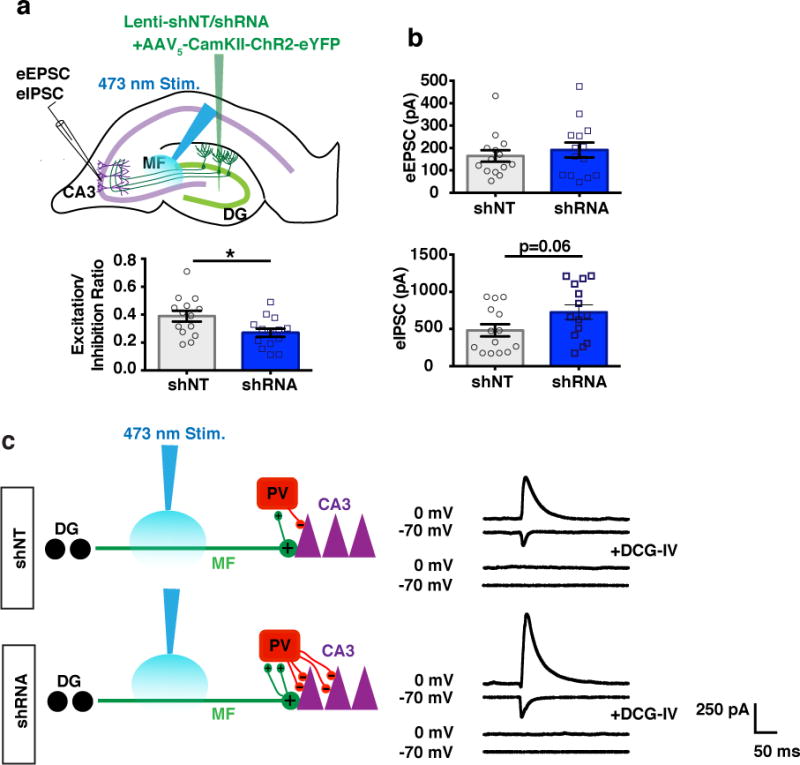
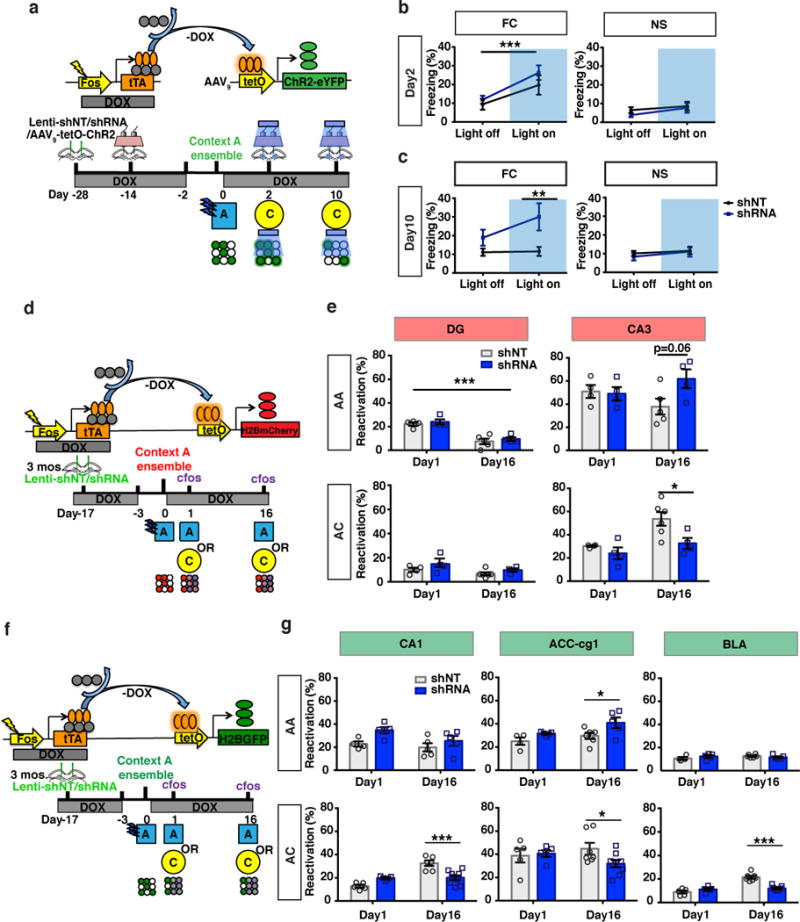
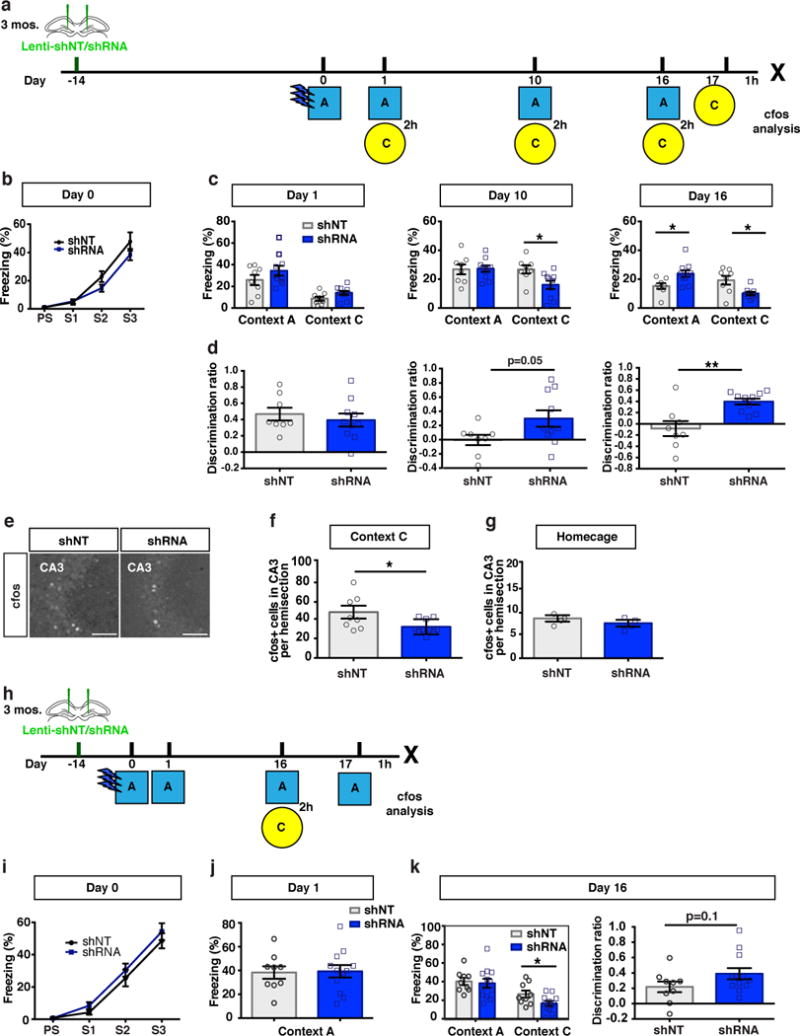
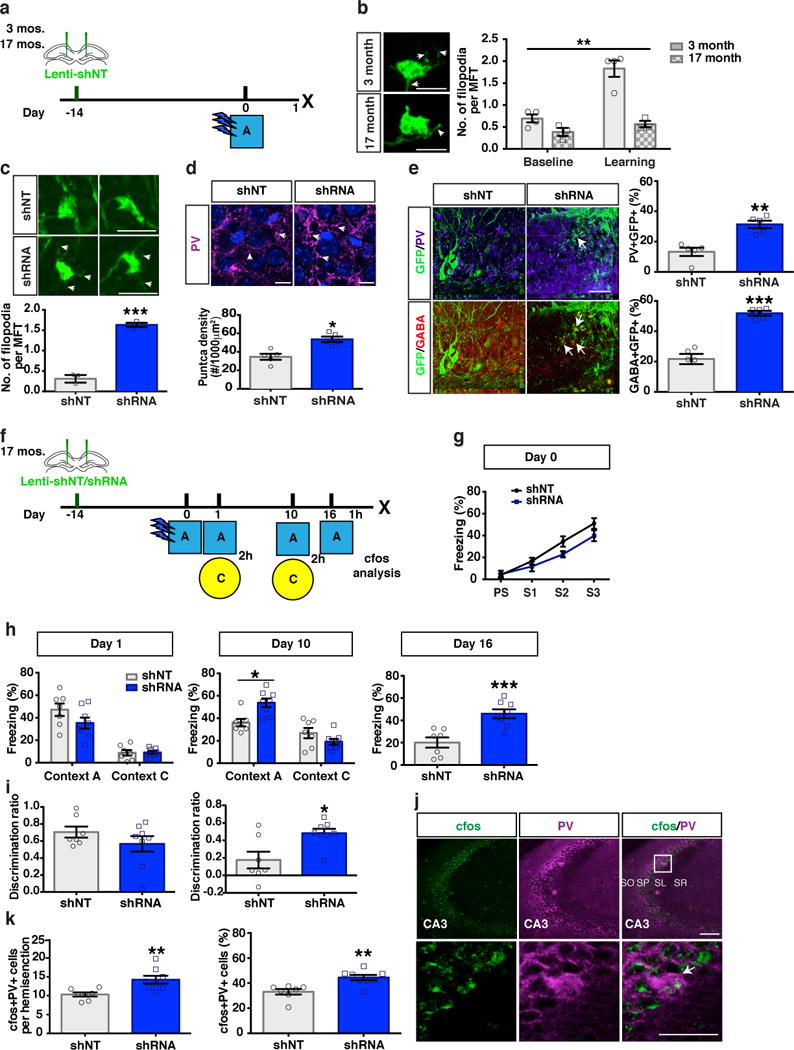
Memories become less precise and generalized over time as memory traces reorganize in hippocampal-cortical networks. Increased time-dependent loss of memory precision is characterized by an overgeneralization of fear in individuals with post-traumatic stress disorder (PTSD) or age-related cognitive impairments. In the hippocampal dentate gyrus (DG), memories are thought to be encoded by so-called 'engram-bearing' dentate granule cells (eDGCs). Here we show, using rodents, that contextual fear conditioning increases connectivity between eDGCs and inhibitory interneurons (INs) in the downstream hippocampal CA3 region. We identify actin-binding LIM protein 3 (ABLIM3) as a mossy-fiber-terminal-localized cytoskeletal factor whose levels decrease after learning. Downregulation of ABLIM3 expression in DGCs was sufficient to increase connectivity with CA3 stratum lucidum INs (SLINs), promote parvalbumin (PV)-expressing SLIN activation, enhance feedforward inhibition onto CA3 and maintain a fear memory engram in the DG over time. Furthermore, downregulation of ABLIM3 expression in DGCs conferred conditioned context-specific reactivation of memory traces in hippocampal-cortical and amygdalar networks and decreased fear memory generalization at remote (i.e., distal) time points. Consistent with the observation of age-related hyperactivity of CA3, learning failed to increase DGC-SLIN connectivity in 17-month-old mice, whereas downregulation of ABLIM3 expression was sufficient to restore DGC-SLIN connectivity, increase PV+ SLIN activation and improve the precision of remote memories. These studies exemplify a connectivity-based strategy that targets a molecular brake of feedforward inhibition in DG-CA3 and may be harnessed to decrease time-dependent memory generalization in individuals with PTSD and improve memory precision in aging individuals.


Conflict of interest statement

Competing Financial Interests Statement

The authors declare competing financial interests. A.S and N.G are named co-inventors on patent application relating to this study.

Figures

Figure 1
Figure 1. abLIM3 is a learning-regulated molecular brake of DGC-SLIN connectivity
(a) Schematic of Tet-off genetic system and behavioral schedule for labeling context A ensemble+ MFTs. (b) Images showing mossy fiber projections in hippocampus (upper) and an ensemble+ MFT (lower). Bar graph showing ensemble+ MFT filopodia (GFP+LacZ+) and non-ensemble/non-tagged MFTs (GFP+LacZ-) at day 1 and day 16 (89, 157 MFTs from day 1, 97, 115 MFTs from day 16. Two-way ANOVA, day X ensemble/non-ensemble MFT filopodia, F (1, 12) = 9.766, p=0.0088, Bonferroni post hoc: Day 1, p=0.0005; Day 16, p>0.9, n=5, 3 mice for each time point. (c) In situ hybridization showing Ablim3 expression in the hippocampus (upper), and abLIM3 immunohistochemistry (Lower). This experiment was replicated 3 times. (d) Triple immunofluorescence for abLIM3, ZO-1 (lower, arrows) and Bassoon (upper) in VGLUT1+ MFTs in CA3. This experiment was replicated 3 times. (e) Western blot analysis of abLIM3 levels in hippocampal lysates following learning (n=5,5 mice). The blot image (left) was cropped from supplementary Fig. 11d. Bar graph (right) was generated from full blot images in supplementary Fig. 11c. (f) Schematic of stereotaxic lentiviral injection into DG (upper) and representative images of abLIM3 immunohistochemistry in MFTs from 2 mice (shRNA#46 and shNT). This experiment was replicated 2 times. (g) Representative images showing GFP+ MFTs and filopodial extensions (arrows) following lentiviral shNT/shRNA-GFP injection (upper). Quantification of MFT-filopodia number (lower) (One-way ANOVA, p=0.0028, 77, 77 and 76 MFTs from n=3 mice in each group). (h) Images showing VGLUT1+ MFT and MFT filopodia contacting PV SLINs (left) and bar graphs with quantification of percentage of VGLUT1+ filopodia contacting PV (right) (85 filopodial extensions from 43 MFTs in shNT group, 115 filopodial extensions from 62 MFTs in shRNA group, n=3,5 mice). (i) Timeline of lentiviral-shNT/shRNA and VSV-G injection into DG (left). Contextual fear conditioning (CFC) was conducted 1d after VSV-G injection (left, upper). Confocal images showing anterograde labeled PV or GABA+ INs in CA3 (arrows) (left, lower) and bar graphs with quantification of percentage of GABA+GFP+ or PV+GFP+ cells in CA3 (n=4, 4 mice) (right). (j) Schematic showing distribution of abLIM3, Bassoon and ZO-1 in VGLUT1+ MFT and localization of abLIM3 to PAJs in lentiviral-shNT infected mice (left). Lentiviral shRNA mediated abLIM3 downregulation in MFTs induces generation of VGLUT1+ MFT filopodial contacts with PV SLINs (right). Scale bar represents 500 μm in c, 100 μm in b, f and h, 50 μm in i, and 5 μm in b, d, g and h. Unless otherwise specified, statistical comparisons were performed using two tailed unpaired t tests. **p < 0.01, *p < 0.05. Data are represented mean ± SEM. See supplementary Table 1.
Figure 2
Figure 2. abLIM3 downregulation in DGCs increases mEPSCs in PV SLINs and PV puncta in CA3
(a) Representative images of genetically recombined tdTomato+ cells and PV+ cell (PV antibody staining) in CA3 of PV-Cre:Ai14 mice. Box highlights magnified regions (left). Immunostaining was replicated 2 times. (b) Pie graphs showing distribution of tdTomato + and PV+ cells in CA3 area including Stratum Pyramidale (SP), Stratum Oriens (SO) Stratum Radiatum (SR) and Stratum Lucidum (SL). (c) Schematic of lentiviral-shNT/shRNA injections into DG of PV- Cre:Ai14 mice (upper). Images showing lentiviral-shNT/shRNA infected GFP+ MFTs in PV- Cre:Ai14 mice, box highlights magnified regions (lower). (d) Whole cell recording of mEPSC frequency (left, k-s test, p < 0.0001; shNT: 3887 events from n=13 cells, shRNA: 3588 events from n=12 cells, 3 mice per group) and mEPSC amplitude (right, k-s test, p < 0.0001; shNT: 3900 events from n=13 cells, shRNA: 3600 events from n=12 cells, 3 mice per group) from PV SLINs. (e) Intracellular recording of mIPSC frequency (left, k-s test, p < 0.0001; shNT: 2691 events from n=9 cells, shRNA: 2691 events from n=9 cells, 3 mice per group) and mIPSC amplitude (right, k-s test, p = 0.0126; shNT: 2700 events from n=9 cells, shRNA: 2700 events from n=9 cells, 3 mice per group) from CA3 Pyramidal neurons. (f) Intracellular recording of mEPSC frequency (left, k-s test, p = 0.0222 middle, k-s test, p < 0.0001; shNT: 1209 events from n=9 cells, shRNA: 1620 events from n=12 cells, 3 mice per group) and mEPSC amplitude (right, k-s test, p < 0.0001; shNT: 1218 events from n=9 cells, shRNA: 1632 events from n=12 cells, 3 mice per group) from CA3 Pyramidal neurons. (g) Schematic showing how abLIM3 knockdown in DGCs increases number of MFT filopodial contacts with PV SLINs to exert increased inhibition onto CA3 (left) with representative recording traces from each set of recordings (right). (h) Images showing PV+ puncta (arrows) in CA3 stratum pyramidale of lentiviral shNT and shRNA injected mice (left) and bar graph of PV puncta density in CA3 of shRNA/shNT injected mice (right) (two tailed unpaired t test, **p < 0.01, n=4,4 mice, Data are represented mean ± SEM). Scale bar represents 100 μm in a and c, 10 μm in a and h, and 5 μm in c. See supplementary Table 1.
Figure 3
Figure 3. abLIM3 downregulation in DGCs enhances feedforward inhibition onto CA3
(a) Schematic showing lentiviral-shNT/shRNA and rAAV5 CaMKIIα::ChR2–eYFP injections into DG and recording of blue light-evoked EPSCs and IPSCs in CA3 pyramidal neurons in slices (upper). Bar graph of E/I ratio (peak EPSC amplitude/peak IPSC amplitude) in CA3 of lentiviral-shRNA/shNT injected mice upon blue light stimulation (n=14 cells, 4 mice per group) (lower). (b) Absolute values of light-evoked EPSCs (upper) and IPSCs (lower) from CA3 following blue light stimulation. (c) Schematic showing how abLIM3 knockdown in DGCs increases number of MFT filopodial contacts with PV SLINs to increase feed forward inhibition onto CA3 (left) with representative recording traces from each set of recordings and traces of the same cells after perfusion of DCG-IV (right). Statistical comparisons were performed using two tailed unpaired t test, *p < 0.05, Data are represented mean ± SEM. See supplementary Table 1
Figure 4
Figure 4. Enhancing DGC recruitment of inhibition promotes engram maintenance and governs reactivation of remote memory traces in hippocampal-cortical and BLA networks
(a) Schematic of virus mediated ensemble labeling strategy and behavioral paradigm for optogenetic activation of DG engram cells. (b) Freezing levels following blue light stimulation at day 2 in FC and NS groups (FC, fear conditioned, n=8,7 mice; NS, no shock, n=7,9 mice). (c) Freezing levels following blue light stimulation at day 10 in FC and NS groups [FC group:Two-way ANOVA with repeated measures, main effect of treatment (shRNA vs. shNT virus), F (1, 13) = 6.090, p=0.0283, Bonferroni post hoc, light on, p=0.0097]. (d, f) Schematic of Tet-off (Tet-Tag) genetic system and behavioral paradigm to indelibly label ensembles in DG, CA3, CA1, BLA and ACC. (e, g) Reactivation assessed by quantifying percentage of tagged neuronal ensembles (e, tetOH2BmCherry; g, tetOH2BGFP) that are cfos+. Reactivation in AA group in DG, Two-way ANOVA, main effect of time: p<0.001. Reactivation in AC group: CA3, Two-way ANOVA, main effect of treatment (shRNA vs. shNT virus), F (1, 14) = 6.972, p=0.019, Bonferroni post hoc, p=0.01; CA1 Two-way ANOVA, day X treatment (shRNA vs. shNT virus), F (1, 21) = 23.27, p<0.001, Bonferroni post hoc, p=0.0002; ACC-Cg1, Two-way ANOVA, day X treatment (shRNA vs. shNT virus), F (1, 22) = 4.318, p=0.04, Bonferroni post hoc, p=0.01; BLA, Two-way ANOVA, day X treatment (shRNA vs. shNT virus), F (1, 22) = 32.32, p < 0.0001, Bonferroni post hoc, p < 0.0001, Day 1 vs. Day 16, shNT group, Bonferroni post hoc, p<0.0001, Day 1 vs. Day 16, shRNA group, Bonferroni post hoc, p>0.999. ***p < 0.001, **p < 0.01, *p < 0.05. Data are represented mean ± SEM. See supplementary Table 1
Figure 5
Figure 5. abLIM3 downregulation in DGCs decreases generalization of remote fear memories
(a) Schematic of contextual fear conditioning paradigm with intervening context exposures. (b) Freezing levels of lentiviral shNT/shRNA injected mice during training (n=8,10 mice, Two-way ANOVA with repeated measures). (c) Freezing levels during exposure to context A and context C at day 1, day 10 and day 16 respectively (n=8,10 mice). Two-way ANOVA with repeated measures, context X virus (shRNA vs. shNT): day 10, F (1, 16) = 3.409, p=0.08, two tailed unpaired t-test p=0.01; day 16, context X virus (shRNA vs. shNT): F (1, 16) = 21.81, p=0.0003, Bonferroni post hoc, p<0.05). Time dependent fear generalization, one-way ANOVA with repeated measures, shNT group in context C: time, p=0.0008. (d) Contextual discrimination ratios (A vs C) for day 1, day 10 and day 16 (n=8,10 mice). Two-way ANOVA with repeated measures analysis of discrimination ratios, Virus X Day, F (2, 32) = 4.815, p=0.014. (e) Representative images showing cfos+ population in CA3 following lentiviral shNT/shRNA injection (left). (f) cfos+ cell counts after context C exposure at day 17 (n=8,10 mice). (g) cfos+ cell counts in CA3 from homecage control (n=4,4 mice). (h) Schematic of contextual fear conditioning paradigm with exposure to neutral context only at remote time point. (i) Freezing level of lentiviral-shNT/shRNA injected mice during training (n=9,12 mice, Two-way ANOVA with repeated measures). (j) Freezing level tested at day 1 and (k) day 16 (left) and contextual discrimination ratio (right) for day 16 (n=9,12 mice). Scale bar represents 100 μm. Unless otherwise specified, statistical comparisons were performed using two tailed unpaired t-tests. ***p < 0.001, **p < 0.01, *p < 0.05. Data are represented mean ± SEM. See supplementary Table 1
Figure 6
Figure 6. abLIM3 downregulation in DG of aged mice enhances DGC-PV SLIN connectivity and improves remote memory precision
(a) Schematic of lentiviral shNT/RNA injection into DG of 3-month old and 17-month old mice. (b) Representative images showing GFP+ MFTs with filopodial extensions (arrows) after training (left). Bar graph (right) showing quantification of MFT filopodia number in 3-month old and 17-month old mice at baseline (naïve, unpaired t-test, baseline, 3 month vs 17 month: p=0.06) and after training (Two-Way ANOVA, age X baseline/learning F (1, 10) = 13.03, P = 0.0048, Bonferroni’s post hoc tests: 3 month, baseline vs. learning, p=0.0001. 3 month vs. 17 month following learning, p=0.0001, (4, 3 mice). (c) Representative images (upper) and quantification (lower) showing GFP+ MFT filopodia (arrows) number (75 MFTs from shNT group and 97 MFTs from shRNA group, n=3,3 mice) following lentiviral-shNT/shRNA injection into DG of 17 months old mice. (d) Representative images (upper) and quantification (lower) showing PV puncta (arrows) density in CA3 stratum pyramidale of 17 months old mice (n=5,5 mice). (e) Representative images (left) and quantification (right) showing anterograde labeled PV and GABA+ cells in CA3 by VSV-G injection into DG of 17 months old mice (n=5,5 mice). (f) Schematic of contextual fear conditioning paradigm using aged mice. (g-h) Freezing levels of lenti-shNT/shRNA injected mice during training, test at day 1, day 10 and day 16 (n=7,8 mice). Two-way ANOVA with repeated measures (day 10), context X treatment (shRNA vs. shNT virus), F (1, 13) = 15.58, p=0.0017. (i) Contextual discrimination ratios for day 1 and day 10 (Paired t-test, Day1 vs. Day 10, in shNT mice, p=0.0017) (n=7,8 mice). Two-way ANOVA with repeated measures analysis of discrimination ratios, Virus X Day, F (1, 13) = 10.74, p=0.006. (j) Confocal images show cfos+PV+ cells in CA3 area [including Stratum Pyramidale (SP), Stratum Oriens (SO) Stratum Radiatum (SR) and Stratum Lucidum (SL)]. After context A exposure at day 16. (k) Bar graph with quantification of cfos+PV+ cells counts (left) and percentage of cfos+PV+ cells over total PV+ cells in CA3 area (right) (n=7,8 mice). Scale bar represents 100 μm in j, 50 μm in e and j, 10 μm in d, 5 μm in b and c. Unless otherwise specified, statistical comparisons were performed using two tailed unpaired t-tests. ***p < 0.001, **p < 0.01, *p < 0.05. Data are represented mean ± SEM. See supplementary Table 1

Comment in

References

    1. Jasnow AM, Lynch JF, 3rd, Gilman TL, Riccio DC. Perspectives on fear generalization and its implications for emotional disorders. Journal of neuroscience research. 2017;95:821–835. doi: 10.1002/jnr.23837. - DOI - PubMed
    1. Biedenkapp JC, Rudy JW. Learning & memory. Vol. 14. Cold Spring Harbor; N.Y: 2007. Context preexposure prevents forgetting of a contextual fear memory: implication for regional changes in brain activation patterns associated with recent and remote memory tests; pp. 200–203. - DOI - PMC - PubMed
    1. Wiltgen BJ, Silva AJ. Learning & memory. Vol. 14. Cold Spring Harbor; N.Y: 2007. Memory for context becomes less specific with time; pp. 313–317. - DOI - PubMed
    1. Poulos AM, et al. Learning & memory. Vol. 23. Cold Spring Harbor; N.Y: 2016. Conditioning- and time-dependent increases in context fear and generalization; pp. 379–385. - DOI - PMC - PubMed
    1. Besnard A, Sahay A. Adult Hippocampal Neurogenesis, Fear Generalization, and Stress. Neuropsychopharmacology. 2016;41:24–44. doi: 10.1038/npp.2015.167. - DOI - PMC - PubMed

Supplementary References

    1. Zhou Z, et al. Brain-specific phosphorylation of MeCP2 regulates activity-dependent Bdnf transcription, dendritic growth, and spine maturation. Neuron. 2006;52:255–269. doi: 10.1016/j.neuron.2006.09.037. - DOI - PMC - PubMed
    1. Lois C, Hong EJ, Pease S, Brown EJ, Baltimore D. Germline transmission and tissue-specific expression of transgenes delivered by lentiviral vectors. Science. 2002;295:868–872. doi: 10.1126/science.1067081. - DOI - PubMed
    1. Drokhlyansky E, et al. The brain parenchyma has a type I interferon response that can limit virus spread. Proc Natl Acad Sci U S A. 2017;114:E95–E104. doi: 10.1073/pnas.1618157114. - DOI - PMC - PubMed
    1. McAvoy KM, et al. Modulating Neuronal Competition Dynamics in the Dentate Gyrus to Rejuvenate Aging Memory Circuits. Neuron. 2016;91:1356–1373. doi: 10.1016/j.neuron.2016.08.009. - DOI - PMC - PubMed
    1. Ikrar T, et al. Adult neurogenesis modifies excitability of the dentate gyrus. Frontiers in neural circuits. 2013;7:204. doi: 10.3389/fncir.2013.00204. - DOI - PMC - PubMed

Publication types