. 2018 Mar 12;14(3):e1007253.
doi: 10.1371/journal.pgen.1007253. eCollection 2018 Mar.

Large-scale profiling of noncoding RNA function in yeast

Affiliations

Large-scale profiling of noncoding RNA function in yeast

Steven Parker et al. PLoS Genet. .

Abstract

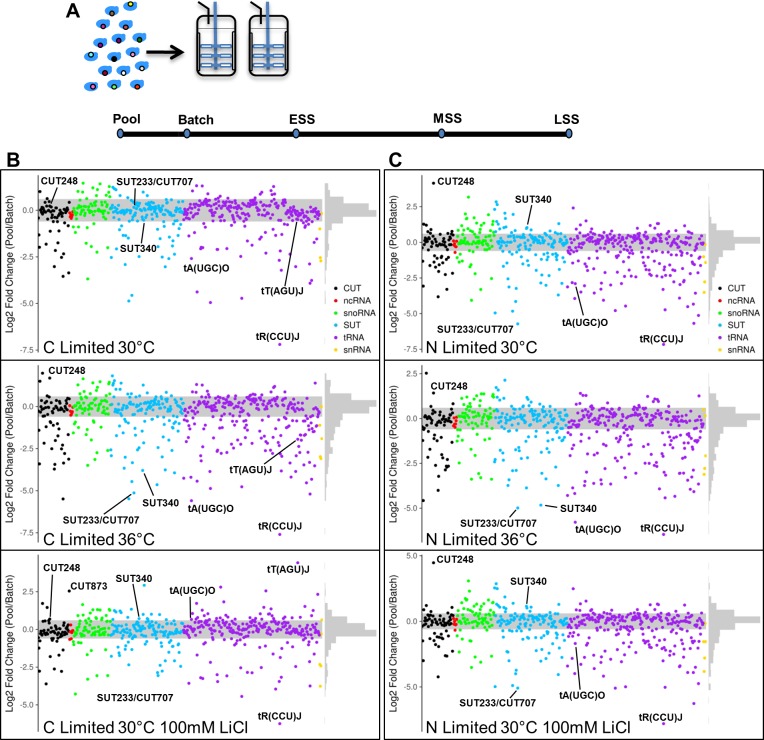
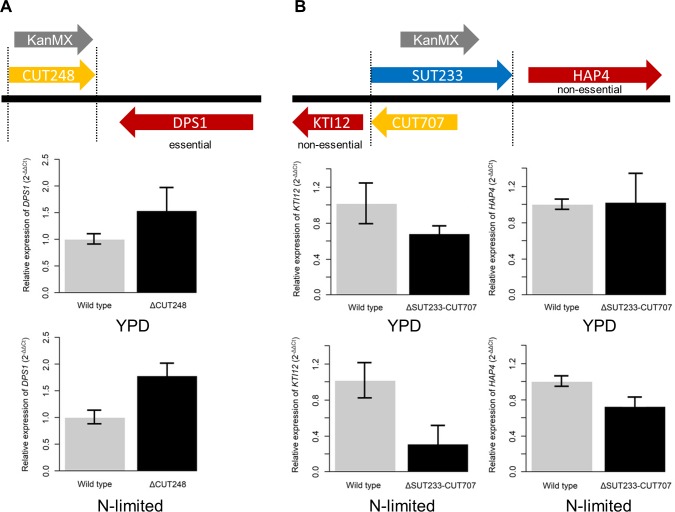
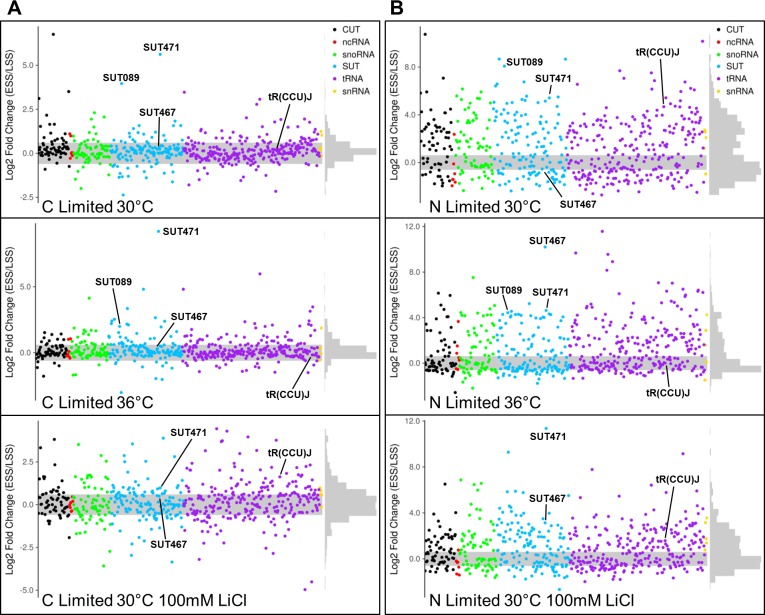
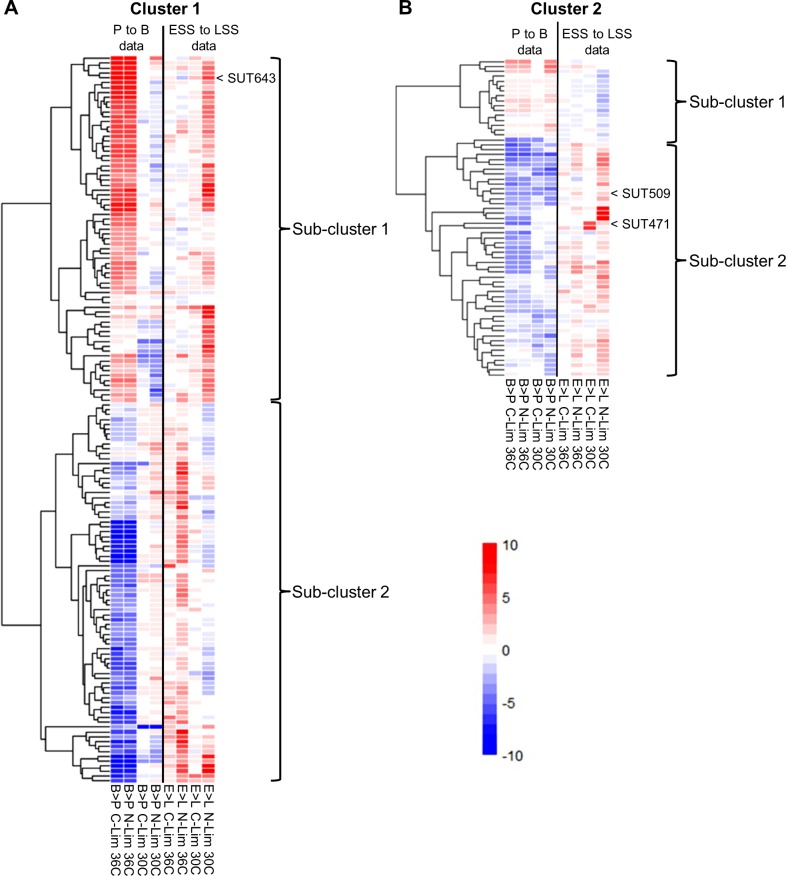
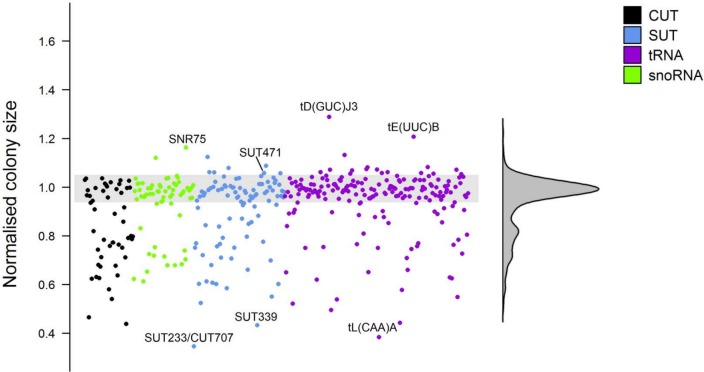
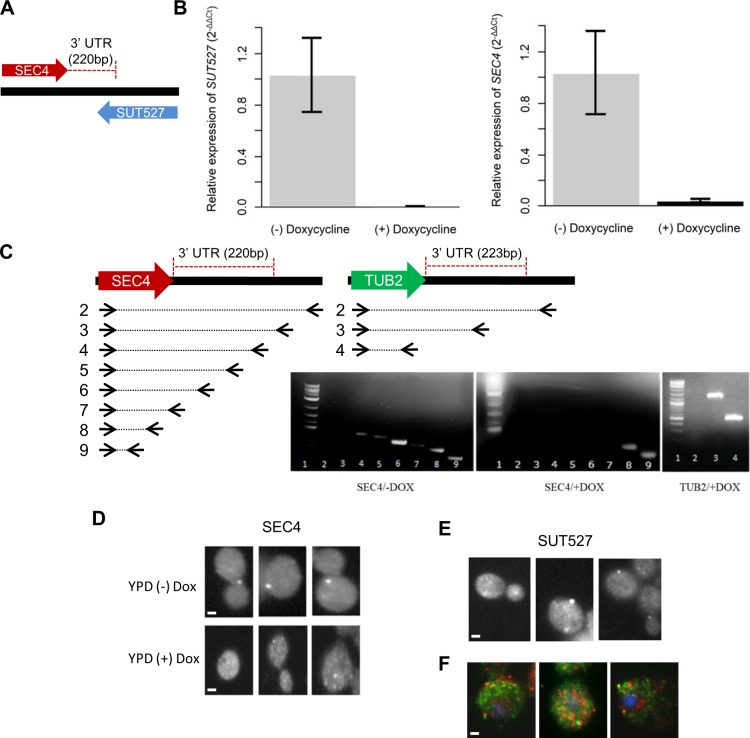
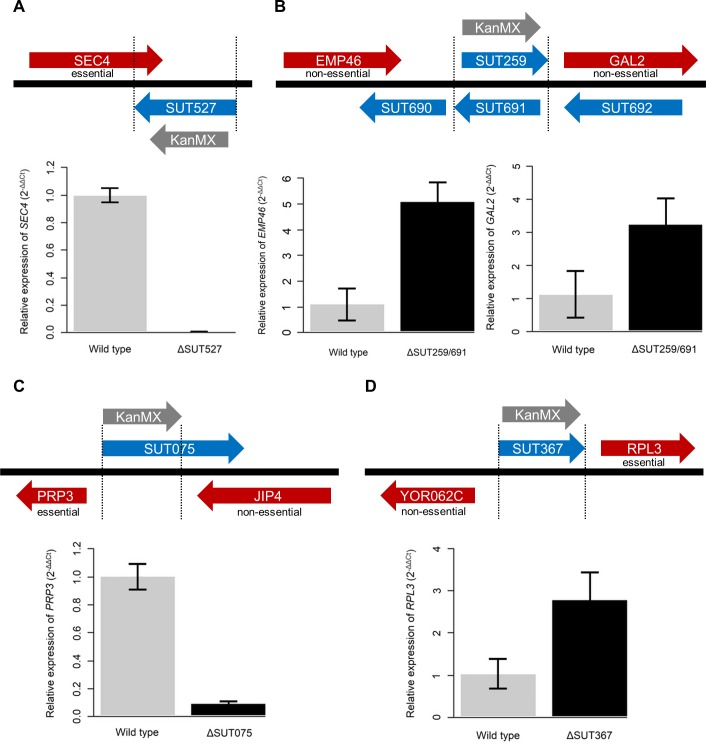
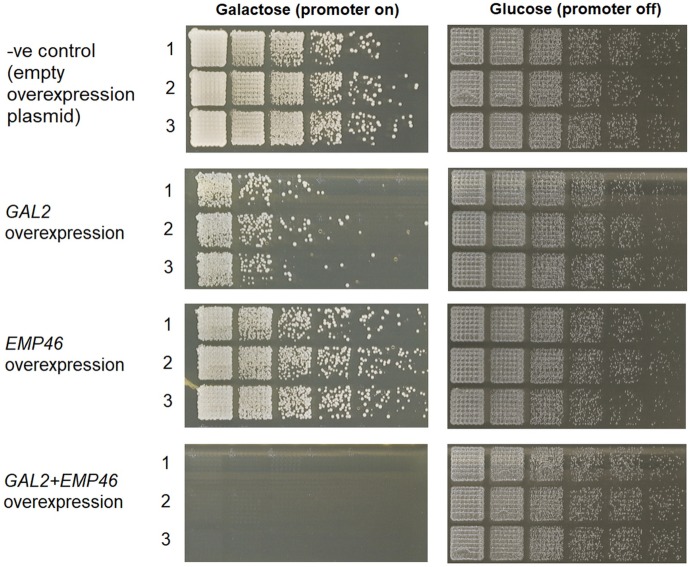
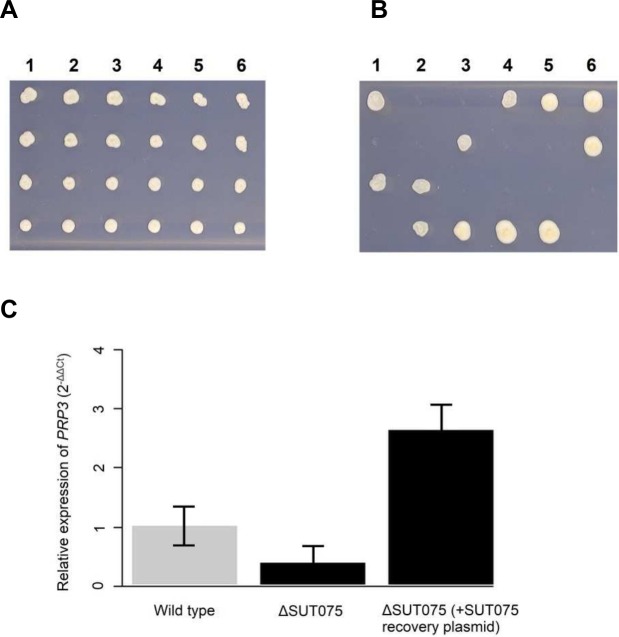
Noncoding RNAs (ncRNAs) are emerging as key regulators of cellular function. We have exploited the recently developed barcoded ncRNA gene deletion strain collections in the yeast Saccharomyces cerevisiae to investigate the numerous ncRNAs in yeast with no known function. The ncRNA deletion collection contains deletions of tRNAs, snoRNAs, snRNAs, stable unannotated transcripts (SUTs), cryptic unstable transcripts (CUTs) and other annotated ncRNAs encompassing 532 different individual ncRNA deletions. We have profiled the fitness of the diploid heterozygous ncRNA deletion strain collection in six conditions using batch and continuous liquid culture, as well as the haploid ncRNA deletion strain collections arrayed individually onto solid rich media. These analyses revealed many novel environmental-specific haplo-insufficient and haplo-proficient phenotypes providing key information on the importance of each specific ncRNA in every condition. Co-fitness analysis using fitness data from the heterozygous ncRNA deletion strain collection identified two ncRNA groups required for growth during heat stress and nutrient deprivation. The extensive fitness data for each ncRNA deletion strain has been compiled into an easy to navigate database called Yeast ncRNA Analysis (YNCA). By expanding the original ncRNA deletion strain collection we identified four novel essential ncRNAs; SUT527, SUT075, SUT367 and SUT259/691. We defined the effects of each new essential ncRNA on adjacent gene expression in the heterozygote background identifying both repression and induction of nearby genes. Additionally, we discovered a function for SUT527 in the expression, 3' end formation and localization of SEC4, an essential protein coding mRNA. Finally, using plasmid complementation we rescued the SUT075 lethal phenotype revealing that this ncRNA acts in trans. Overall, our findings provide important new insights into the function of ncRNAs.


Conflict of interest statement

The authors have declared that no competing interests exist.

Figures

Fig 1
Fig 1. Diagram of competition experiment and analysis of the pool to batch fitness changes.
(A) The pool of heterozygous deletion strains was grown in batch culture before the switch to continuous culture. Samples were taken at the initial pool stage, the batch stage, early steady state (ESS), mid steady state (MSS) and late steady state (LSS). (B) Comparison of fitness between the pool and batch stages under the three indicated carbon-limited conditions. Haplo-proficient deletion strains have positive Log2 fold change and haplo-insufficient deletion strains have negative Log2 fold change. (C) Comparison of fitness between the pool and batch stages under the three indicated nitrogen-limited conditions. Haplo-proficient deletion strains have positive Log2 fold change and haplo-insufficient deletion strains have negative Log2 fold change. Any strains falling outside the grey shaded area have a significant fitness difference (p < 0.05). Graphs where individual points can be identified are found in S4–S9 Tables.
Fig 2
Fig 2. Genome location of ncRNA deletions and RT-PCR quantitation of mRNA levels.
(A) Genome location of CUT248 compared to DPS1. All of CUT248 was deleted. Relative expression of DPS1 in the wild type diploid background is represented by grey bars and DPS1 expression in the CUT248 diploid heterozygous deletion background is represented by black bars. Cells were grown in either rich media (YPD) or N-limited conditions. DPS1: YPD p = 0.006, N-limited p = <0.01. (B) Genome location of SUT233/CUT707 between the HAP4 and KTI12 genes. Relative expression of HAP4 or KTI12 in the wild type diploid background is represented by grey bars and HAP4 or KTI12 expression in the SUT233/CUT707 diploid heterozygous deletion background is represented by black bars. Cells were grown in either rich media (YPD) or N-limited conditions. HAP4: YPD p = 0.97, N-limited p = <0.01. KTI12: YPD p = 0.05, N-limited p = <0.01. The fold change (2^) in expression, relative to the wild-type was calculated using the ΔΔCт method and ACT1 as a reference gene. Error bars were calculated using three independent biological samples. P values were calculated using the Welch two sample t-test.
Fig 3
Fig 3. Analysis of early steady state to late steady state fitness changes.
(A) Comparison of fitness between the early steady state (ESS) and late steady state (LSS) stages under the three indicated carbon-limited conditions. Haplo-proficient deletion strains have positive Log2 fold change and haplo-insufficient deletion strains have negative Log2 fold change. (B) Comparison of fitness between the early steady state (ESS) and late steady state (LSS) stages under the three indicated nitrogen-limited conditions. Haplo-proficient deletion strains have positive Log2 fold change and haplo-insufficient deletion strains have negative Log2 fold change. Any strains falling outside the grey shaded area have a significant fitness difference (p < 0.05). Graphs where individual points can be identified are found in S4–S9 Tables.
Fig 4
Fig 4. Co-fitness analysis.
Variation of fitness profiles in Cluster 1 (A) and Cluster 2 (B). Rows represent individual ncRNA deletion strains. Columns represent the eight growth conditions analysed (B>P: comparison between batch and pool; L>E: comparison between late and early steady state; C-Lim: carbon-limited medium; N-Lim: nitrogen-limited medium). Colour bar represents Log2 fold change between batch and pool or late and early steady state. Haplo-insufficiency is shown in blue, and haplo-proficiency is shown in bright red. Data can be seen in S12 and S13 Tables.
Fig 5
Fig 5. Haploid deletion strain phenotypic screen.
Scatter plot of the normalized colony size values for each of the haploid ncRNA deletion strains growing on YPD plates at 30°C. Any strains falling outside the grey shaded area are significantly different than the wild-type strain (p < 0.05). Data can be seen in S14 and S15 Tables.
Fig 6
Fig 6. Analysis of an essential ncRNA.
(A) Overlap of the ncRNA SUT527 with the 3’ UTR of SEC4. (B) qRT-PCR analysis of SUT527 and SEC4 RNA levels in a strain with SUT527 under control of the tetO7 element. Grey bars represent the relative expression of SUT527 and SEC4 in YPD media (-) Doxycycline. Black bars represent the relative expression of SUT527 and SEC4 in YPD (+) Doxycycline. Error bars (SD) are from three technical replicates from three independent biological replicates. Relative normalized expression was calculated using ACT1. P values were calculated using the Welch two sample t-test. SUT527: p = 0.02, SEC4: p = 0.03. (C) Primer walking of cDNA isolated from cells expressing (-DOX) or not expressing (+DOX) SUT527 to assess 3’ UTR formation. Top panels depict the locations and number of the different back primers used with a common forward primer for the SEC4 and TUB2 RNAs. (D) SEC4 mRNA was localized by FISH in the presence and absence of SUT527 expression. When SUT527 was expressed in YPD (-) DOX, 32% of the SEC4 mRNA was localized to the cell membrane. The absence of SUT527 expression in YPD (+) DOX decreased localisation of SEC4 mRNA to 13%. (E) SUT527 localization was determined by FISH. Under normal growth with YPD 33% of SUT527 was observed in foci at the cell surface similar to the localization of SEC4. (F) Three representative images of SEC4 (red) and SUT527 (green) localized together in the same cells. Nuclei are stained with DAPI (blue). Scale bars, 1μm.
Fig 7
Fig 7. Genome locations of the essential ncRNAs and the expression of nearby genes.
The ncRNA deletions are indicated by vertical black dotted lines and the direction of KanMX deletion cassette expression is indicated with a grey arrow. Red arrows are protein coding genes and the arrows encompass the annotated 5’ and 3’ UTR regions. The essentiality of nearby protein coding genes is indicated. (A) SUT527 full deletion. Relative expression of SEC4 in the wild type diploid background is represented by grey bar and SEC4 expression in the SUT527 diploid deletion background is represented by black bar. SEC4: p = 0.02. (B) Overlapping SUT259/691 deletion. Relative expression of EMP46 and GAL2 in the wild type diploid background is represented by grey bars and EMP46 and GAL2 expression in the SUT259/691 diploid deletion background is represented by black bars. EMP46: p = 0.02, GAL2: p = 0.02. (C) SUT075 partial deletion. Relative expression of PRP3 in the wild type diploid background is represented by grey bar and PRP3 expression in the SUT075 diploid deletion background is represented by black bar. PRP3: p = 0.04. (D) SUT367 full deletion. Relative expression of RPL3 in the wild type diploid background is represented by grey bar and RPL3 expression in the SUT367 diploid deletion background is represented by black bar. RPL3: p = 0.02. The fold change (2^) in expression, relative to the wild-type was calculated using the ΔΔCт method and ACT1 as a reference gene. Error bars were calculated using three independent biological samples. P values were calculated using the Welch two sample t-test.
Fig 8
Fig 8. Spot assays for strains containing EMP46, GAL2, EMP46/GAL2 or empty pBEVY-GA overexpression plasmids.
The comparative fitness of the identified strain when grown on galactose media or glucose media, which activates and inactivates the GAL1/10 promoter, respectively.
Fig 9
Fig 9. Expression of SUT075 in trans rescues the lethal phenotype of a SUT075 deletion and increases PRP3 expression.
(A) Haploid spores from dissection of six MATa SUT075Δ/SUT075 diploid tetrads were spotted on SD media lacking uracil and containing 2% galactose. The plasmid expressing the SUT075 ncRNA is selected for using the URA auxotrophic marker. Galactose induces expression of SUT075 present in the plasmid. (B) Haploid spores from dissection of six MATa SUT075Δ/SUT075 diploid tetrads were spotted on SD media lacking uracil containing 2% galactose and 300mg/L G418 disulphate. G418 resistance selects for haploids deleted for SUT075. Spores growing in both panels A and B are considered to contain the G418 resistance SUT075 deletion cassette and the SUT075 ncRNA expressing plasmid. (C) Expression levels of PRP3 in the ΔSUT075 and the ΔSUT075 (+ sense SUT075 recovery plasmid) heterozygote diploid strains measured by qRT-PCR. The relative expression of PRP3 in the wild-type background is represented by a grey bar and a black bar in the ncRNA deletion strain backgrounds. Using the ΔΔCт method and ACT1 as a reference gene, the fold change (2^) in expression, relative to the wild-type was calculated. Error bars are calculated using each of the three independent biological samples. P values calculated using the Welch two sample t-test determine there to be a significant difference (p = 0.02) between the ΔSUT075 and the ΔSUT075 (+ sense SUT075 recovery plasmid) strains.

References

    1. Raina M, Ibba M (2014) tRNAs as regulators of biological processes. FrontGenet 5: 171. - PMC - PubMed
    1. Turowski TW, Tollervey D (2015) Cotranscriptional events in eukaryotic ribosome synthesis. WIREs-RNA 6: 129–139. doi: 10.1002/wrna.1263 - DOI - PubMed
    1. Massenet S, Bertrand E, Verheggen C (2017) Assembly and trafficking of box C/D and H/ACA snoRNPs. RNA Biol 14: 680–692. doi: 10.1080/15476286.2016.1243646 - DOI - PMC - PubMed
    1. Papasaikas P, Valcarcel J (2016) The Spliceosome: The Ultimate RNA Chaperone and Sculptor. Trends Biochem Sci 41: 386–386. doi: 10.1016/j.tibs.2015.12.010 - DOI - PubMed
    1. Djebali S, Davis CA, Merkel A, Dobin A, Lassmann T, et al. (2012) Landscape of transcription in human cells. Nature 489: 101–108. doi: 10.1038/nature11233 - DOI - PMC - PubMed

Publication types

LinkOut - more resources