. 2018 Mar 12;13(3):e0192544.
doi: 10.1371/journal.pone.0192544. eCollection 2018.

Localization of RNA and translation in the mammalian oocyte and embryo

Affiliations

Localization of RNA and translation in the mammalian oocyte and embryo

Denisa Jansova et al. PLoS One. .

Abstract

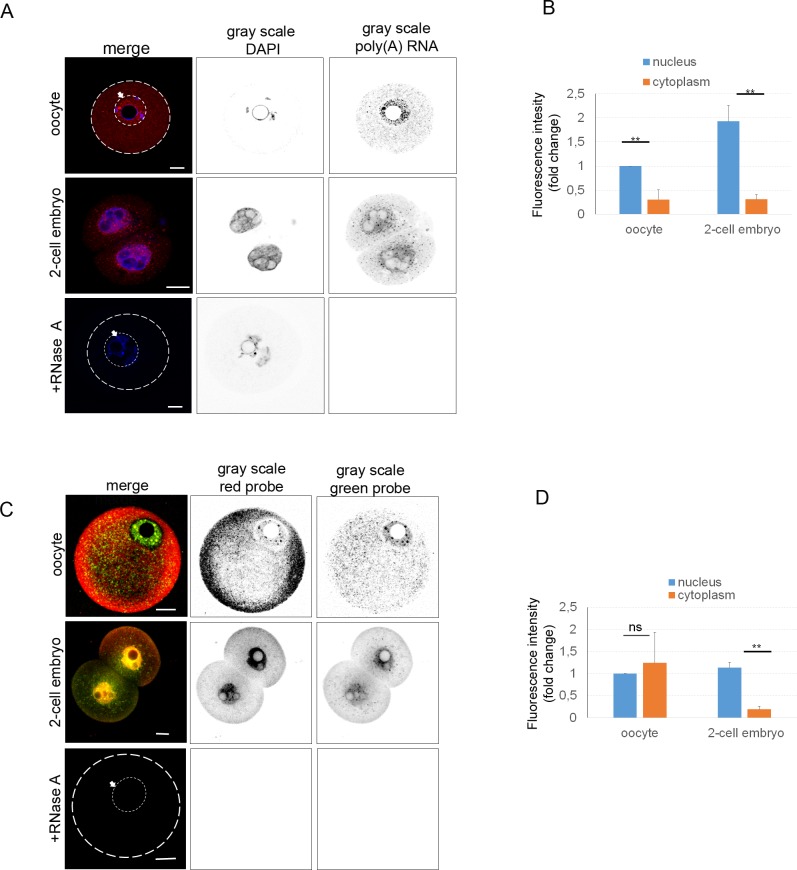
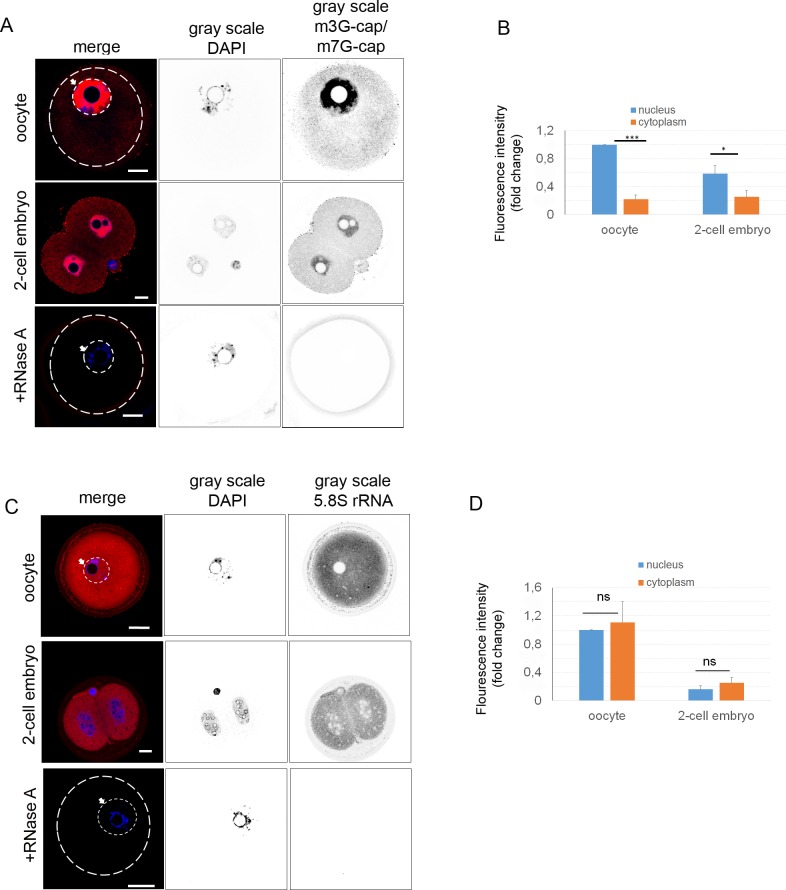
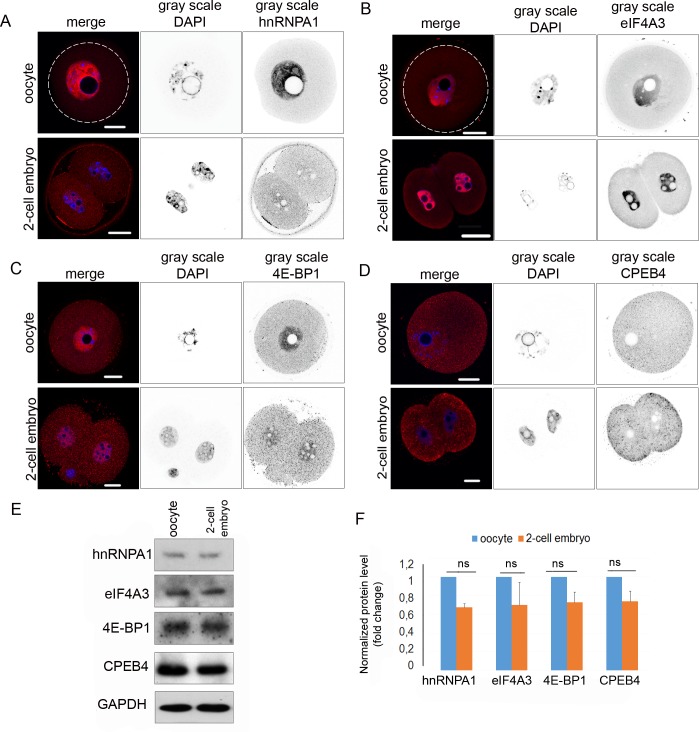
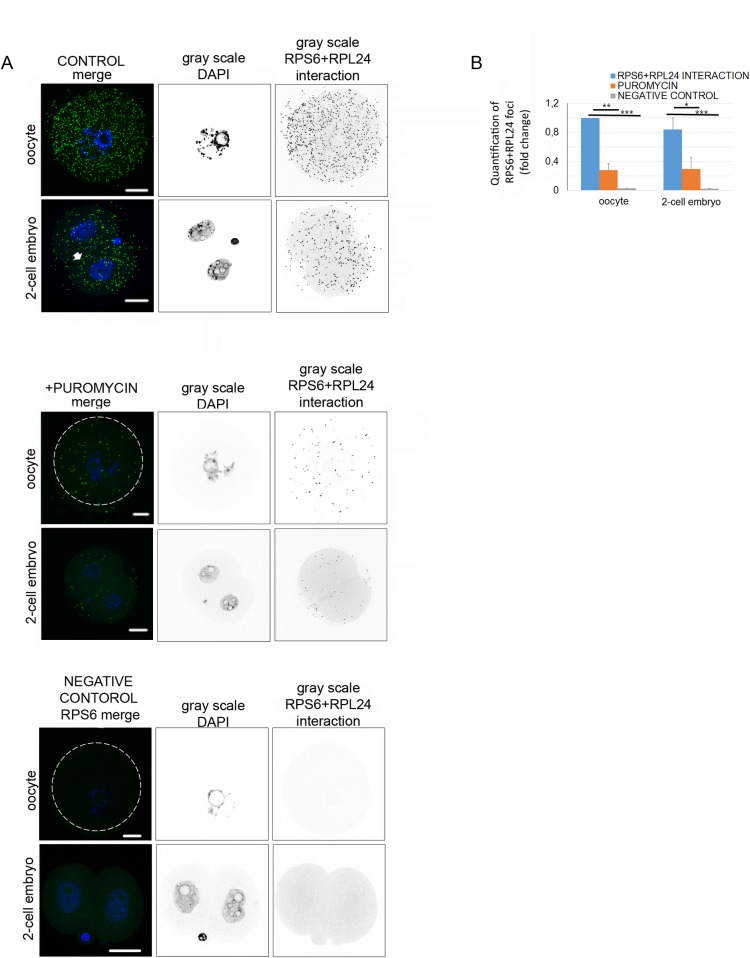
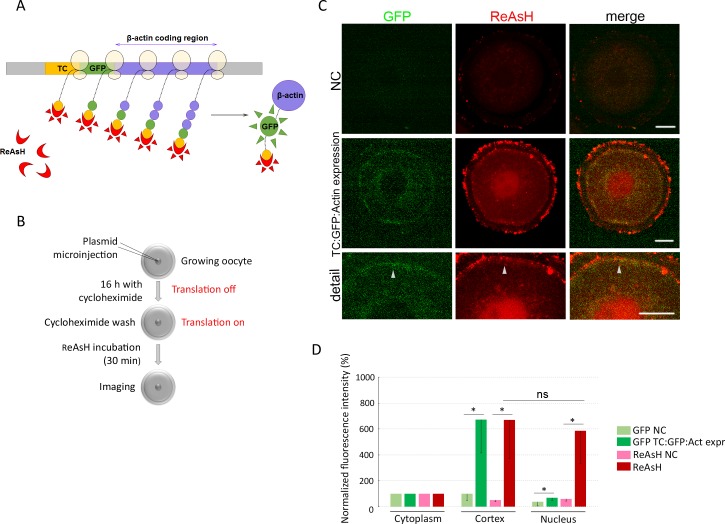
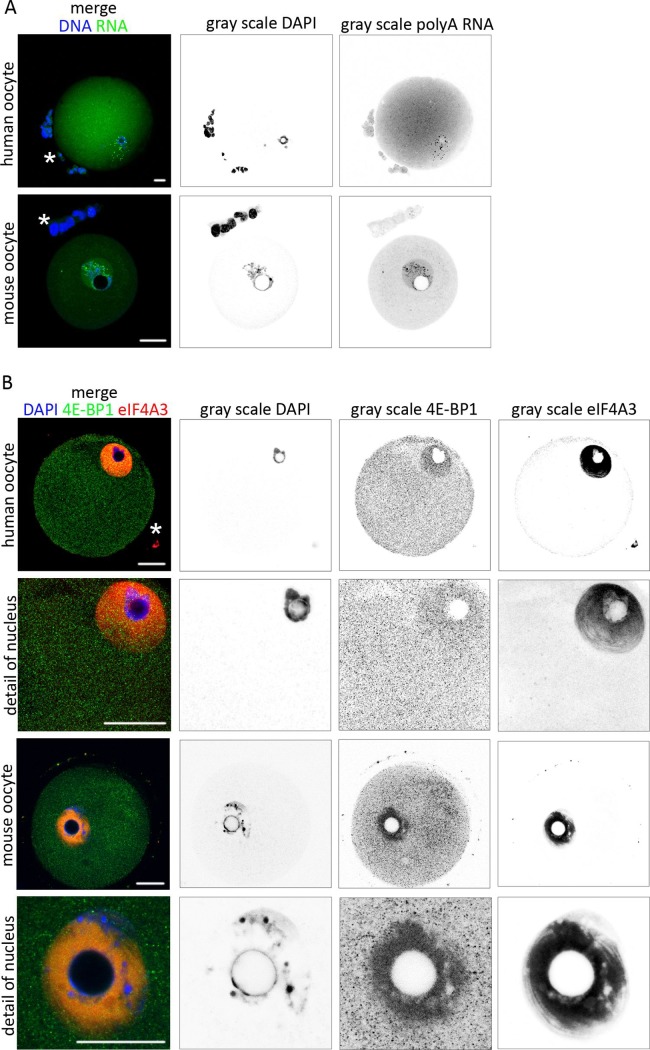
The tight correlation between mRNA distribution and subsequent protein localization and function indicate a major role for mRNA localization within the cell. RNA localization, followed by local translation, presents a mechanism for spatial and temporal gene expression regulation utilized by various cell types. However, little is known about mRNA localization and translation in the mammalian oocyte and early embryo. Importantly, fully-grown oocyte becomes transcriptionally inactive and only utilizes transcripts previously synthesized and stored during earlier development. We discovered an abundant RNA population in the oocyte and early embryo nucleus together with RNA binding proteins. We also characterized specific ribosomal proteins, which contribute to translation in the oocyte and embryo. By applying selected markers to mouse and human oocytes, we found that there might be a similar mechanism of RNA metabolism in both species. In conclusion, we visualized the localization of RNAs and translation machinery in the oocyte, that could shed light on this terra incognita of these unique cell types in mouse and human.


Conflict of interest statement

Competing Interests: The authors have declared that no competing interests exist.

Figures

Fig 1
Fig 1. Localization of transcriptome in oocyte and embryo.
A) Single Z-stack from confocal images of GV (germinal vesicle) oocyte stage and 2-cell embryo. RNA FISH detecting poly(A) RNA subpopulation (red; oligo(dT) probe), and the gray scale shows separated light channels (DAPI and oligo(dT) probe). The arrow with the white line indicates the nucleus of the oocyte. As a negative control RNA was digested by RNase A after the cell permeabilization step. Scale bars 20 μm. The cortex of the oocyte is indicated by the white line. B) Quantification of fluorescence intensity of poly(A) RNA of equatorial Z-stack, in the nucleus and cytoplasm of oocyte and embryo, relatively compared to the nucleus of the oocyte. The experiment was repeated 3 times, with 15 oocytes and embryos per experiment. Data are represented as mean ± s.d.; the values bars with ns are not significant, and the asterisk denotes statistically significant differences *p<0.05; **p<0.01; ***p<0.001. C) Rolling circle amplification FISH using random hexamers probes showing distribution of global RNA. The arrow with the white line indicates the nucleus of the oocyte. The gray scale shows separated channels (red and green probe). The cortex of the oocyte is indicated by the white line. As a negative control RNA was digested by RNase A after cell permeabilization step. Scale bars 20 μm. D) Quantification of fluorescence intensity of whole transcriptome in the nucleus and cytoplasm. The value of the nucleus was set as 1. The experiment was repeated 3 times, with 12 oocytes and 10 embryos per experiment. Data are represented as mean ± s.d.; the values bars with ns are not significant, and the asterisk denotes statistically significant differences *p<0.05; **p<0.01; ***p<0.001.
Fig 2
Fig 2. Localization of rRNA and RNA in oocyte and embryo.
A) Antibody detecting m3G-cap and m7G-cap indicates cap-structure at the 5’UTR of mRNA (red). DNA stained with DAPI (blue). The gray scale shows separated light channels. The arrow with the white line indicates the nucleus of the oocyte. As a negative control RNA was digested by RNase A after the cell permeabilization step. The cortex of the oocyte is indicated by the white line. Scale bars 20 μm. The experiments were repeated 3 times, with 25 oocytes/embryos per experiment. B) Quantification of fluorescence intensity of 5’UTR cap-structure of equatorial Z-stacks, in the nucleus and cytoplasm of oocyte and embryo, relatively compared to nucleus of oocyte. The experiment was repeated 3 times, with 25 oocytes/embryos per experiment. Data are represented as mean ± s.d.; the value bars with ns are not significant, and the asterisk denotes statistically significant differences * p<0.05; **p<0.01; ***p<0.001. C) Distribution of 5.8S rRNA in the oocyte and early embryo (red). DNA stained with DAPI (blue). The gray scale shows separated light channels. The arrow with the white line indicates the nucleus of the oocyte. As a negative control RNase A digestion was used after the cell permeabilization step. The white line indicates the oocyte cortex. The experiment was repeated 3 times, with 25 oocytes/embryos per experiment. D) Quantification of fluorescence intensity of 5.8S rRNA in the nucleus and cytoplasm from equatorial Z-stacks. The value of the oocyte nucleus was set as 1; other values are represented as a ratio to the intensity of the oocyte nucleus. The experiment was repeated 3 times, with 25 oocytes/embryos per experiment. Data are represented as mean ± s.d.; the value bars with ns are not significant, and the asterisk denotes statistically significant differences * p<0.05; **p<0.01; ***p<0.001.
Fig 3
Fig 3. Localization of specific RNAs in GV oocyte, 2-cell embryo and NIH3T3 cells.
A) Confocal images of smRNA FISH of Dazl (green) in GV oocyte, 2-cell embryo and NIH3T3 cells. DNA stained with DAPI (blue). The gray scale shows separated channels. The arrow with the white line indicates the nucleus of the oocyte. The asterisk indicates cumulus cells. The white line indicates the cortex of the oocyte. Scale bars 20 μm. The experiment was repeated 3 times, with 15 oocytes/embryos per experiment. B) Confocal images of smRNA FISH of β-actin (green) in GV oocyte, 2-cell embryo and NIH3T3 cells (DNA stained with DAPI (blue)). The gray scale shows separated light channels. Scale bars 20 μm. The experiment was repeated 3 times, with 15 oocytes and embryos per experiment. C) Confocal images of smRNA FISH of Neat2 lncRNA (green) in GV oocyte, 2-cell embryo and NIH3T3 cells. DNA stained with DAPI (blue). The gray scale shows separated channels. The arrow with the white line indicates the nucleus of the oocyte. The white line indicates the cortex of the oocyte. Scale bars 20 μm. The experiment was repeated 3 times, with 15 oocytes/embryos per experiment. D) Quantification of fluorescence intensity of Dazl mRNA in the nucleus and cytoplasm from equatorial Z-stacks. The value of the oocyte nucleus was set as 1. The experiment was repeated 3 times, with 15 oocytes/embryos per experiment. Data are represented as mean ± s.d.; the values bars with ns are not significant, and the asterisk denotes statistically significant differences * p<0.05; **p<0.01; ***p<0.001. E) Quantification of fluorescence intensity of β-actin mRNA in the nucleus and cytoplasm from equatorial Z-stacks. Value of oocyte nucleus was set as 1. The experiment was repeated 3 times, with 15 oocytes and embryos per experiment. Data are represented as mean ± s.d.; the value bars with ns are not significant, asterisk denotes statistically significant differences * p<0.05; **p<0.01; ***p<0.001. F) Quantification of fluorescence intensity of Neat2 lncRNA in the nucleus and cytoplasm from equatorial Z-stacks. The value of the oocyte nucleus was set as 1. The experiment was repeated 3 times, with 15 oocytes and embryos per experiment. Data are represented as mean ± s.d.; the value bars with ns are not significant, and the asterisk denotes statistically significant differences * p<0.05; **p<0.01; ***p<0.001.
Fig 4
Fig 4. Localization and expression levels of RNA binding proteins in GV oocyte and 2-cell embryo.
A) Representative confocal images of GV oocyte and 2-cell stage embryo stained with hnRNPA1 antibody (red), DNA stained with DAPI (blue); the gray scale images show separated light channels. The white line indicates the cortex of the oocyte. Scale bars 20 μm. The experiment was repeated 3 times, with 25 oocytes/embryos per experiment. B) Representative confocal image of GV oocyte and 2-cell embryo stained with eIF4A3 antibody (red), DNA stained with DAPI (blue); the gray scale images show separated light channels. The white line indicates the cortex of the oocyte. Scale bars 20 μm. The experiment was repeated 3 times, with 25 oocytes/embryos per experiment. C) Representative confocal image of GV oocyte and 2-cell embryo stained with 4E-BP1 antibody (red), DNA stained with DAPI (blue); the gray scale images show separated light channels. White line indicate cortex of oocyte. Scale bars 20 μm. The experiment was repeated 3 times, with 25 oocytes per experiment. D) Representative confocal image of GV oocytes and 2-cell embryo stained with CPEB4 antibody (red), DNA stained with DAPI (blue); the gray scale images show separated light channels. The white line indicates the cortex of the oocyte. Scale bars 20 μm. The experiment was repeated 3 times, with 25 oocytes/embryos per experiment. E) Representative images from WB probed by antibodies for hnRNPA1, eIF4A3, 4E-BP1, and CPEB4 proteins in the GV oocytes and 2-cell stage embryos. GAPDH was used as a loading control. WBs were performed 3 times, with 100 cells per experiment. F) Quantification of hnRNPA1, eIF4A3, 4E-BP1 and CPEB4 expression in the oocytes and embryos. Data were normalized to GAPDH. The values of oocytes were set as 1. Data are represented as mean ± s.d.; the value bars with ns are not significant, and the asterisk denotes statistically significant differences * p<0.05; **p<0.01; ***p<0.001.
Fig 5
Fig 5. Localization and expression levels of selected ribosomal proteins.
A) Confocal images of GV oocyte and 2-cell stage embryo probed with RPS14 antibody (red), DNA stained with DAPI (blue); the gray scale shows separated light channels. Scale bars 20 μm. The experiment was repeated 3 times, with 25 oocytes/embryos per experiment. B) Confocal images of GV oocyte and 2-cell stage embryo probed with RPS3 antibody (red), DNA stained with DAPI (blue); the gray scale shows separated light channels. The asterisk indicates cumulus cells. Scale bars 20 μm. The experiment was repeated 3 times, with 25 oocytes/embryos per experiment. C) Confocal images of GV oocyte and 2-cell stage embryo probed with RPS6(S235/236) antibody (red), DNA stained with DAPI (blue); the gray scale shows separated light channels. Scale bars 20 μm. The experiment was repeated 3 times, with 25 oocytes/embryos per experiment. D) Confocal images of GV oocyte and 2-cell stage embryo probed with RPL7 antibody (red); DNA stained with DAPI (blue); the gray scale shows separated light channels. Scale bars 20 μm. The experiment was repeated 3 times, with 25 oocytes/embryos per experiment. E) Confocal images of GV oocyte and 2-cell stage embryo probed with RPL24 antibody (red). DNA stained with DAPI (blue); the gray scale images shows separated light channels. Scale bars 20 μm. The experiment was repeated 3 times, with 25 oocytes/embryos per experiment. F) Representative images from WBs for RPS14, RPS3, RPS6 (S235/236), RPL7, RPL24 protein expression in GV oocytes and 2-cell stage embryos, and the loading control (GAPDH); WB was repeated 3 times, with 100 oocytes/embryos per experiment. G) Quantification of expression of RPS14, RPS3, RPS6 (S235/236), RPL7 and RPL24 proteins in the oocyte and embryo. Data were normalized to GAPDH. Data are represented as the mean ± s.d.; the values obtained from oocytes were set as 1. The value bars with ns are not significant, the asterisk denotes statistically significant differences *p<0.05; **p<0.01; ***p<0.001.
Fig 6
Fig 6. Detection of in situ translation in oocyte and embryo.
A) Proximity ligation assay (PLA) detects interaction of two translational components RPL24 and RPS6 in the oocyte and 2-cell embryo. Fluorescent foci indicate RPL24 and RPS6 interactions (green) in the oocyte and embryo. As negative controls, oocytes and 2-cell embryos were treated with the translational inhibitor puromycin, or a single RPS6 antibody was used. DNA stained with DAPI (blue); the gray scale shows separated channels. Scale bar 20μm. The experiment was repeated 3 times, with 25 oocytes/embryos per experiment. B) Graph shows quantification of RPL24 and RPS6 interactions in the whole cell volume. The values obtained from the oocyte were set as 1. The experiment was repeated 3 times, with 25 oocytes/embryos per experiment. Data are represented as mean ± s.d.; the value bars with ns are not significant, and the asterisk denotes statistically significant differences *p<0.05; **p<0.01; ***p<0.001.
Fig 7
Fig 7. Visualization of translation of endogenous β-actin mRNA in live oocyte.
A) Scheme of the TC GFP β-actin construct and detection of nascent translation. TC—tetracystein sequence; GFP—green fluorescent protein sequence; β-actin—open reading frame; ReAsH—resorufin arsenical hairpin binder. B) Scheme of the experimental procedures for translational detection of the β-actin RNA in the live oocyte. C) Representative confocal images of the oocyte microinjected with TC GFP β-actin plasmid and of non-injected control. ReAsH dye labels TC tag (red) of newly translated β-actin protein. GFP (green) was used as a marker of fully translated β-actin. The arrowheads depict nascent translation of β-actin RNA. Scale bars 10 µm. D) Quantification of the fluorescence intensity in the cytoplasm, cortex and nucleus. The values of the cytoplasm were set as 100%. The experiment was repeated 3 times, with 10 oocytes per experiment. Data are represented as mean ± s.d.; the value bars with ns are not significant; and the asterisk denotes statistically significant differences *p<0.05; **p<0.01; ***p<0.001.
Fig 8
Fig 8. Localization of poly(A) RNA and RNA binding proteins in human oocyte.
A) Single Z-stack from confocal images of human and mouse GV oocytes. RNA FISH detecting poly(A) RNA subpopulation (green) and DNA (blue). The gray scale shows separated light channels. The asterisk indicates cumulus cells. The experiment was repeated 3 times, with 15 mouse oocytes per experiment and 3 human oocytes per experiment. Scale bars 20 μm. B) Single Z-stack of human and mouse GV oocytes and 2-cell stage mouse embryos probed with 4E-BP1 (green) and eIF4A3 (red) and DAPI (blue). The gray scale shows separated channels. The experiment was repeated 3 times, with 15 mouse oocytes and 3 human oocytes. Scale bars 20 μm. The asterisk indicates cumulus cells.

References

    1. Schultz RM. Regulation of zygotic gene activation in the mouse. BioEssays News Rev Mol Cell Dev Biol. 1993;15: 531–538. doi: 10.1002/bies.950150806 - DOI - PubMed
    1. Ellederova Z, Kovarova H, Melo-Sterza F, Livingstone M, Tomek W, Kubelka M. Suppression of translation during in vitro maturation of pig oocytes despite enhanced formation of cap-binding protein complex eIF4F and 4E-BP1 hyperphosphorylation. Mol Reprod Dev. 2006;73: 68–76. doi: 10.1002/mrd.20368 - DOI - PubMed
    1. Tomek W, Melo Sterza FA, Kubelka M, Wollenhaupt K, Torner H, Anger M, et al. Regulation of translation during in vitro maturation of bovine oocytes: the role of MAP kinase, eIF4E (cap binding protein) phosphorylation, and eIF4E-BP1. Biol Reprod. 2002;66: 1274–1282. - PubMed
    1. Flemr M, Ma J, Schultz RM, Svoboda P. P-body loss is concomitant with formation of a messenger RNA storage domain in mouse oocytes. Biol Reprod. 2010;82: 1008–1017. doi: 10.1095/biolreprod.109.082057 - DOI - PMC - PubMed
    1. Femino AM, Fay FS, Fogarty K, Singer RH. Visualization of single RNA transcripts in situ. Science. 1998;280: 585–590. - PubMed

Publication types