. 2018 Sep;59(3):346-354.
doi: 10.1165/rcmb.2017-0404OC.

The Microbiome Regulates Pulmonary Responses to Ozone in Mice

Affiliations

The Microbiome Regulates Pulmonary Responses to Ozone in Mice

Youngji Cho et al. Am J Respir Cell Mol Biol. 2018 Sep.

Abstract

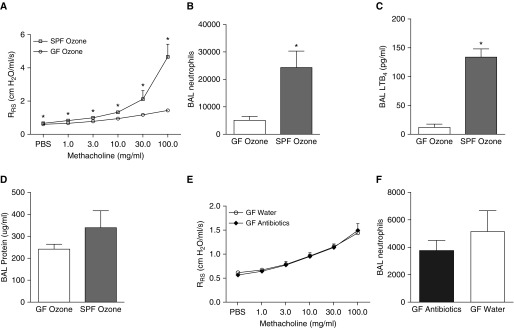
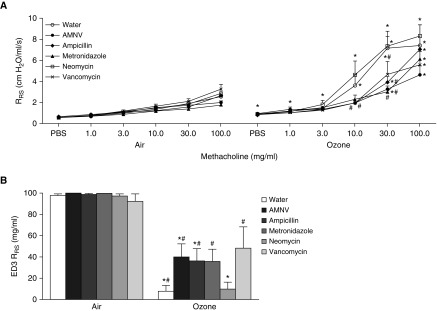
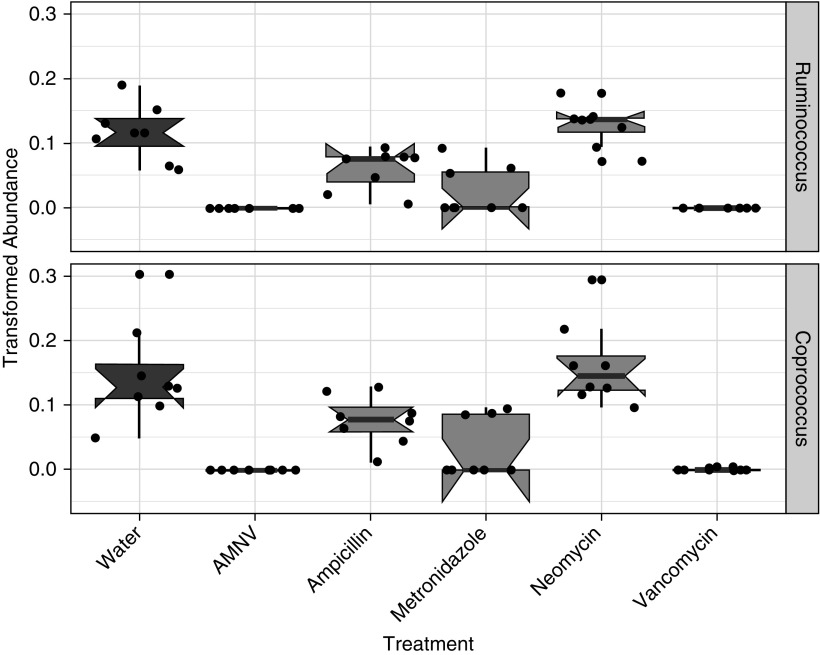
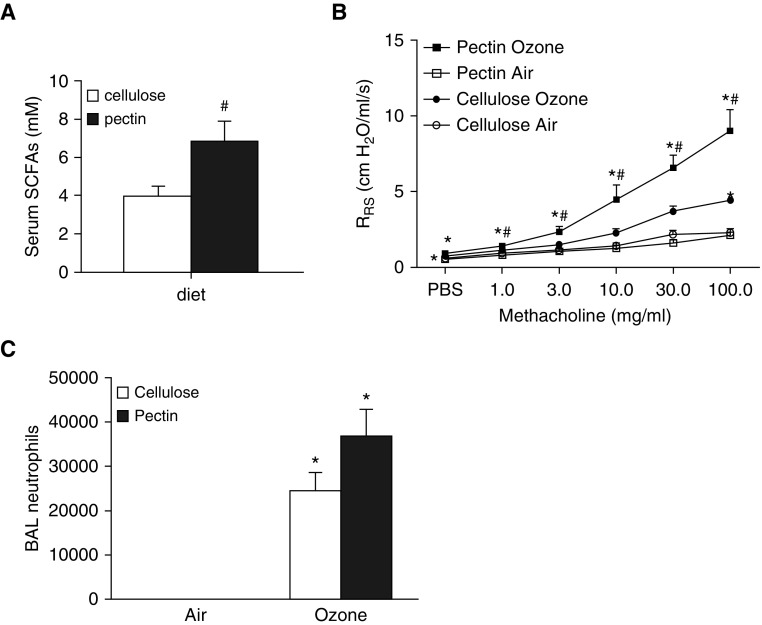
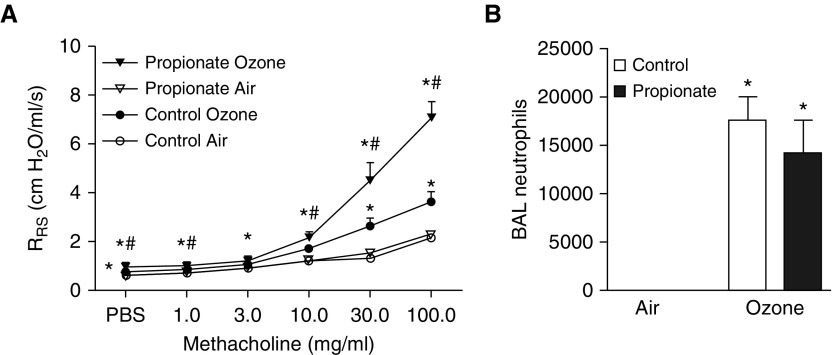
Previous reports demonstrate that the microbiome impacts allergic airway responses, including airway hyperresponsiveness, a characteristic feature of asthma. Here we examined the role of the microbiome in pulmonary responses to a nonallergic asthma trigger, ozone. We depleted the microbiota of conventional mice with either a single antibiotic (ampicillin, metronidazole, neomycin, or vancomycin) or a cocktail of all four antibiotics given via the drinking water. Mice were then exposed to room air or ozone. In air-exposed mice, airway responsiveness did not differ between antibiotic- and control water-treated mice. Ozone caused airway hyperresponsiveness, the magnitude of which was decreased in antibiotic cocktail-treated mice versus water-treated mice. Except for neomycin, single antibiotics had effects similar to those observed with the cocktail. Compared with conventional mice, germ-free mice also had attenuated airway responsiveness after ozone. 16S ribosomal RNA gene sequencing of fecal DNA to characterize the gut microbiome indicated that bacterial genera that were decreased in mice with reduced ozone-induced airway hyperresponsiveness after antibiotic treatment were short-chain fatty acid producers. Serum analysis indicated reduced concentrations of the short-chain fatty acid propionate in cocktail-treated mice but not in neomycin-treated mice. Dietary enrichment with pectin, which increased serum short-chain fatty acids, also augmented ozone-induced airway hyperresponsiveness. Furthermore, propionate supplementation of the drinking water augmented ozone-induced airway hyperresponsiveness in conventional mice. Our data indicate that the microbiome contributes to ozone-induced airway hyperresponsiveness, likely via its ability to produce short-chain fatty acids.

Keywords: 16S rRNA gene sequencing; airway responsiveness; antibiotics; germ-free mice; neutrophil.


Figures

Figure 1.
Figure 1.
An antibiotic cocktail attenuates O3-induced airway hyperresponsiveness (AHR) and neutrophil recruitment. Mice were treated with a cocktail of four antibiotics via their drinking water (ampicillin 1 g/L, metronidazole 1 g/L, neomycin 1 g/L, vancomycin 0.5 g/L [AMNV]). Sucralose (8 g/L) was added for taste. Control mice were given regular drinking water with sucralose. Shown are (A) airway responsiveness to methacholine; (B) BAL neutrophils; (C) BAL macrophages; (D) BAL protein, a marker of lung barrier injury; and (E) BAL leukotriene B4 (LTB4) 24 hours after exposure to air or O3 (2 ppm for 3 h). Results are mean ± SE of data from n = 6–8 per group. *P < 0.05 compared with air-exposed mice given the same treatment; #P < 0.05 compared with mice with control drinking water with the same exposure. RRS = respiratory system resistance.
Figure 2.
Figure 2.
Germ-free (GF) mice have reduced responses to O3 compared with specific-pathogen-free (SPF) mice. Shown are (A) airway responsiveness, (B) BAL neutrophils, (C) BAL LTB4, and (D) BAL protein in O3-exposed GF mice and age- and sex-matched SPF mice treated with water. Also shown are (E) airway responsiveness and (F) BAL neutrophils in O3-exposed GF mice treated with water versus the antibiotic cocktail (AMNV). Results are mean ± SE of data from n = 8 per group. *P < 0.05 compared with GF.
Figure 3.
Figure 3.
Treatment with ampicillin, metronidazole, and vancomycin, but not neomycin, attenuates O3-induced AHR. Mice were treated with water, an antibiotic cocktail (AMNV), or individual antibiotics (ampicillin 1 g/L, metronidazole 1 g/L, neomycin 1 g/L, and vancomycin 0.5 g/L). Shown are (A) RRS and (B) effective dose 3 (ED3), the dose of methacholine required to cause an increase in RRS of 3 cm H2O/ml/s. ED3 was assigned a value of 100 if RRS did not increase by 3 cm H2O/ml/s by the last dose of methacholine. Results are mean ± SE of data from n = 6–8 per group. *P < 0.05 compared with air (see expanded scale in Figure E1 to determine which groups were different at the low doses); #P < 0.05 compared with water.
Figure 4.
Figure 4.
Ruminococcus and Coprococcus genera decreased with antibiotic treatments that attenuated O3-induced AHR. 16S rRNA gene sequencing analysis indicated that the relative abundances of (A) Ruminococcus and (B) Coprococcus genera were significantly decreased in AMNV-, ampicillin-, metronidazole-, and vancomycin-treated animals but not in neomycin-treated mice. Relative abundance was assessed using MaAsLin (50) with a q value (false discovery rate corrected using the Benjamini-Hochberg correction method) < 0.25 considered significant. Each dot indicates one mouse, with n = 8 per treatment group.
Figure 5.
Figure 5.
Effect of dietary fiber on O3-induced AHR. (A) Serum short-chain fatty acid (SCFA) levels (acetate plus propionate plus butyrate) in mice treated with diets in which 30% by weight of the food derived from either pectin or cellulose and exposed to air. (B) Airway responsiveness and (C) BAL neutrophils in cellulose- and pectin-treated mice exposed to room air or O3. Results are mean ± SE of data from n = 6–8 mice per group. *P < 0.05 compared with air; #P < 0.05 compared with cellulose.
Figure 6.
Figure 6.
Effect of exogenous propionate on O3-induced AHR. (A) Airway responsiveness and (B) BAL neutrophils of saline-treated (control) versus propionate-treated mice exposed to room air or O3. Results are mean ± SE of data from n = 10–14 per group. *P < 0.05 compared with air; #P < 0.05 compared with control.

Comment in

References

    1. Cernadas M. It takes a microbiome: commensals, immune regulation, and allergy. Am J Respir Crit Care Med. 2011;184:149–150. - PubMed
    1. Huang YJ, Boushey HA. The microbiome in asthma. J Allergy Clin Immunol. 2015;135:25–30. - PMC - PubMed
    1. Marri PR, Stern DA, Wright AL, Billheimer D, Martinez FD.Asthma-associated differences in microbial composition of induced sputum J Allergy Clin Immunol 2013131346–352.e1-3 - PMC - PubMed
    1. Hilty M, Burke C, Pedro H, Cardenas P, Bush A, Bossley C, et al. Disordered microbial communities in asthmatic airways. PLoS One. 2010;5:e8578. - PMC - PubMed
    1. Chen Y, Blaser MJ. Inverse associations of Helicobacter pylori with asthma and allergy. Arch Intern Med. 2007;167:821–827. - PubMed

Publication types

MeSH terms