

Transsaccadic Perception Deficits in Schizophrenia Reflect the Improper Internal Monitoring of Eye Movement Rather Than Abnormal Sensory Processing
- PMID: 29529412
- PMCID: PMC5851461
- DOI: 10.1016/j.bpsc.2017.06.004
Transsaccadic Perception Deficits in Schizophrenia Reflect the Improper Internal Monitoring of Eye Movement Rather Than Abnormal Sensory Processing
Abstract
Background: Symptoms of psychosis in schizophrenia reflect disturbances in sense of agency-difficulty distinguishing internally from externally generated sensory and perceptual experiences. One theory attributes these anomalies to a disruption in corollary discharge (CD), an internal copy of generated motor commands used to distinguish self-movement-generated sensations from externally generated stimulation.
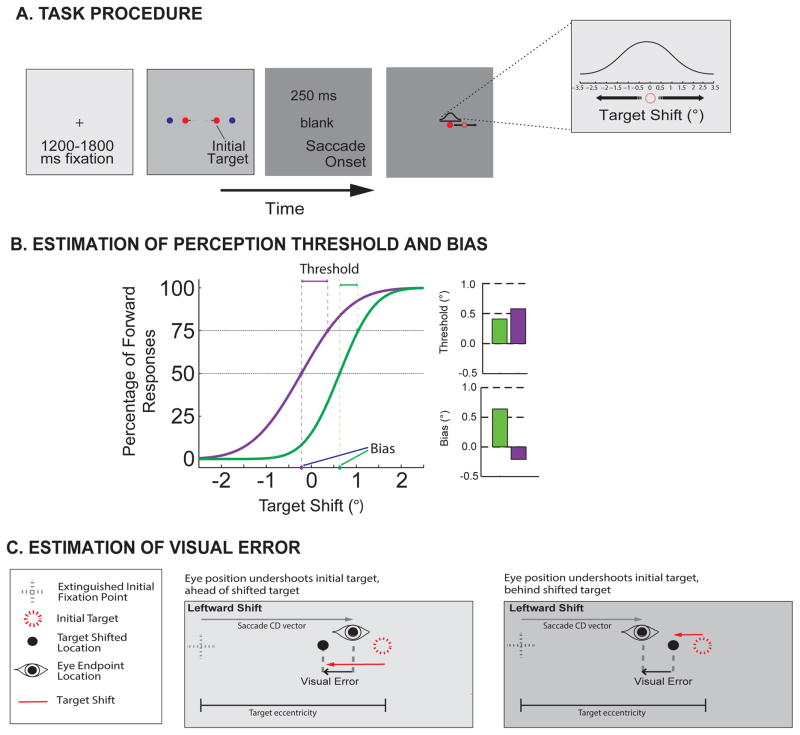
Methods: We used a transsaccadic shift detection paradigm to examine possible deficits in CD and sense of agency based on the ability to perceive visual changes in 31 schizophrenia patients (SZPs) and 31 healthy control subjects. We derived perceptual measures based on manual responses indicating the transsaccadic target shift direction. We also developed a distance-from-unity-line measure to quantify use of CD versus purely sensory (visual) information in evaluating visual changes in the environment after an eye movement.
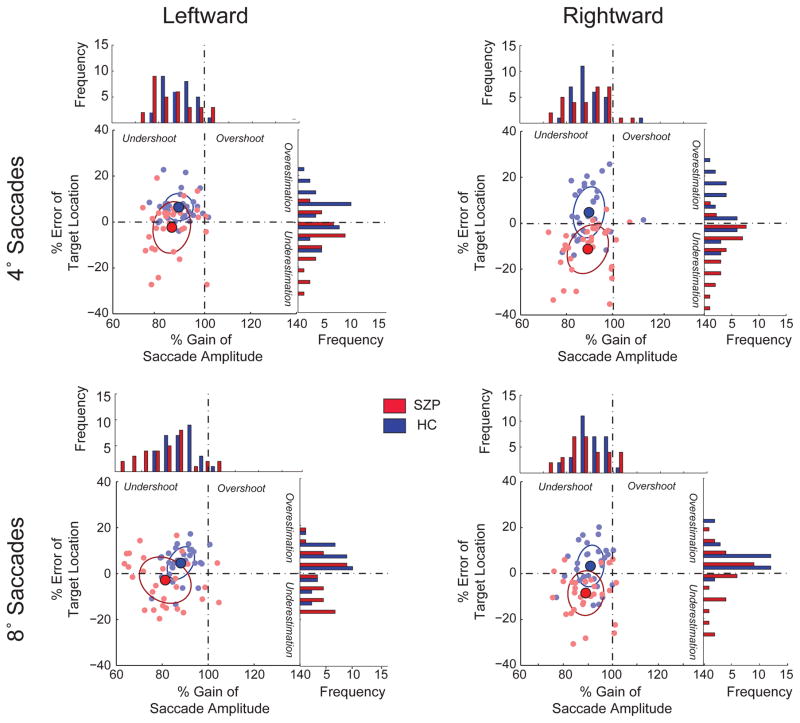
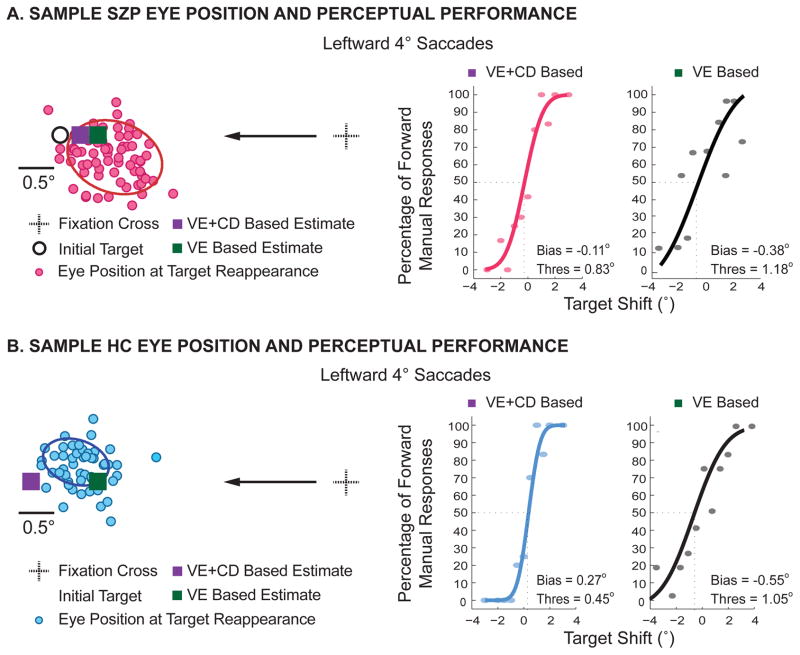
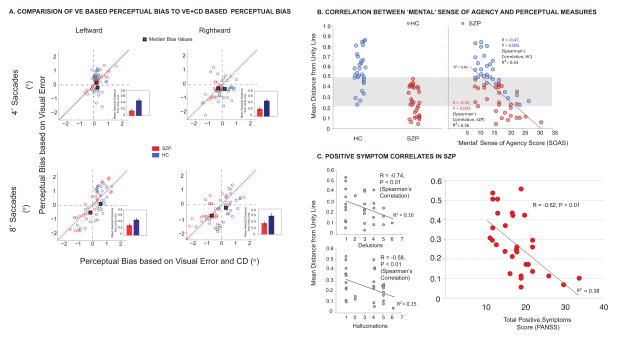
Results: SZPs had higher perceptual thresholds in detecting shift of target location than healthy control subjects, regardless of movement direction or amplitude. Despite producing similar hypometric saccades, healthy control subjects overestimated target location, whereas SZPs relied more on the experienced visual error and consequently underestimated the target position. We show that in SZPs the postsaccadic judgment of the initial target location was largely aligned with the measure based only on visual error, suggesting a deficit in the use of CD. This CD deficit also correlated with positive schizophrenia symptoms and disturbances in sense of agency.
Conclusions: These results provide a novel approach in quantifying abnormal use of CD in SZPs and provide a framework to distinguish deficits in sensory processing versus defects in the internal CD-based monitoring of movement.
Keywords: Corollary discharge; Positive symptoms; Saccade; Schizophrenia; Sense of agency; Visual perception.
Copyright © 2017 Society of Biological Psychiatry. All rights reserved.
Figures
Comment in
-
Saccadic Eye Movement System and Agency Disorders: Yes, They Are Related!Biol Psychiatry Cogn Neurosci Neuroimaging. 2018 Feb;3(2):103-104. doi: 10.1016/j.bpsc.2017.12.005. Epub 2018 Feb 5. Biol Psychiatry Cogn Neurosci Neuroimaging. 2018. PMID: 29529403 No abstract available.
Similar articles
-
Failure to use corollary discharge to remap visual target locations is associated with psychotic symptom severity in schizophrenia.J Neurophysiol. 2015 Aug;114(2):1129-36. doi: 10.1152/jn.00155.2015. Epub 2015 Jun 24. J Neurophysiol. 2015. PMID: 26108951 Free PMC article.
-
The effect of saccade metrics on the corollary discharge contribution to perceived eye location.J Neurophysiol. 2015 May 1;113(9):3312-22. doi: 10.1152/jn.00771.2014. Epub 2015 Mar 11. J Neurophysiol. 2015. PMID: 25761955 Free PMC article.
-
Quantifying the spatial extent of the corollary discharge benefit to transsaccadic visual perception.J Neurophysiol. 2016 Mar;115(3):1132-45. doi: 10.1152/jn.00657.2015. Epub 2015 Dec 16. J Neurophysiol. 2016. PMID: 26683070 Free PMC article.
-
Disrupted Corollary Discharge in Schizophrenia: Evidence From the Oculomotor System.Biol Psychiatry Cogn Neurosci Neuroimaging. 2019 Sep;4(9):773-781. doi: 10.1016/j.bpsc.2019.03.009. Epub 2019 Apr 2. Biol Psychiatry Cogn Neurosci Neuroimaging. 2019. PMID: 31105039 Free PMC article. Review.
-
Eye movement characteristics in schizophrenia: A recent update with clinical implications.Neuropsychopharmacol Rep. 2020 Mar;40(1):2-9. doi: 10.1002/npr2.12087. Epub 2019 Nov 27. Neuropsychopharmacol Rep. 2020. PMID: 31774633 Free PMC article. Review.
Cited by
-
Oculomotor corollary discharge signaling is related to repetitive behavior in children with autism spectrum disorder.J Vis. 2021 Aug 2;21(8):9. doi: 10.1167/jov.21.8.9. J Vis. 2021. PMID: 34351395 Free PMC article.
-
Structural Thalamofrontal Hypoconnectivity Is Related to Oculomotor Corollary Discharge Dysfunction in Schizophrenia.J Neurosci. 2019 Mar 13;39(11):2102-2113. doi: 10.1523/JNEUROSCI.1473-18.2019. Epub 2019 Jan 10. J Neurosci. 2019. PMID: 30630882 Free PMC article.
-
Transsaccadic visual perception of foveal compared to peripheral environmental changes.J Vis. 2021 Jun 7;21(6):12. doi: 10.1167/jov.21.6.12. J Vis. 2021. PMID: 34160578 Free PMC article.
-
Prediction, Psychosis, and the Cerebellum.Biol Psychiatry Cogn Neurosci Neuroimaging. 2019 Sep;4(9):820-831. doi: 10.1016/j.bpsc.2019.06.001. Epub 2019 Jun 12. Biol Psychiatry Cogn Neurosci Neuroimaging. 2019. PMID: 31495402 Free PMC article. Review.
-
Reduced transfer of visuomotor adaptation is associated with aberrant sense of agency in schizophrenia.Neuroscience. 2019 Aug 10;413:108-122. doi: 10.1016/j.neuroscience.2019.06.012. Epub 2019 Jun 20. Neuroscience. 2019. PMID: 31228588 Free PMC article.
References
-
- Haggard P, Martin F, Taylor-Clarke M, Jeannerod M, Franck N. Awareness of action in schizophrenia. Neuroreport. 2003;14(7):1081–1085. - PubMed
-
- Keefe RSE, Arnold MC, Bayen UJ, McEvoy JP, Wilson WH. Source-monitoring deficits for self-generated stimuli in schizophrenia: Multinomial modeling of data from three sources. Schizophrenia Research. 2002;57:51–67. - PubMed
-
- Gallagher S. Neurocognitive models of schizophrenia: a neurophenomenological critique. Psychopathology. 2004;37(1):8–19. - PubMed
-
- Maeda T, Kato M, Muramatsu T, Iwashita S, Mimura M, Kashima H. Aberrant sense of agency in patients with schizophrenia: Forward and backward over-attribution of temporal causality during intentional action. Psychiatry research. 2012;198(1):1–6. - PubMed
-
- Maeda T, Takahata K, Muramatsu T, Okimura T, Koreki A, Iwashita S, Kato M. Reduced sense of agency in chronic schizophrenia with predominant negative symptoms. Psychiatry research. 2013;209(3):386–392. - PubMed
Publication types
MeSH terms
Grants and funding
LinkOut - more resources
Full Text Sources
Other Literature Sources
Medical
Molecular Biology Databases
