The Mark Coventry Award: Patellofemoral Arthroplasty Results in Better Range of Movement and Early Patient-reported Outcomes Than TKA
- PMID: 29529622
- PMCID: PMC5919242
- DOI: 10.1007/s11999.0000000000000017
The Mark Coventry Award: Patellofemoral Arthroplasty Results in Better Range of Movement and Early Patient-reported Outcomes Than TKA
Abstract
Background: Controversy exists over the surgical treatment for severe patellofemoral osteoarthritis. We therefore wished to compare the outcome of patellofemoral arthroplasty (PFA) with TKA in a blinded randomized controlled trial.
Questions/purposes: In the first 2 years after surgery: (1) Does the overall gain in quality of life differ between the implants based on the area under the curve of patient-reported outcomes (PROs) versus time? (2) Do patients obtain a better quality of life at specific points in time after PFA than after TKA? (3) Do patients get a better range of movement after PFA than after TKA? (4) Does PFA result in more complications than TKA?
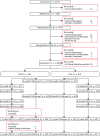
Methods: Patients were eligible if they had debilitating symptoms and isolated patellofemoral disease. One hundred patients were included from 2007 to 2014 and were randomized to PFA or TKA (blinded for the first year; blinded to patient, therapists, primary care physicians, etc; quasiblinded to assessor). Patients were seen for four clinical followups and completed six sets of questionnaires during the first 2 postoperative years. SF-36 bodily pain was the primary outcome. Other outcomes were range of movement, PROs (SF-36, Oxford Knee Score [OKS], Knee injury and Osteoarthritis Outcome Score [KOOS]) as well as complications and revisions. Four percent (two of 50) of patients died within the first 2 years in the PFA group (none in the TKA group), and 2% (one of 50) became ill and declined further participation after 1 year in the PFA group (none in the TKA group). The mean age at inclusion was 64 years (SD 8.9), and 77% (77 of 100) were women.
Results: The area under the curve (AUC) up to 2 years for SF-36 bodily pain of patients undergoing PFA and those undergoing TKA was 9.2 (SD 4.3) and 6.5 (SD 4.5) months, respectively (p = 0.008). The SF-36 physical functioning, KOOS symptoms, and OKS also showed a better AUC up to 2 years for PFA compared with TKA (6.6 [SD 4.8] versus 4.2 [SD 4.3] months, p = 0.028; 5.6 [SD 4.1] versus 2.8 [SD 4.5] months, p = 0.006; 7.5 [SD 2.7] versus 5.0 [SD 3.6] months, p = 0.001; respectively). The SF-36 bodily pain improvement at 6 months for patients undergoing PFA and those undergoing TKA was 38 (SD 24) and 27 (SD 23), respectively (p = 0.041), and at 2 years, the improvement was 39 (SD 24) and 33 (SD 22), respectively (p = 0.199). The KOOS symptoms improvement at 6 months for patients undergoing PFA and those undergoing TKA was 24 (SD 20) and 7 (SD 21), respectively (p < 0.001), and at 2 years, the improvement was 27 (SD 19) and 17 (SD 21), respectively (p = 0.023). Improvements from baseline for KOOS pain, SF-36 physical functioning, and OKS also differed in favor of PFA at 6 months, whereas only KOOS symptoms showed a difference between the groups at 2 years. No PRO dimension showed a difference in favor of TKA. At 4 months, 1 year, and 2 years, the ROM change from baseline for patients undergoing PFA and those undergoing TKA was (-7° [SD 13°] versus -18° [SD 14°], p < 0.001; -4° [SD 15°] versus -11° [SD 12°], p = 0.011; and -3° [SD 12°] versus -10° [SD 12°], p = 0.010). There was no difference in the number of complications. During the first 2 postoperative years, there were two revisions in patients undergoing PFA (one to a new PFA and one to a TKA).
Conclusions: Patients undergoing PFA obtain a better overall knee-specific quality of life than patients undergoing TKA throughout the first 2 years after operation for isolated patellofemoral osteoarthritis. At 2 years, only KOOS function differs between patients undergoing PFA and those undergoing TKA, whereas other PRO dimensions do not show a difference between groups. The observations can be explained by patients undergoing PFA recovering faster than patients undergoing TKA and the functional outcome being better for patients undergoing PFA up to 9 months. Patients undergoing PFA regain their preoperative ROM, whereas patients undergoing TKA at 2 years have lost 10° of ROM. We found no differences in complications.
Level of evidence: Level I, therapeutic study.
Conflict of interest statement
All ICMJE Conflict of Interest Forms for authors and
Figures


References
-
- Ackroyd CE. Development and early results of a new patellofemoral arthroplasty. Clin Orthop Relat Res. 2005;436:7–13. - PubMed
-
- Ackroyd CE, Newman JH, Evans R, Eldridge JD, Joslin CC. The Avon patellofemoral arthroplasty: five-year survivorship and functional results. J Bone Joint Surg Br. 2007;89:310–315. - PubMed
-
- Ahlbäck S, Rydberg J. [X-ray classification and examination technics in gonarthrosis] [in Swedish]. Lakartidningen. 1980;77:2091–2093. - PubMed
-
- Andersen KV, Nikolajsen L, Haraldsted V, Odgaard A, Søballe K. Local infiltration analgesia for total knee arthroplasty: should ketorolac be added? Br J Anaesth. 2013;111:242–248. - PubMed
-
- Angst F, Aeschlimann A, Stucki G. Smallest detectable and minimal clinically important differences of rehabilitation intervention with their implications for required sample sizes using WOMAC and SF-36 quality of life measurement instruments in patients with osteoarthritis of the lower extremities. Arthritis Rheum. 2001;45:384–391. - PubMed
Publication types
MeSH terms
LinkOut - more resources
Full Text Sources
Other Literature Sources
Medical
Research Materials
Miscellaneous

