. 2018 Mar 13;19(1):11.
doi: 10.1186/s12868-018-0416-1.

Dissecting the pathobiology of altered MRI signal in amyotrophic lateral sclerosis: A post mortem whole brain sampling strategy for the integration of ultra-high-field MRI and quantitative neuropathology

Affiliations

Dissecting the pathobiology of altered MRI signal in amyotrophic lateral sclerosis: A post mortem whole brain sampling strategy for the integration of ultra-high-field MRI and quantitative neuropathology

Menuka Pallebage-Gamarallage et al. BMC Neurosci. .

Abstract

Background: Amyotrophic lateral sclerosis (ALS) is a clinically and histopathologically heterogeneous neurodegenerative disorder, in which therapy is hindered by the rapid progression of disease and lack of biomarkers. Magnetic resonance imaging (MRI) has demonstrated its potential for detecting the pathological signature and tracking disease progression in ALS. However, the microstructural and molecular pathological substrate is poorly understood and generally defined histologically. One route to understanding and validating the pathophysiological correlates of MRI signal changes in ALS is to directly compare MRI to histology in post mortem human brains.

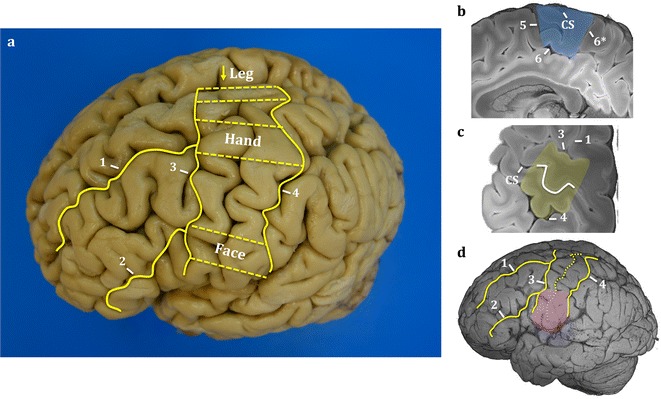
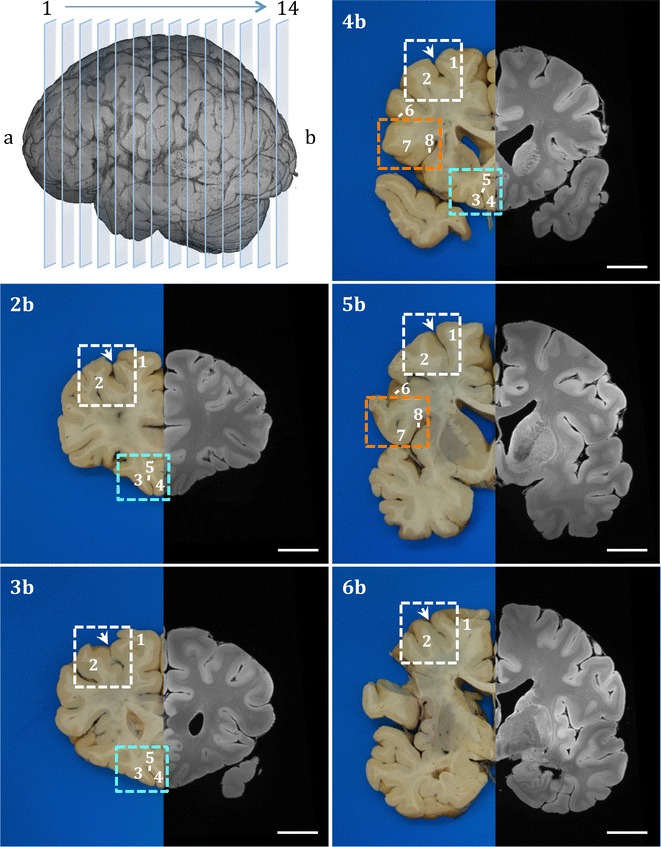
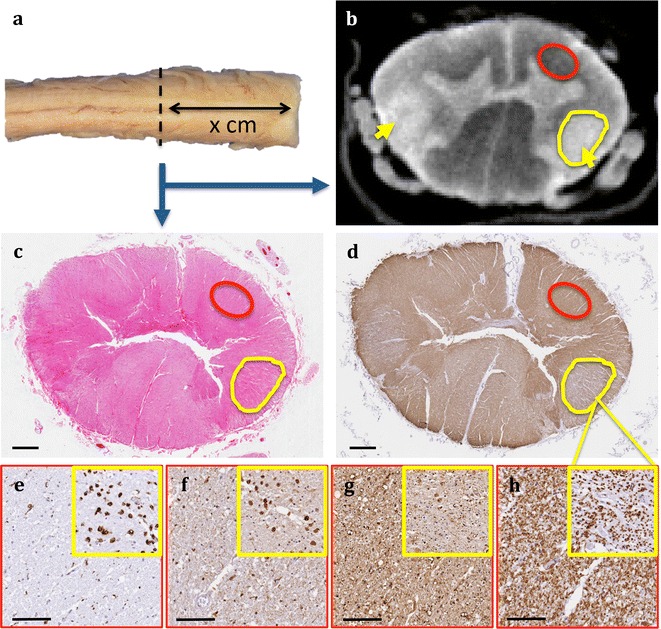
Results: The article delineates a universal whole brain sampling strategy of pathologically relevant grey matter (cortical and subcortical) and white matter tracts of interest suitable for histological evaluation and direct correlation with MRI. A standardised systematic sampling strategy that was compatible with co-registration of images across modalities was established for regions representing phosphorylated 43-kDa TAR DNA-binding protein (pTDP-43) patterns that were topographically recognisable with defined neuroanatomical landmarks. Moreover, tractography-guided sampling facilitated accurate delineation of white matter tracts of interest. A digital photography pipeline at various stages of sampling and histological processing was established to account for structural deformations that might impact alignment and registration of histological images to MRI volumes. Combined with quantitative digital histology image analysis, the proposed sampling strategy is suitable for routine implementation in a high-throughput manner for acquisition of large-scale histology datasets. Proof of concept was determined in the spinal cord of an ALS patient where multiple MRI modalities (T1, T2, FA and MD) demonstrated sensitivity to axonal degeneration and associated heightened inflammatory changes in the lateral corticospinal tract. Furthermore, qualitative comparison of R2* and susceptibility maps in the motor cortex of 2 ALS patients demonstrated varying degrees of hyperintense signal changes compared to a control. Upon histological evaluation of the same region, intensity of signal changes in both modalities appeared to correspond primarily to the degree of microglial activation.

Conclusion: The proposed post mortem whole brain sampling methodology enables the accurate intraindividual study of pathological propagation and comparison with quantitative MRI data, to more fully understand the relationship of imaging signal changes with underlying pathophysiology in ALS.

Keywords: Amyotrophic lateral sclerosis; Histology; MRI-histology correlation; Magnetic resonance imaging; Post mortem brain; Systematic sampling.


Figures

Fig. 1
Fig. 1
Block face photography and digital histology pipeline for MRI-histology co-registration. Brain digitally photographed at various stages of block face sampling including intact brain, coronal slices (a) and extracted regions of interest (b). These images are coupled with images of trimmed surface paraffin embedded blocks (d) and serial digital histology images (e) for mapping (dotted arrow) on MRI modalities (c). Solid arrows represent registrations. Annotations—1: superior frontal gyrus, 2: middle frontal gyrus, 3: medial orbital gyrus, 4: gyrus rectus, 5: olfactory sulcus, white arrow: superior frontal sulcus. Scale bar = 1 cm
Fig. 2
Fig. 2
Motor and somatosensory cortex leg, hand and face region sampling. Identification of motor and somatosensory cortical regions of interest by the sulci (solid yellow lines) on the dorsal and lateral surfaces (a). Dashed yellow lines (a) represents the leg, hand and face regions excised for analysis. Corresponding MR structural images of paracentral lobule (b), hand knob (c) and lateral face (d) areas are highlighted in blue, yellow and pink, respectively. The hand knob recognised by the inverted omega on the central sulcus of the MR structural image (c). Major sulci were used as anatomical landmarks for guided sampling. Annotations—1: superior frontal sulcus, 2: inferior frontal sulcus, 3: pre-central sulcus, 4: post-central sulcus, 5: paracentral sulcus, 6: cingulate sulcus, 6*: marginal segment of the cingulate sulcus, CS central sulcus, arrow: interhemispheric fissure where leg region sampled on the paracentral lobule
Fig. 3
Fig. 3
Systematic sampling strategy for the cortical regions of the frontal lobe. The 3-D MRI image on top left-hand corner represents slicing of the brain on coronal plane. Each slice numbered consecutively in rostral-caudal axis and labelled as anterior (a) or posterior (b) when digitally photographed. Images 2b6b show gross brain coronal slices (posterior plane) with mirrored structural MR image from the left hemisphere. Key neuroanatomical regions middle frontal gyrus (white rectangle), orbitofrontal cortex (orbital gyri and gyrus rectus: turquoise rectangle) and inferior frontal gyrus (orange rectangle) were sampled in serial coronal slices systematically with their accompanying subcortical white matter. Major sulci were used as landmarks for region and anatomical boundary identification. Annotations—1: superior frontal gyrus, 2: middle frontal gyrus, 3: medial orbital gyrus, 4: gyrus rectus, 5: olfactory sulcus, 6: inferior frontal sulcus, 7: inferior frontal gyrus, 8: circular insular sulcus, arrow: superior frontal sulcus. Scale bar = 2 cm
Fig. 4
Fig. 4
Tractography guided identification of the corticospinal tract. The slice (a) that best represents the corticospinal tract (purple) was identified with tractography (b mirrored MR image). Annotations—1: putamen, 2: external globus pallidus, 3: caudate, 4: body of fornix, 5: thalamus, 6: red nucleus, 7: hippocampus, *posterior limb of internal capsule. Scale bar = 1 cm
Fig. 5
Fig. 5
Sampling of the cerebellum. Cerebellum sampled on sagittal plane by bisecting through midline of the vermis (level 0) and at subsequent multiple levels (L1–L5) into the cerebellar hemisphere at a set thickness. Annotations—1: precentral fissure, 2: primary fissure, 3: prepyramidal fissure, 4: secondary fissure, 5: posteriolateral fissure, 6: nodulus, 7: tonsil, D dentate, blue line: anterior lobe, yellow line: posterior lobe
Fig. 6
Fig. 6
Quantitative digital histology image analysis. The high-resolution digital histology images represent the motor cortex subcortical white matter stained for PLP and grey matter stained for CD68, ferritin and pTDP-43 in ALS. Colour deconvolution for positive staining (brown) generates markup images demonstrating unstained pixels = white, negative stained pixels = blue, weak positive pixels = yellow, medium positive pixels = orange and strong positive pixels = red. Scale bar = 100 μm
Fig. 7
Fig. 7
Overview of MRI-histology co-registration approach. a Photograph of tissue block (block face). b Photograph of coronal brain slice after the excision of tissue blocks. c Photograph of intact coronal brain slice. d Same as a after removing the blue background. e Same as c after removing the blue background. f Photograph of intact brain slice with inserted block face. Block insertion is a rigid-body registration that uses normalised mutual information (NMI [58]) as a cost function. The histology image will, later on, be transformed to fit the region of interest defined by this block. g Histology image that is registered to the block face using non-linear, deformable registration (cost function: MIND [106]). h Slice of the MR volume that was re-sampled along a curvilinear surface to represent the anatomical features of e. i Tissue-type segmentation of e. The boundary between white matter and grey matter is registered to the same boundary in h using boundary-based registration (cost function: BBR [108]). j Final alignment of the histology to the resampled MR volume (only one slice is shown)
Fig. 8
Fig. 8
Processed MRI datasets from an individual brain. The coronal MR images display a structural map (a), T1-map (b), T2-map (c), T2*-map (d), FA map (e), principal diffusion direction weighted by the FA (f) and susceptibility map (g). The calibration bars for the T1-map (b), T2-map (c) and T2*-map (d) indicate the T1, T2 and T2* values (in ms), respectively. The calibration bar in the FA map (e) indicates the fractional anisotropy. The key at bottom right of f indicates colour orientation of the principal diffusion direction. The calibration bar in the susceptibility map (g) indicates the susceptibility in parts-per-million (ppm)
Fig. 9
Fig. 9
Example of histology-MRI comparison of the orbitofrontal cortex. Histology sections stained for PLP (b) and SMI-312 (c) were obtained from the block face (a) sampled from the orbitofrontal cortex. High staining intensity of myelin PLP and SMI-312 neurofilament was evident in the subcortical white matter with clear contrast between the cortical grey and white matter boundary. Corresponding plane from structural (d), FA (e) and MD (f) MR images showed changes in signal intensity that were comparable to histology. Annotations—1: medial orbital gyrus, 2: gyrus rectus, 3: olfactory sulcus. Scale bar = 5 mm
Fig. 10
Fig. 10
Histology and MRI quantitative maps. Colour deconvolution markup histology images stained for PLP (a) and SMI-312 (b) demonstrates negative stained pixels = blue, weak positive pixels = yellow, medium positive pixels = orange and strong positive pixels = red. The PLP markup image shows manual outline of the grey matter and the subcortical white matter (green line). Images on the right column demonstrate quantitative FA (c) and MD (d) maps from the corresponding MRI plane and their calibration bars with quantitative values. Scale bar = 5 mm
Fig. 11
Fig. 11
Qualitative MRI and histological evaluation of the lateral corticospinal tract degeneration in the spinal cord from an ALS patient. MRI and histology was assessed at the same plane (a). The structural MRI (b) shows lateral corticospinal tract hyperintensity (yellow arrow and circle) compared to normal appearing white matter region (red circle). Images c, d represent low magnification snapshots of the spinal cord stained with haematoxylin and eosin and PLP, respectively. Images in the bottom row demonstrate qualitative comparison between normal appearing white matter in red boxes and lateral corticospinal tract in yellow box inserts at ×20 objective magnification for CD68 (e), ferritin (f), SMI-312 (g) and PLP (h) stains. Quantitative MRI and histology analysis outputs for these regions are presented in Table 4. Scale bar for c, d = 1 mm. Scale bar for figures eh and corresponding inserts = 100 µm
Fig. 12
Fig. 12
Qualitative comparison of signal changes in R2* and susceptibility maps and histological evaluation in the primary motor cortex of an age matched control and 2 ALS patients. MRI and histology was assessed in the hand knob region of the primary motor cortex. Evaluations were made specifically in the grey matter at the posterior bank of the precentral gyrus. The first and second row show R2* (inverse of T2*) and susceptibility map in axial plane for a control and 2 ALS patients. Increase in cortical hyperintensity (yellow arrow) is evident in ALS 3 and ALS 4 in comparison to the control. Images in the subsequent rows demonstrate the relative burden of CD68, pTDP-43 and PLP. Quantitative histology analysis outputs are provided in Additional file 3. Annotations—M1: motor cortex, S1: sensory cortex, *Betz cells. Scale bar for CD68 and PLP images = 200 µm. Scale bar for pTDP-43 images = 100 µm
Fig. 13
Fig. 13
Predicted sensitivity of MRI modalities to microstructural properties of the neural tissue. Structural, diffusion, relaxography and susceptibility MRI (top row) modalities can be influenced by several aspects of tissue microstructure. The bottom row represents microstructural features and an example of their corresponding histological stain. Predicted relationships between MRI and histology are indicated by dashed lines. The black dashed lines indicate microstructural features that can strongly influence MR signal [, , –124]. The grey dashed lines represent other microstructural features that can potentially influence the MR signal (directly or indirectly) and/or to a lesser degree [98, 121]. It should also be noted that any MR measure might show correlation with other microstructural characteristics that are not highlighted in the image

Similar articles

Cited by

References

    1. Kiernan MC, Vucic S, Cheah BC, Turner MR, Eisen A, Hardiman O, et al. Amyotrophic lateral sclerosis. Lancet. 2011;377:942–955. doi: 10.1016/S0140-6736(10)61156-7. - DOI - PubMed
    1. Burrell JR, Halliday GM, Kril JJ, Ittner LM, Götz J, Kiernan MC, et al. The frontotemporal dementia-motor neuron disease continuum. Lancet. 2016;388:919–931. doi: 10.1016/S0140-6736(16)00737-6. - DOI - PubMed
    1. Turner MR, Talbot K. Mimics and chameleons in motor neurone disease. Pract Neurol. 2013;13:153–164. doi: 10.1136/practneurol-2013-000557. - DOI - PMC - PubMed
    1. Turner MR, Verstraete E. What does imaging reveal about the pathology of amyotrophic lateral sclerosis? Curr Neurol Neurosci Rep. 2015;15:569. - PMC - PubMed
    1. Menke RAL, Körner S, Filippini N, Douaud G, Knight S, Talbot K, et al. Widespread grey matter pathology dominates the longitudinal cerebral MRI and clinical landscape of amyotrophic lateral sclerosis. Brain. 2014;137:2546–2555. doi: 10.1093/brain/awu162. - DOI - PMC - PubMed

Publication types