. 2018 Apr;226(4):453-463.
doi: 10.1016/j.jamcollsurg.2017.12.045. Epub 2018 Mar 9.

Contemporary Burn Survival

Affiliations

Contemporary Burn Survival

Karel D Capek et al. J Am Coll Surg. 2018 Apr.

Abstract

Background: The standard of burn treatment today reflects major advances. We sought to quantitate the impact of these advances on burn survival via age-stratified mortality ratios compared with other reported mortality analyses in burns.

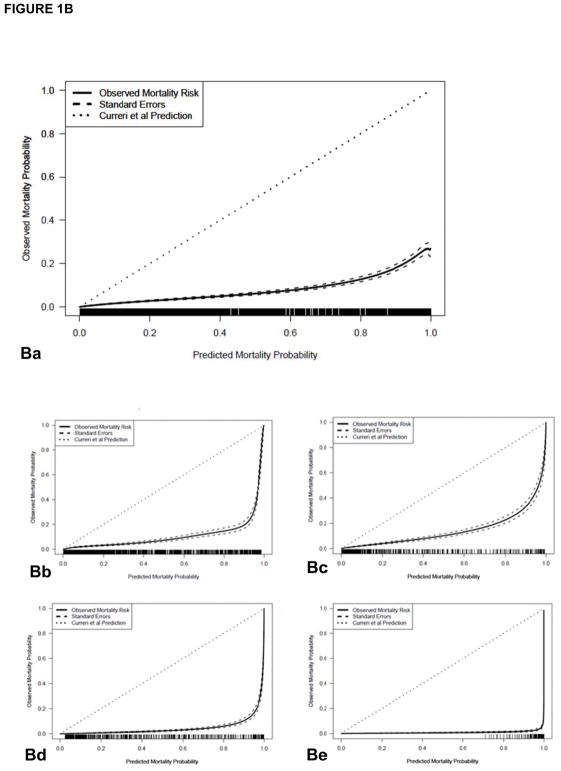
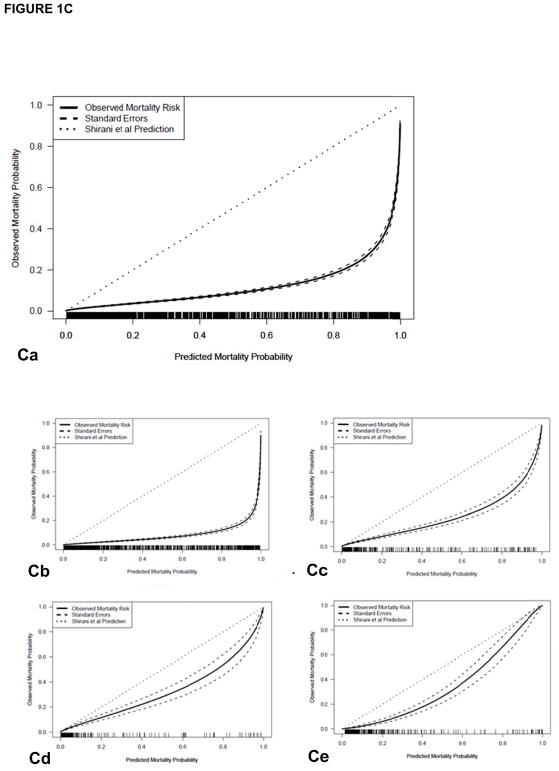
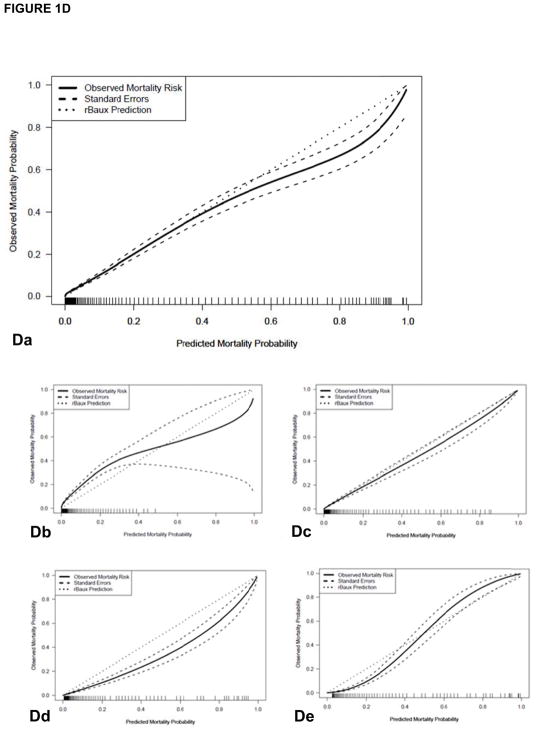
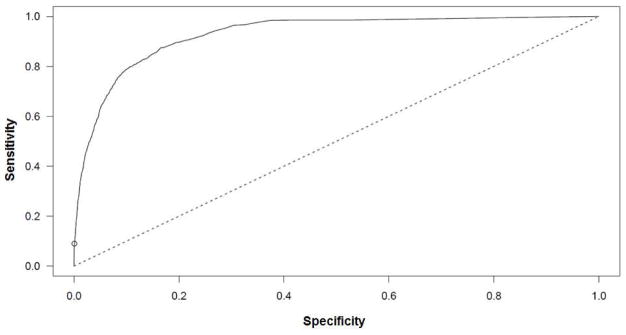
Study design: Age, percent of the total body surface area (TBSA) burned, presence of inhalation injury, length of stay, and survival status were recorded at admission and at discharge for all new burn admissions between 1989 and 2017. The expected mortality probability was calculated using historical multiple regression techniques and compared with observed data. We developed a prediction model for our observed data.

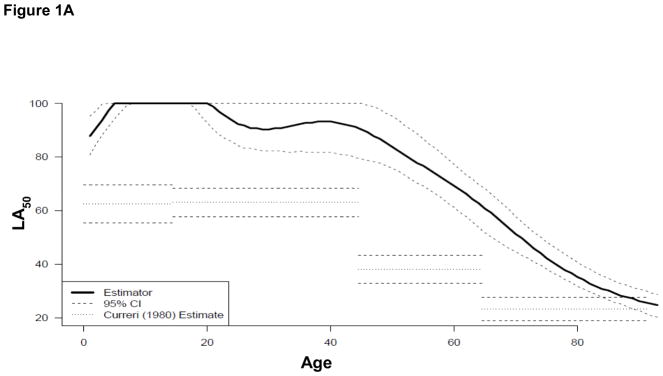
Results: Between 1989 and 2017, there were 10,384 consecutive new burn admissions, with 355 mortalities (median age, 13 years; median percent TBSA burn, 11%). We saw a significant decrease in our observed mortality data compared to historical predictions (p < 0.0001), and a 2% reduction per year in mortality during the 3 decades. The prediction model of mortality for the data is as follows: Pr(dying) = ex/(1 + ex) where x = -6.44 - 0.12 age + 0.0042 age2 - 0.0000283 age3 + 0.0499 TBSA + 1.21 Inhalation Injury + 0.015 third degree TBSA.

Conclusions: The reduction in mortality over time may be attributed to successful changes in standard of care protocols in the burn center that improved the outlook for burned individuals, including protocols for management of inhalation injury, nutrition, resuscitation, and early excision and grafting.


Figures

Figure 1
Figure 1
(A) The LA50 function of the nonlinear prediction model (solid line) with 95% confidence intervals (CI, dashed lines) compared to Curerri’s model (dotted lines). (B–D) shows a comparison of (B) Curreri, (C) Shirani, and (D) revised Baux prediction of probability of mortality (small dotted line at 45°) versus observed rate of mortality (solid line) along with standard errors, overall and divided by age groups. (Ba) The Curreri predicted and true survival rates overall and among different age groups: (Bb) 0 to 14 years, (Bc) 15 to 44 years, (Bd) 45 to 64 years, (Be) >65 years, from 1989 to 2017. Similar comparisons are illustrated with (Ca-e) Shirani and (Da-e) the revised Baux analysis. In both historical cases, the predicted fit falls below the line of agreement, indicating that these models predicted a greater number of mortalities than we observed in our dataset.
Figure 1
Figure 1
(A) The LA50 function of the nonlinear prediction model (solid line) with 95% confidence intervals (CI, dashed lines) compared to Curerri’s model (dotted lines). (B–D) shows a comparison of (B) Curreri, (C) Shirani, and (D) revised Baux prediction of probability of mortality (small dotted line at 45°) versus observed rate of mortality (solid line) along with standard errors, overall and divided by age groups. (Ba) The Curreri predicted and true survival rates overall and among different age groups: (Bb) 0 to 14 years, (Bc) 15 to 44 years, (Bd) 45 to 64 years, (Be) >65 years, from 1989 to 2017. Similar comparisons are illustrated with (Ca-e) Shirani and (Da-e) the revised Baux analysis. In both historical cases, the predicted fit falls below the line of agreement, indicating that these models predicted a greater number of mortalities than we observed in our dataset.
Figure 2
Figure 2
The ROC curve for a nonlinear prediction model for 10,384 burn patients. The area underneath the ROC curve was calculated as 0.93.

Comment in

  • Discussion.
    [No authors listed] [No authors listed] J Am Coll Surg. 2018 Apr;226(4):463-464. doi: 10.1016/j.jamcollsurg.2018.01.031. J Am Coll Surg. 2018. PMID: 29576147 No abstract available.

Similar articles

Cited by

References

    1. Tredget EE, Yu YM. The metabolic effects of thermal injury. World J Surg. 1992;16:68–79. - PubMed
    1. Porter C, Herndon DN, Sidossis LS, et al. The impact of severe burns on skeletal muscle mitochondrial function. Burns. 2013;39:1039–1047. - PMC - PubMed
    1. Simsek T, Simsek HU, Canturk NZ. Response to trauma and metabolic changes: Posttraumatic metabolism. Ulus Cerrahi Derg. 2014;30:153–159. - PMC - PubMed
    1. Hart DW, Wolf SE, Mlcak R, et al. Persistence of muscle catabolism after severe burn. Surgery. 2000;128:312–319. - PubMed
    1. Newsome TW, Mason AD, Jr, Pruitt BA., Jr Weight loss following thermal injury. Ann Surg. 1973;178:215–217. - PMC - PubMed

Publication types