

Development of an automated phenotyping algorithm for hepatorenal syndrome
- PMID: 29530803
- PMCID: PMC5920557
- DOI: 10.1016/j.jbi.2018.03.001
Development of an automated phenotyping algorithm for hepatorenal syndrome
Abstract
Objective: Hepatorenal Syndrome (HRS) is a devastating form of acute kidney injury (AKI) in advanced liver disease patients with high morbidity and mortality, but phenotyping algorithms have not yet been developed using large electronic health record (EHR) databases. We evaluated and compared multiple phenotyping methods to achieve an accurate algorithm for HRS identification.
Materials and methods: A national retrospective cohort of patients with cirrhosis and AKI admitted to 124 Veterans Affairs hospitals was assembled from electronic health record data collected from 2005 to 2013. AKI was defined by the Kidney Disease: Improving Global Outcomes criteria. Five hundred and four hospitalizations were selected for manual chart review and served as the gold standard. Electronic Health Record based predictors were identified using structured and free text clinical data, subjected through NLP from the clinical Text Analysis Knowledge Extraction System. We explored several dimension reduction techniques for the NLP data, including newer high-throughput phenotyping and word embedding methods, and ascertained their effectiveness in identifying the phenotype without structured predictor variables. With the combined structured and NLP variables, we analyzed five phenotyping algorithms: penalized logistic regression, naïve Bayes, support vector machines, random forest, and gradient boosting. Calibration and discrimination metrics were calculated using 100 bootstrap iterations. In the final model, we report odds ratios and 95% confidence intervals.
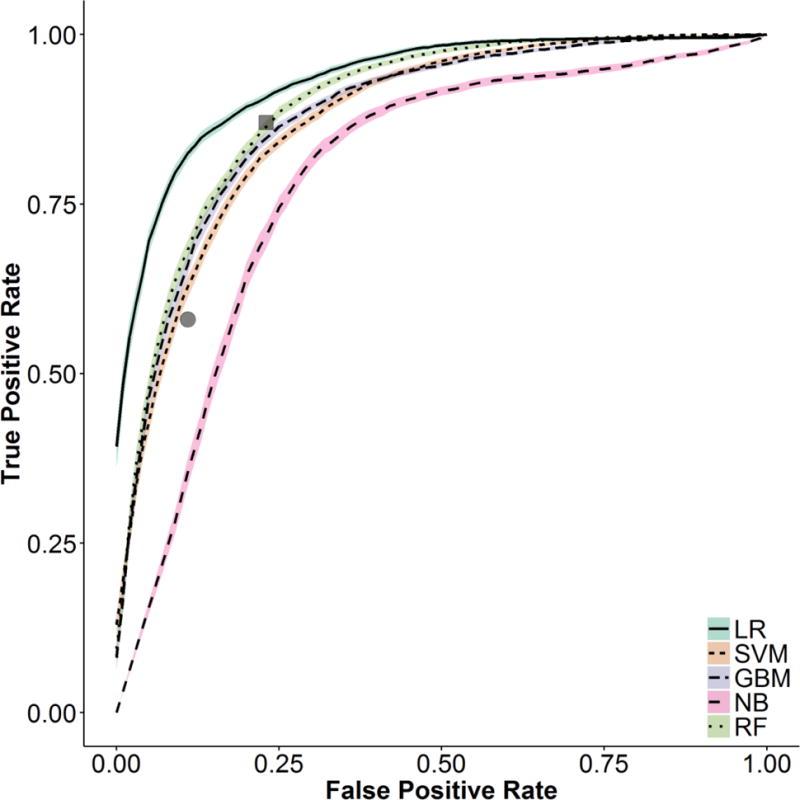
Results: The area under the receiver operating characteristic curve (AUC) for the different models ranged from 0.73 to 0.93; with penalized logistic regression having the best discriminatory performance. Calibration for logistic regression was modest, but gradient boosting and support vector machines were superior. NLP identified 6985 variables; a priori variable selection performed similarly to dimensionality reduction using high-throughput phenotyping and semantic similarity informed clustering (AUC of 0.81 - 0.82).
Conclusion: This study demonstrated improved phenotyping of a challenging AKI etiology, HRS, over ICD-9 coding. We also compared performance among multiple approaches to EHR-derived phenotyping, and found similar results between methods. Lastly, we showed that automated NLP dimension reduction is viable for acute illness.
Keywords: Acute kidney injury; Cirrhosis; Dimension reduction; Hepatorenal syndrome; Natural language processing; Phenotyping.
Copyright © 2018 Elsevier Inc. All rights reserved.
Figures


References
Publication types
MeSH terms
Grants and funding
LinkOut - more resources
Full Text Sources
Other Literature Sources
