. 2018 May 15;38(11):e00529-17.
doi: 10.1128/MCB.00529-17. Print 2018 Jun 1.

Endosomal-Lysosomal Cholesterol Sequestration by U18666A Differentially Regulates Amyloid Precursor Protein (APP) Metabolism in Normal and APP-Overexpressing Cells

Affiliations

Endosomal-Lysosomal Cholesterol Sequestration by U18666A Differentially Regulates Amyloid Precursor Protein (APP) Metabolism in Normal and APP-Overexpressing Cells

J Chung et al. Mol Cell Biol. .

Abstract

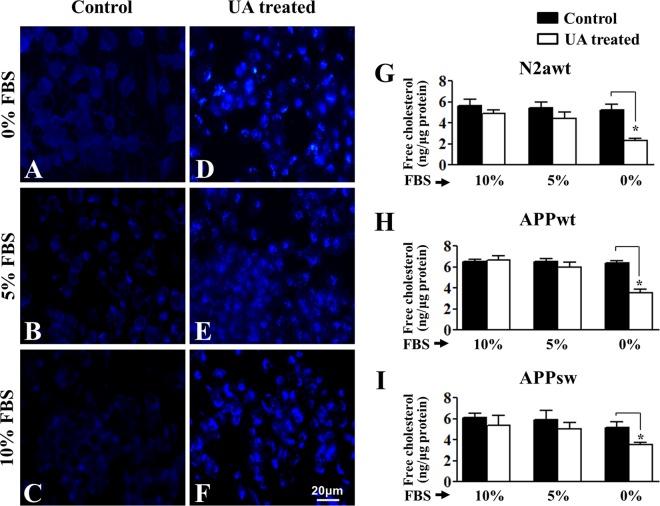
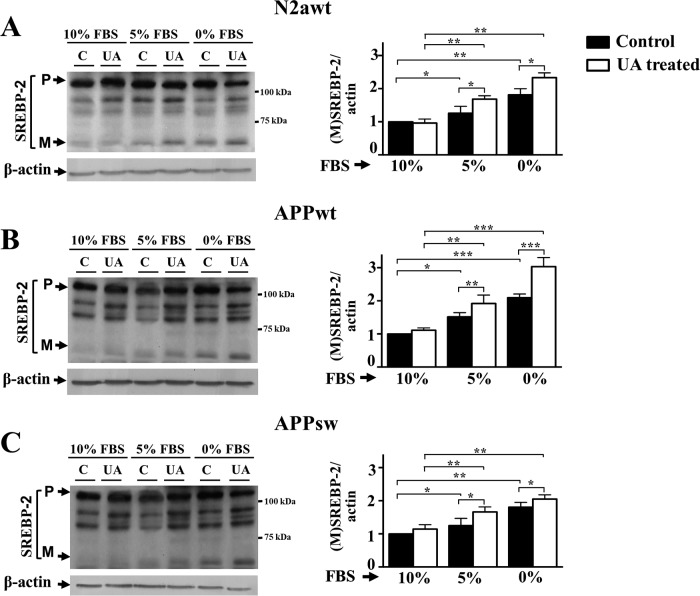
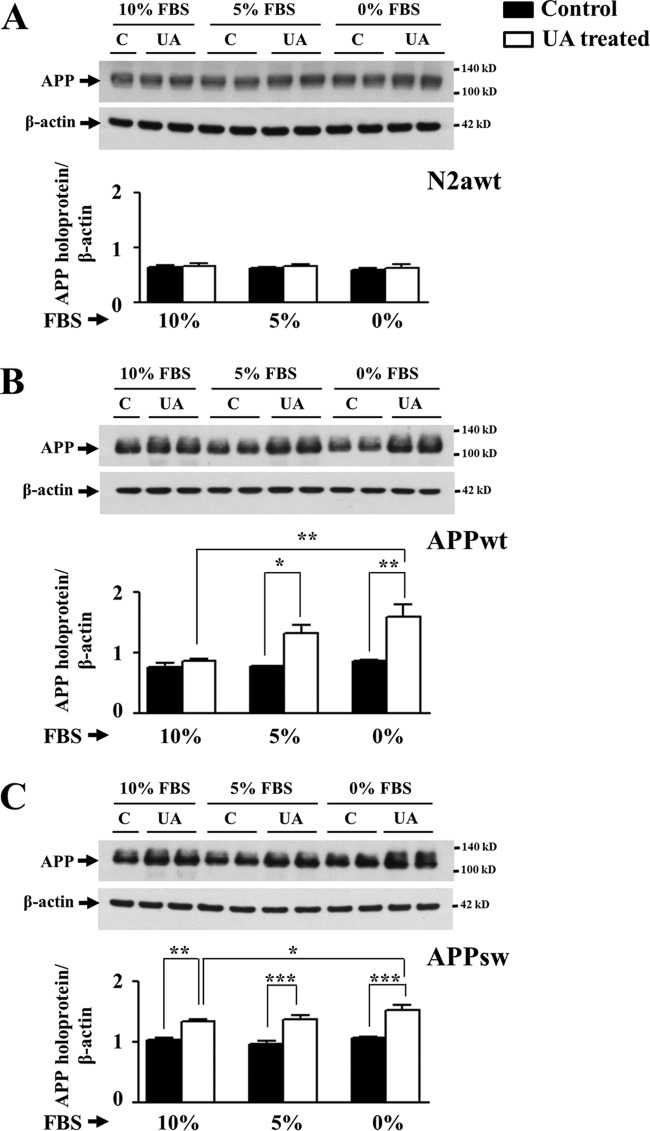
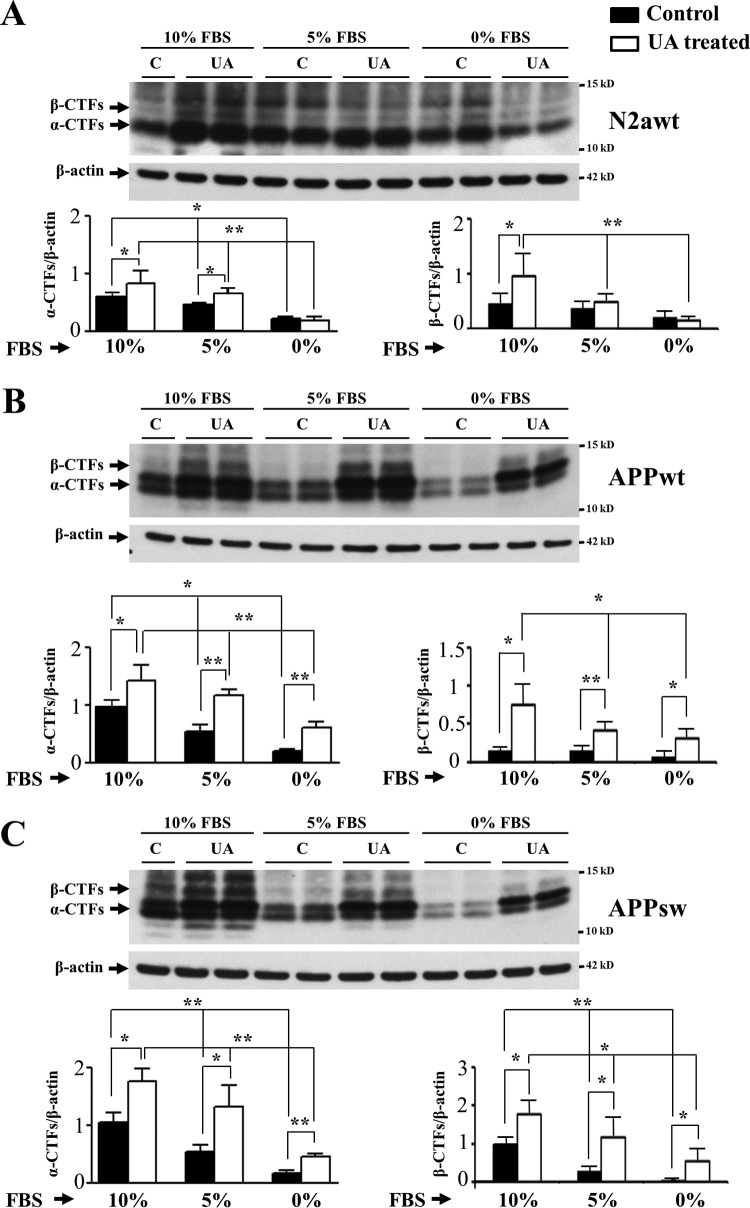
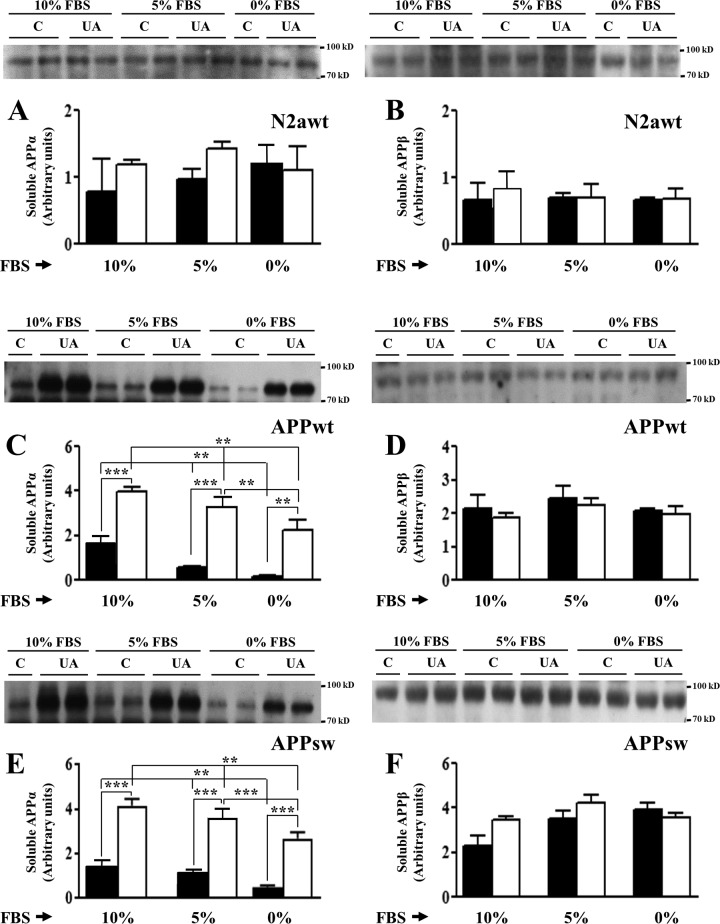
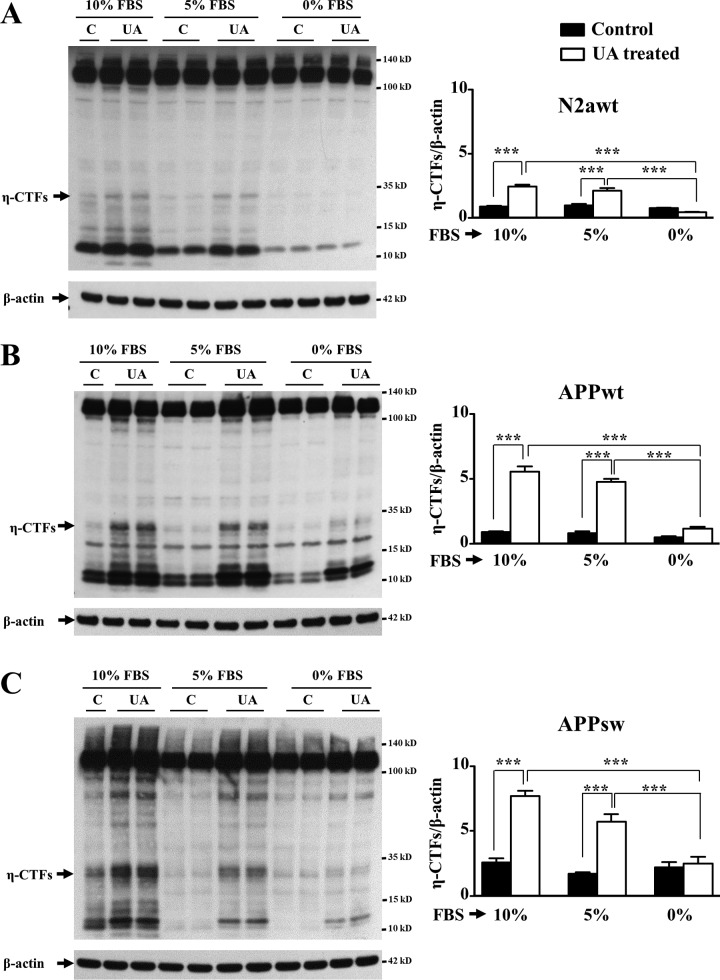
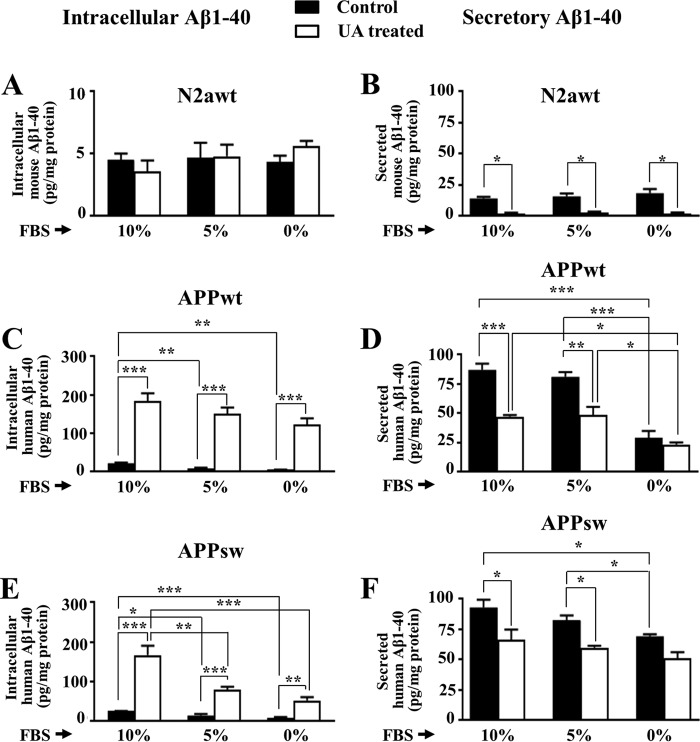
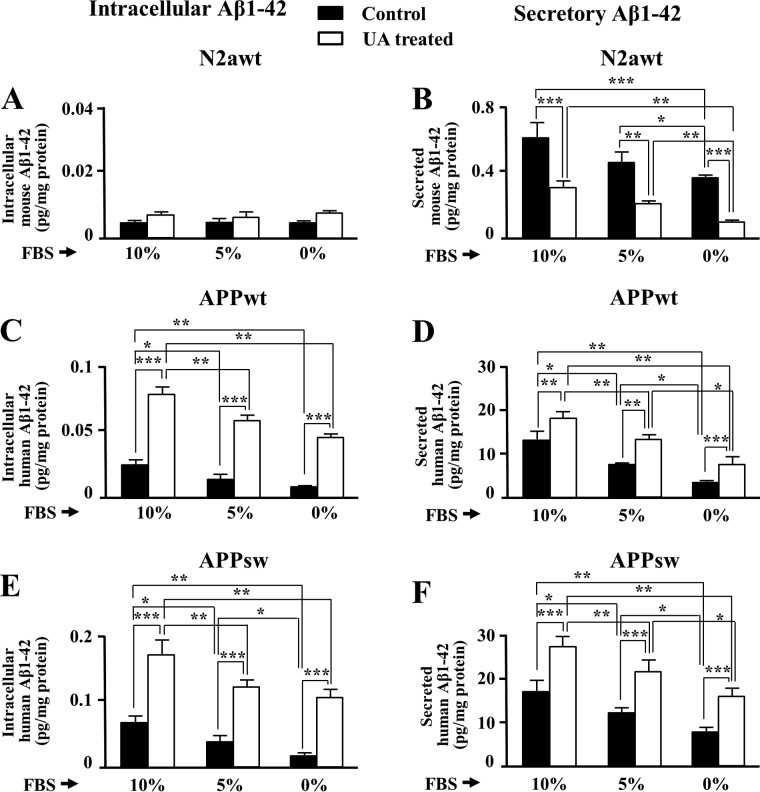
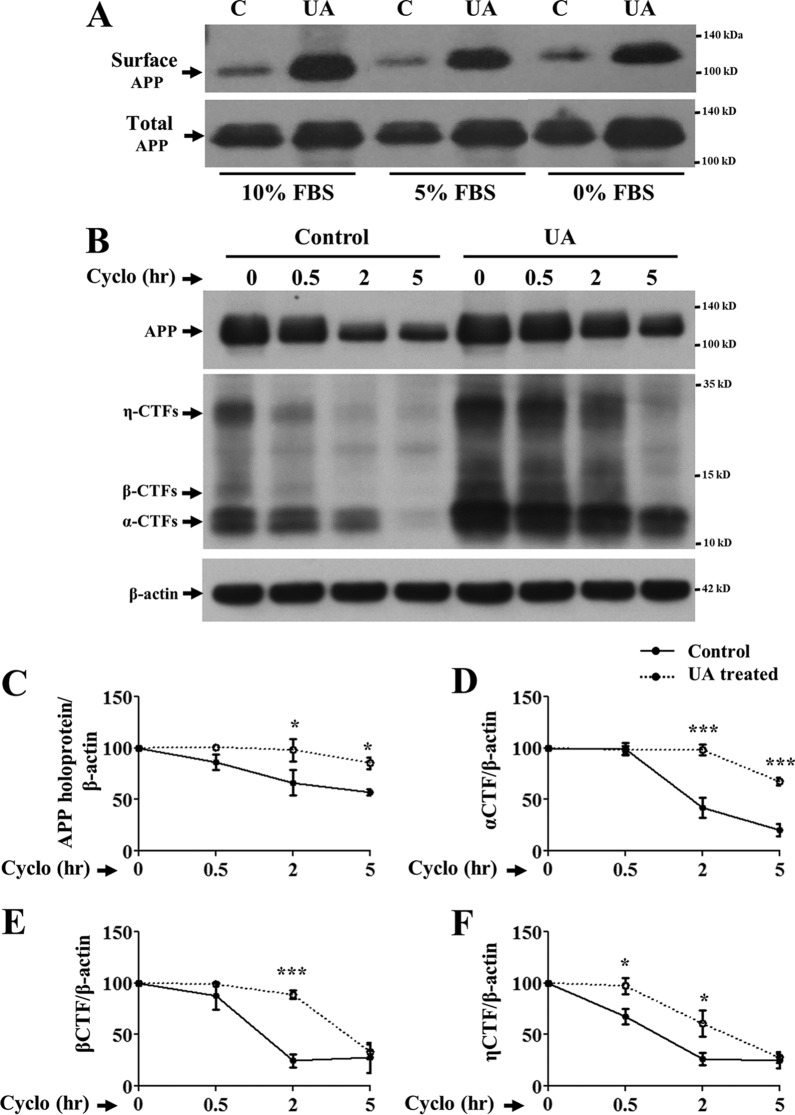
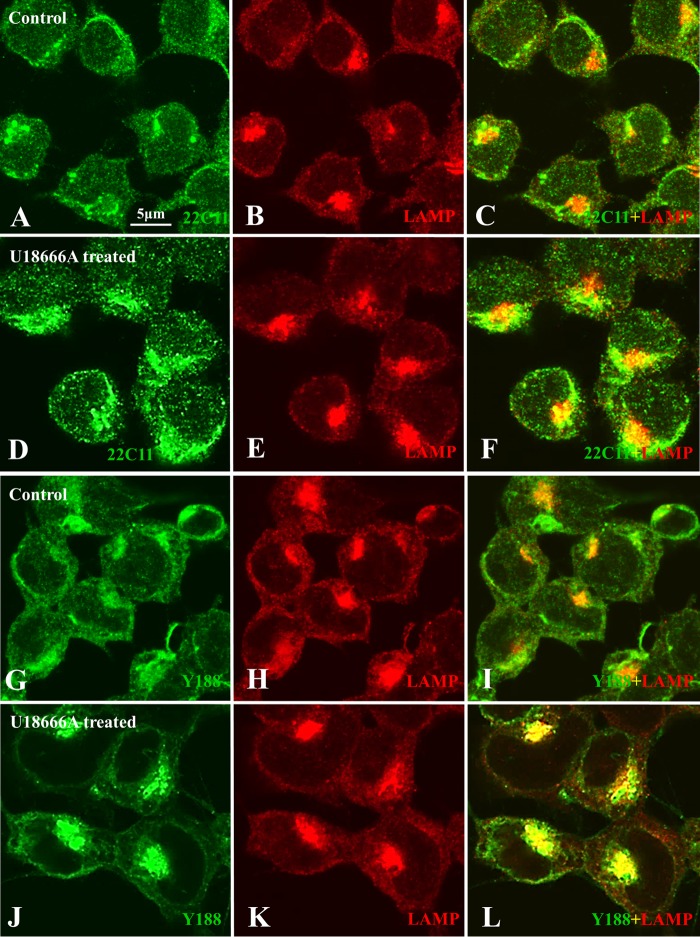
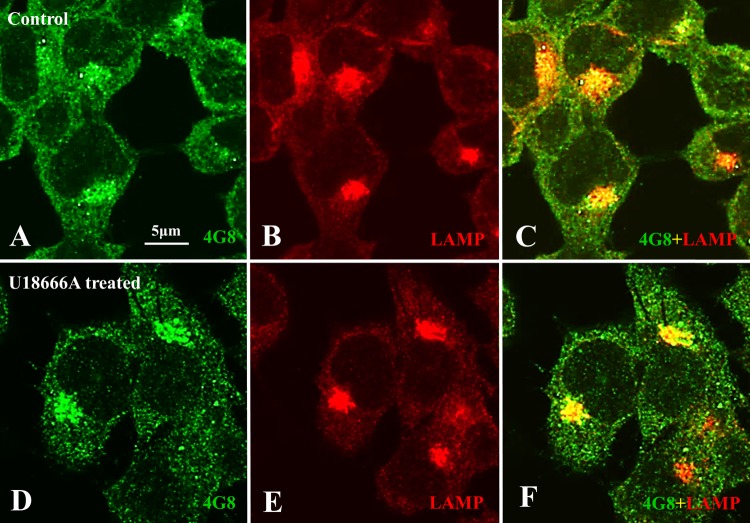
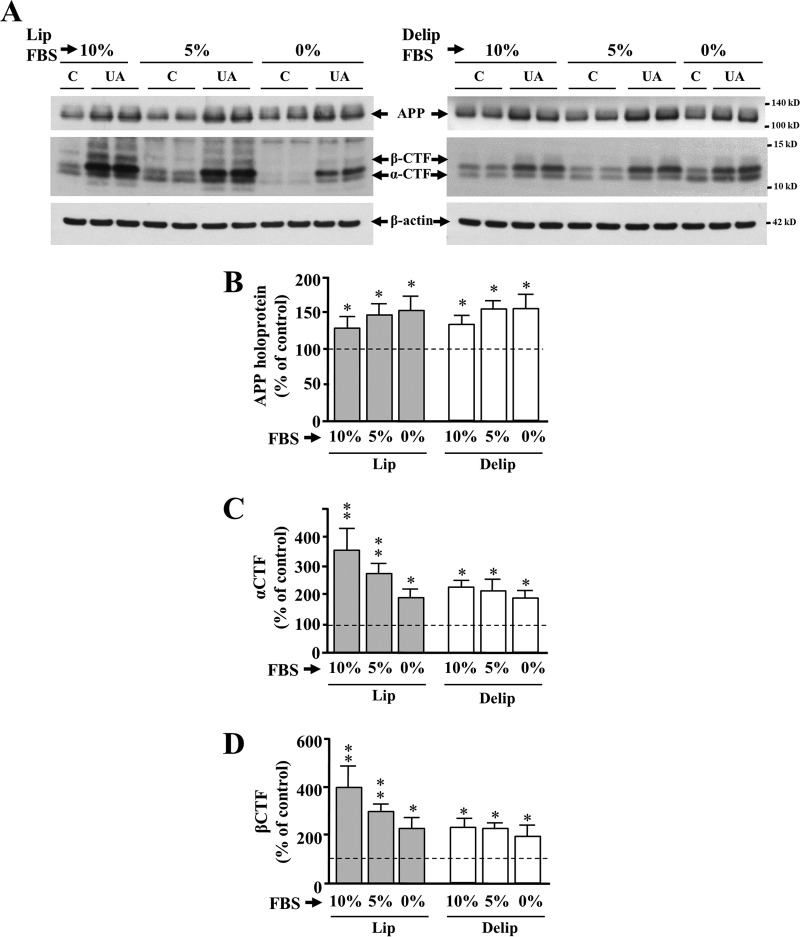
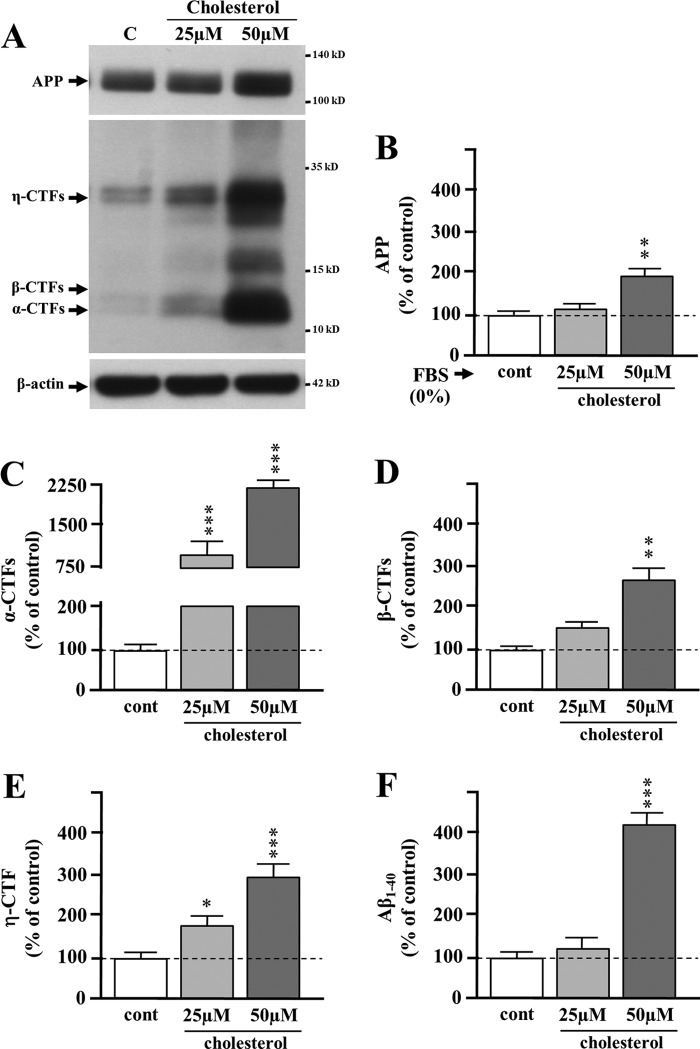
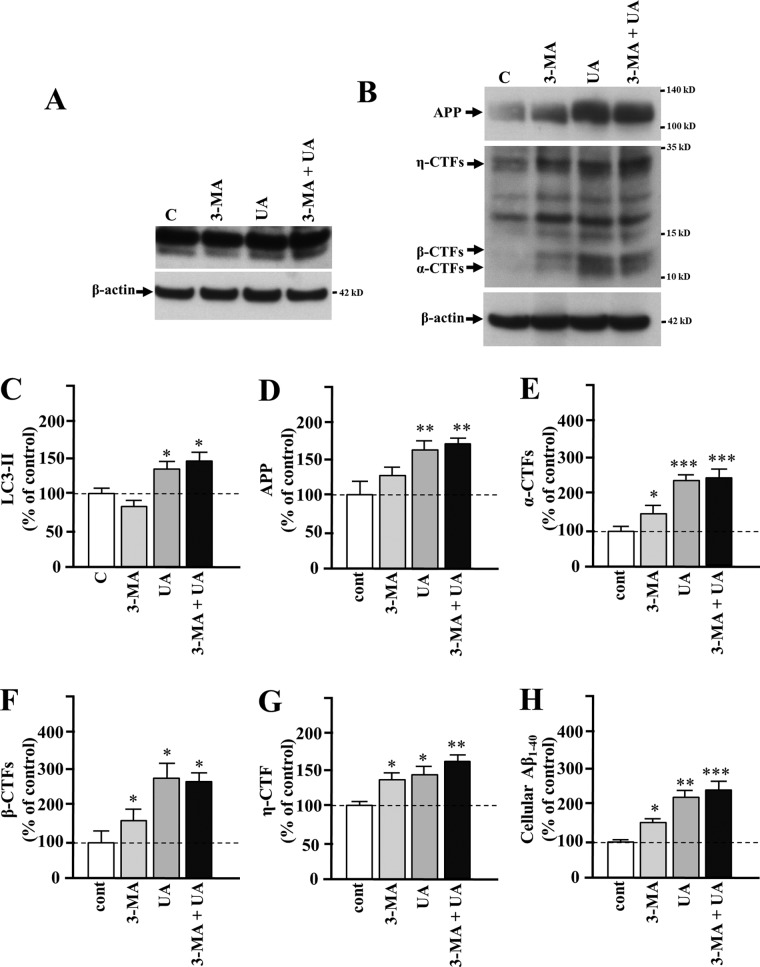
Amyloid β (Aβ) peptide, derived from amyloid precursor protein (APP), plays a critical role in the development of Alzheimer's disease. Current evidence indicates that altered levels or subcellular distribution of cholesterol can regulate Aβ production and clearance, but it remains unclear how cholesterol sequestration within the endosomal-lysosomal (EL) system can influence APP metabolism. Thus, we evaluated the effects of U18666A, which triggers cholesterol redistribution within the EL system, on mouse N2a cells expressing different levels of APP in the presence or absence of extracellular cholesterol and lipids provided by fetal bovine serum (FBS). Our results reveal that U18666A and FBS differentially increase the levels of APP and its cleaved products, the α-, β-, and η-C-terminal fragments, in N2a cells expressing normal levels of mouse APP (N2awt), higher levels of human wild-type APP (APPwt), or "Swedish" mutant APP (APPsw). The cellular levels of Aβ1-40/Aβ1-42 were markedly increased in U18666A-treated APPwt and APPsw cells. Our studies further demonstrate that APP and its cleaved products are partly accumulated in the lysosomes, possibly due to decreased clearance. Finally, we show that autophagy inhibition plays a role in mediating U18666A effects. Collectively, these results suggest that altered levels and distribution of cholesterol and lipids can differentially regulate APP metabolism depending on the nature of APP expression.

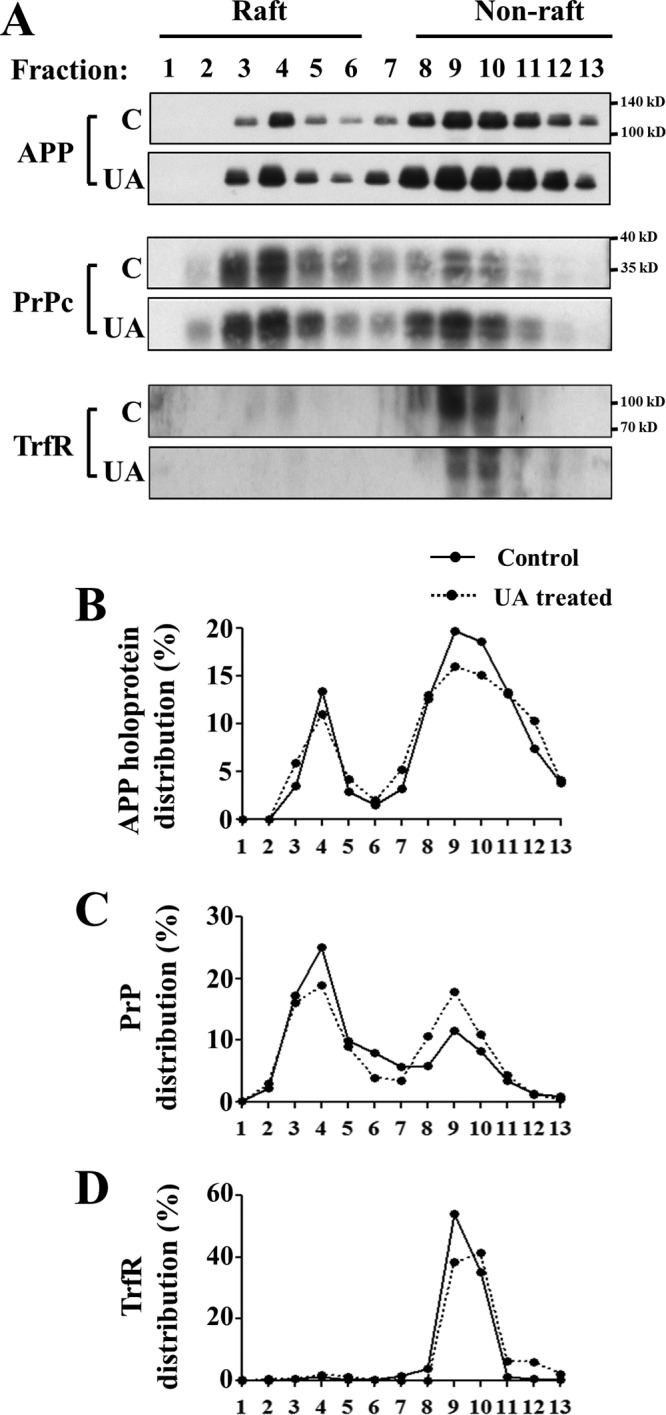
Keywords: Alzheimer's disease; amyloid precursor protein; delipidation; endosomal-lysosomal system; lipid raft; β-amyloid; β-secretase; γ-secretase.


Figures

FIG 1
FIG 1
(A to F) Photomicrographs showing cholesterol accumulation in APPsw cells with or without U18666A treatment in the presence of 0% (A and D), 5% (B and E), or 10% (C and F) FBS. (G to I) Histograms depicting the levels of free cholesterol in N2awt (G), APPwt (H), and APPsw (I) cells with or without U18666A treatment in the presence of increasing FBS concentrations. Data, which represent means ± SEM from 3 or 4 experiments, were analyzed by two-way ANOVA followed by Bonferroni's post hoc analysis. UA, U18666A. *, P < 0.05.
FIG 2
FIG 2
Immunoblots and corresponding histograms showing SREBP2 levels in N2awt (A), APPwt (B), and APPsw (C) cells with or without U18666A treatment in the presence of increasing FBS concentrations. Note the differential decrease in (M)SREBP-2 levels as a function of FBS concentration and following U18666A treatment. Data, which represent means ± SEM from 3 or 4 experiments, were analyzed by two-way ANOVA followed by Bonferroni's post hoc analysis. C, control; UA, U18666A. *, P < 0.05; **, P < 0.01, ***, P < 0.001.
FIG 3
FIG 3
Immunoblots and corresponding histograms showing APP levels in N2awt (A), APPwt (B), and APPsw (C) cells with or without U18666A treatment in the presence of increasing FBS concentrations. Note that U18666A treatment enhanced the levels of APP in APPwt and APPsw cells but not in N2awt cells. Data, which represent means ± SEM from 3 or 4 experiments, were analyzed by two-way ANOVA followed by Bonferroni's post hoc analysis. C, control; UA, U18666A. *, P < 0.05; **, P < 0.01, ***, P < 0.001.
FIG 4
FIG 4
Immunoblots and corresponding histograms showing the levels of α-CTF and β-CTF in N2awt (A), APPwt (B), and APPsw (C) cells with or without U18666A treatment in the presence of increasing FBS concentrations. Note the differential increase in α-CTF and β-CTF levels following U18666A treatment and with increasing concentrations of FBS. Data, which represent means ± SEM from 3 or 4 experiments, were analyzed by two-way ANOVA followed by Bonferroni's post hoc analysis. C, control; UA, U18666A. *, P < 0.05; **, P < 0.01, ***, P < 0.001.
FIG 5
FIG 5
Immunoblots and corresponding histograms showing the levels of sAPPα and sAPPβ in N2awt (A and B), APPwt (C and D), and APPsw (E and F) cells with or without U18666A treatment in the presence of increasing FBS concentrations. Note the increase in sAPPα levels in APPwt and APPsw cells following U18666A treatment, whereas levels of sAPPβ were not altered in any of the three cell lines. Data, which represent means ± SEM from 3 or 4 experiments, were analyzed by two-way ANOVA followed by Bonferroni's post hoc analysis. C, control; UA, U18666A. **, P < 0.01; ***, P < 0.001.
FIG 6
FIG 6
Immunoblots and corresponding histograms showing the levels of η-CTFs in N2awt (A), APPwt (B), and APPsw (C) cells with or without U18666A treatment in the presence of increasing FBS concentrations. Note the increase in η-CTFs levels following U18666A treatment in the three cell lines. Data, which represent means ± SEM from 3 or 4 experiments, were analyzed by two-way ANOVA followed by Bonferroni's post hoc analysis. C, control; UA, U18666A. **, P < 0.01; ***, P < 0.001.
FIG 7
FIG 7
Histograms showing the cellular (A, C, and E) and secretory (B, D, and F) levels of Aβ1–40 as detected by ELISA in N2awt (A and B), APPwt (C and D), and APPsw (E and F) cells with or without U18666A treatment in the presence of increasing FBS concentrations. Note the increase in intracellular levels of Aβ1–40 in APPwt and APPsw cells but not in N2awt cells, whereas the secretory levels of Aβ1–40 are decreased in all three cell lines following U18666A treatment. Data, which represent means ± SEM from 3 or 4 experiments, were analyzed by two-way ANOVA followed by Bonferroni's post hoc analysis. C, control; UA, U18666A. *, P < 0.05; **, P < 0.01, ***, P < 0.001.
FIG 8
FIG 8
Histograms showing the cellular (A, C, and E) and secretory (B, D, and F) levels of Aβ1–42 as detected by ELISA in N2awt (A and B), APPwt (C and D), and APPsw (E and F) cells with or without U18666A treatment in the presence of increasing FBS concentrations. Note the increase in intracellular levels of Aβ1–42 in APPwt and APPsw cells but not in N2awt cells. The secretory levels of Aβ1–42 are decreased in N2awt cells but increased in APPwt and APPsw cells following U18666A treatment. Data, which represent means ± SEM from 3 or 4 experiments, were analyzed by two-way ANOVA followed by Bonferroni's post hoc analysis. C, control; UA, U18666A. *, P < 0.05; **, P < 0.01, ***, P < 0.001.
FIG 9
FIG 9
(A) Immunoblot showing enhanced levels of surface APP in U18666A-treated APPsw cells compared to controls in the presence of increasing FBS concentrations. (B to F) Immunoblots and histograms showing the levels of APP (B and C), α-CTF (B and D), β-CTF (B and E), and η-CTF (B and F) in APPsw cells with or without U18666A treatment in the presence of cycloheximide for different periods of time. Note the relative decrease in the turnover rates of APP holoprotein (C), α-CTF (D), β-CTF (E), and η-CTF (F) following U18666A treatment. Data, which represent means ± SEM from 3 or 4 experiments, were analyzed by two-way ANOVA followed by Bonferroni's post hoc analysis. *, P < 0.05; **, P < 0.01.
FIG 10
FIG 10
(A to F) Representative confocal images showing the distribution of immunoreactive APP (A and D) and LAMP1 (B and E) and their colocalization (C and F) in control (A to C) and U18666A-treated (D to F) APPsw cells. (G to L) Representative confocal images showing the distribution of immunoreactive APP CTFs (G and J) and LAMP1 (H and K) and their colocalization (I and L) in control (G to I) and U18666A-treated (J to L) APPsw cells. Note the increased levels of localization of APP and CTFs in LAMP1-positive lysosomes in U18666A-treated cells. The identities of primary antibodies are indicated by the font colors.
FIG 11
FIG 11
Representative confocal images showing the distribution of immunoreactive Aβ (A and D) and LAMP1 (B and E) and their colocalization (C and F) in control (A to C) and U18666A-treated (D to F) APPsw cells. Note the increased levels of localization of Aβ in LAMP1-positive lysosomes in U18666A-treated cells. The identities of primary antibodies are indicated by the font colors.
FIG 12
FIG 12
Immunoblots and quantification showing the profile of APP on lipid raft and nonraft membrane domains of APPsw cells with or without U18666A treatment in 5% FBS. Prion protein (PrP) was used as the lipid raft marker, whereas transferrin receptor (TfR) was used as a nonraft marker. Note that the amount of APP is relatively higher in U18666A-treated cells than in control cells, but its distribution profile did not differ between raft and nonraft fractions following U18666A treatment. Data, which represent means ± SEM from 3 or 4 experiments, were analyzed by two-way ANOVA followed by Fisher's post hoc analysis.
FIG 13
FIG 13
(A) Immunoblots showing the levels of APP and α/β-CTF in APPsw cells with or without U18666A treatment in the presence of increasing concentrations of normal (Lip) (left panel) or delipidated (Delip) (right panel) FBS. (B to D) Histograms showing the levels of APP (B), α-CTF (C), and β-CTF (D) in APPsw cells following treatment with U18666A in the presence of increasing concentrations of normal or delipidated FBS. The data are presented as percentages of respective control cell values. Note the unaltered levels of APP between delipidated and normal FBS following U18666A treatment. The enhanced levels of α/β-CTFs observed with increasing concentrations of FBS following U18666A treatment are not evident under delipidated conditions. Data, which represent means ± SEM from 3 or 4 experiments, were analyzed by two-way ANOVA followed by Fisher's post hoc analysis. C, control; UA, U18666A. *, P < 0.05; **, P < 0.01.
FIG 14
FIG 14
(A) Representative immunoblots depicting amounts of APP and APP CTFs in APPsw cells cultured in the presence or absence of 25 μM or 50 μM cholesterol. (B to E) Histograms showing quantitation of APP (B), α-CTF (C), β-CTF (D), and η-CTF (E) in APPsw cells. (F) Intracellular levels of Aβ1–40 as detected by ELISA in APPsw cells in the presence or absence of 25 μM or 50 μM cholesterol. Data, which represent means ± SEM from 3 experiments, were analyzed by ANOVA followed by Fisher's post hoc analysis. *, P < 0.05; **, P < 0.01, ***, P < 0.001.
FIG 15
FIG 15
(A and B) Representative immunoblots depicting altered levels of LC3-II (A) and APP and APP CTFs (B) in APPsw cells treated with U18666A in the presence or absence of 3-MA. (C to G) Histograms showing quantitation of LC3-II (C), APP (D), α-CTF (E), β-CTF (F), and η-CTF (G) in APPsw cells treated with U18666A in the presence or absence of 3-MA. (H) Intracellular levels of Aβ1–40 as detected by ELISA in APPsw cells treated with U18666A in the presence or absence of 3-MA. Data, which represent means ± SEM from 3 experiments, were analyzed by ANOVA followed by Fisher's post hoc analysis. *, P < 0.05; **, P < 0.01, ***, P < 0.001.

Similar articles

Cited by

References

    1. Selkoe DJ. 2011. Alzheimer's disease. Cold Spring Harb Perspect Biol 3:a004457. doi:10.1101/cshperspect.a004457. - DOI - PMC - PubMed
    1. Hardy J, Bogdanovic N, Winblad B, Portelius E, Andreasen N, Cedazo-Minguez A, Zetterberg H. 2014. Pathways to Alzheimer's disease. J Int Med 275:296–303. doi:10.1111/joim.12192. - DOI - PubMed
    1. Haass C., Kaether C., Thinakaran G., Sisodia S. 2012. Trafficking and proteolytic processing of APP. Cold Spring Harb Perspect. Med 2:a006270. doi:10.1101/cshperspect.a006270. - DOI - PMC - PubMed
    1. Thinakaran G, Koo EH. 2008. Amyloid precursor protein trafficking, processing, and function. J Biol Chem 283:29615–29619. doi:10.1074/jbc.R800019200. - DOI - PMC - PubMed
    1. Salminen A, Kaarniranta K, Kauppinen A, Ojala J, Haapasalo A, Soininen H, Hiltunen M. 2013. Impaired autophagy and APP processing in Alzheimer's disease: the potential role of Beclin 1 interactome. Prog Neurobiol 106-107:33–54. - PubMed

Publication types

MeSH terms

Substances

LinkOut - more resources