. 2018 May 18;293(20):7894-7904.
doi: 10.1074/jbc.RA117.000508. Epub 2018 Mar 12.

Regulation of hepatic gluconeogenesis by nuclear factor Y transcription factor in mice

Affiliations

Regulation of hepatic gluconeogenesis by nuclear factor Y transcription factor in mice

Yanjie Zhang et al. J Biol Chem. .

Abstract

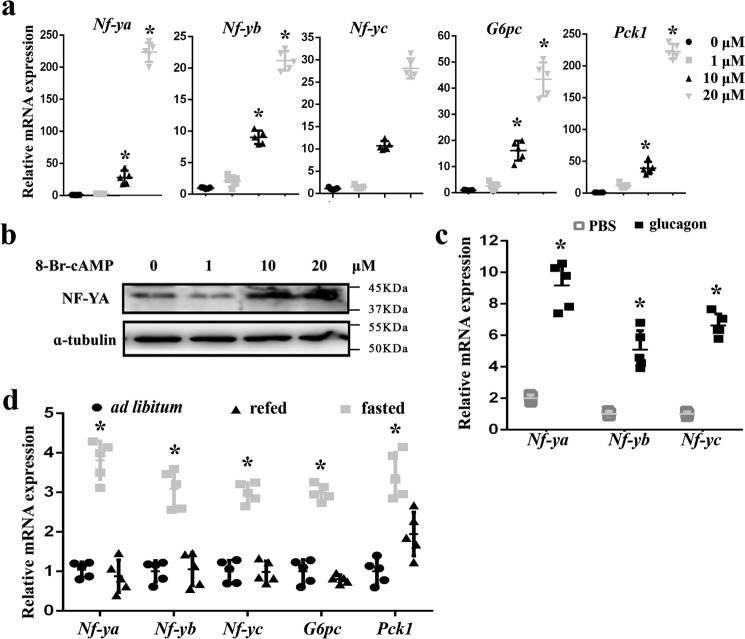
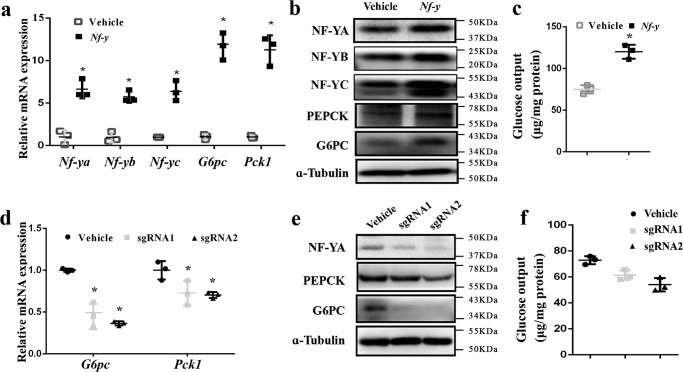
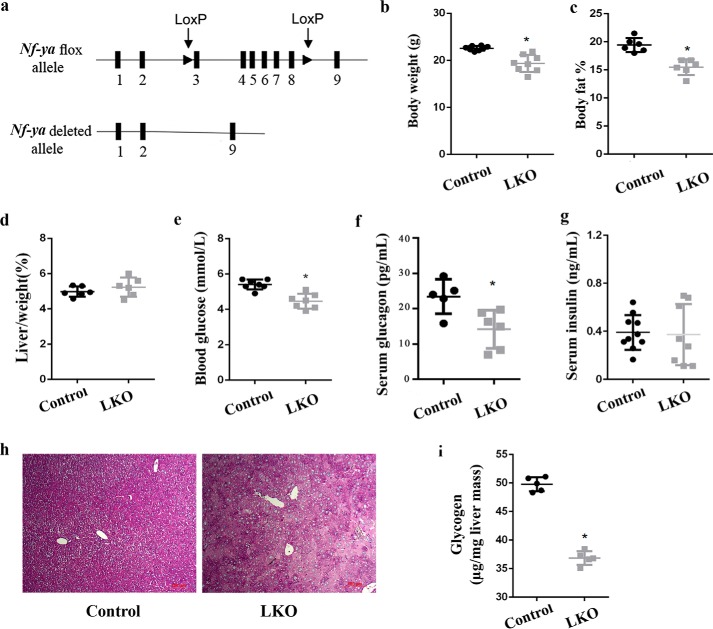
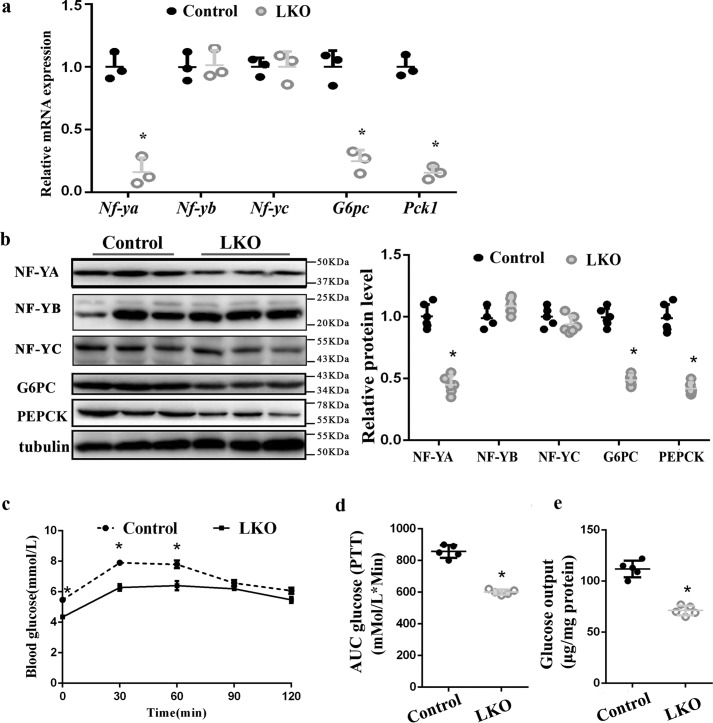
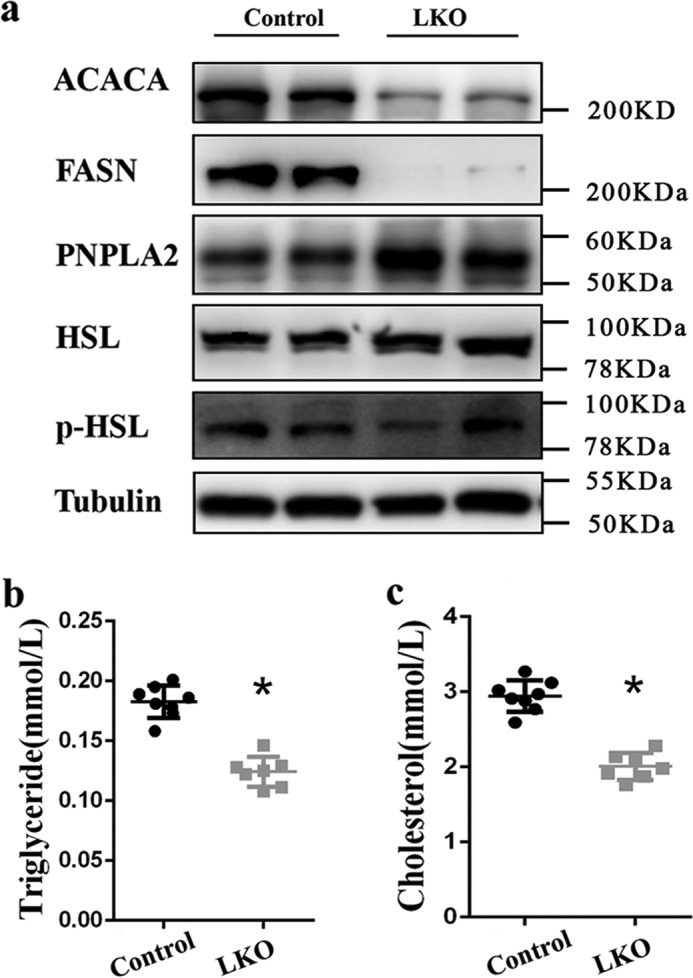
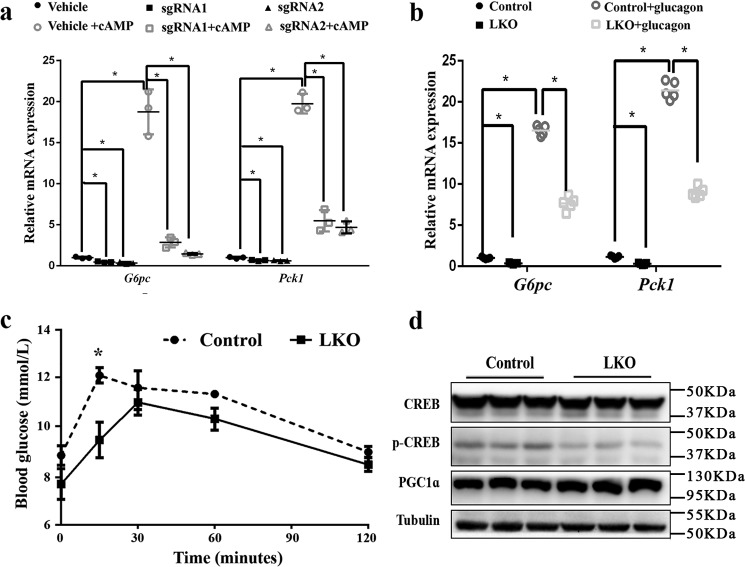
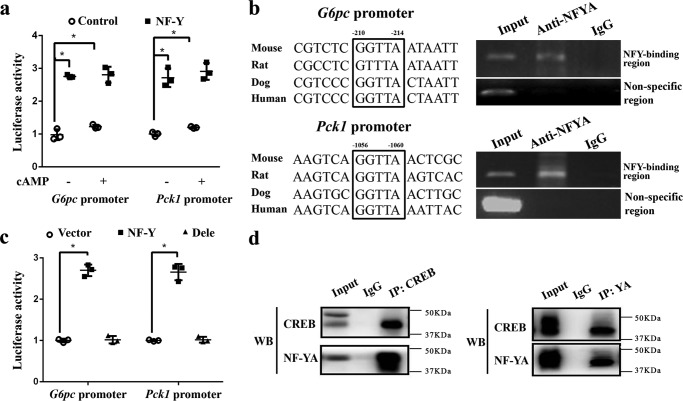
Hepatic gluconeogenesis is essential to maintain blood glucose levels, and its abnormal activation leads to hyperglycemia and type 2 diabetes. However, the molecular mechanisms in the regulation of hepatic gluconeogenesis remain to be fully defined. In this study, using murine hepatocytes and a liver-specific knockout mouse model, we explored the physiological role of nuclear factor Y (NF-Y) in regulating hepatic glucose metabolism and the underlying mechanism. We found that NF-Y targets the gluconeogenesis pathway in the liver. Hepatic NF-Y expression was effectively induced by cAMP, glucagon, and fasting in vivo Lentivirus-mediated NF-Y overexpression in Hepa1-6 hepatocytes markedly raised the gluconeogenic gene expression and cellular glucose production compared with empty vector control cells. Conversely, CRISPR/Cas9-mediated knockdown of NF-Y subunit A (NF-YA) attenuated gluconeogenic gene expression and glucose production. We also provide evidence indicating that CRE-loxP-mediated, liver-specific NF-YA knockout compromises hepatic glucose production. Mechanistically, luciferase reporter gene assays and ChIP analysis indicated that NF-Y activates transcription of the gluconeogenic genes Pck1 and G6pc, by encoding phosphoenolpyruvate carboxykinase (PEPCK) and the glucose-6-phosphatase catalytic subunit (G6Pase), respectively, via directly binding to the CCAAT regulatory sequence motif in their promoters. Of note, NF-Y enhanced gluconeogenesis by interacting with cAMP-responsive element-binding protein (CREB). Overall, our results reveal a previously unrecognized physiological function of NF-Y in controlling glucose metabolism by up-regulating the gluconeogenic genes Pck1 and G6pc Modulation of hepatic NF-Y expression may therefore offer an attractive therapeutic approach to manage type 2 diabetes.

Keywords: CREB; G6Pase; PEPCK; diabetes; gene knockout; glucagon; gluconeogenesis; mouse; nuclear factor Y; transcription regulation.


Conflict of interest statement

The authors declare that they have no conflicts of interest with the contents of this article

Figures

Figure 1.
Figure 1.
Induction of NF-Y expression in liver in response to the glucagon-cAMP axis and fasting. a and b, Hepa1-6 mouse hepatocytes were stimulated with different concentration (0, 1, 10, and 20 μm) of 8-Br-cAMP. a, mRNA expression levels of NF-Y subunits and gluconeogenic genes were measured by qRT-PCR. b, NF-YA protein levels were determined by Western blotting. c, C57BL/6 mice (n = 5/group) were challenged for 1 h with 300 μg/kg body weight glucagon; hepatic mRNA expressions of NF-Y subunit genes were analyzed by RT-qPCR. d, C57BL/6 mice (n = 5/group) fed ad libitum, fasted for 24 h, or fasted for 24 h and then refed for 24 h. Hepatic mRNA expression levels of NF-Y subunits and gluconeogenic genes were measured by RT-qPCR. The data represent means ± S.D. of three independent experiments. *, p < 0.05 versus vehicle treatment.
Figure 2.
Figure 2.
NF-Y regulates gluconeogenesis gene expression and glucose metabolism. a–c, Hepa1-6 cells were transfected with lentivirus vectors to express all three subunits of NF-Y simultaneously or empty vector control (pLVX) and then selected stable cells with 1.5 μg/ml puromycin. Expression of gluconeogenic gene mRNAs (a) and proteins (b) were induced, and glucose production (c) was stimulated in NF-Y over expression stable cells. d–f, NF-YA knockout by the CRISPR-Cas9 system in Hepa1-6 cells. Stable cells were selected with 1.5 μg/ml puromycin. Expression of gluconeogenic genes mRNAs (d) and proteins (e) were down-regulated, and glucose production (f) was reduced in NF-YA knockout stable cells. The protein and mRNA levels of the indicated genes were assayed by Western blotting and real-time PCR, respectively. Glucose production from pyruvate and lactate in Hepa1-6 cells were assayed as described under “Materials and Methods.” The values are means ± S.D. of three independent experiments. *, p < 0.05 versus control (unpaired Student's t test).
Figure 3.
Figure 3.
Metabolic characteristics of Nf-ya LKO mice. LKO mice were generated by crossing Nf-ya flox/flox mice with albumin-Cre transgenic mice, CRE-negative Nf-ya flox/flox animals mice were used as control. a, schematic of the Nf-ya gene showing exons 3–8 flanked by two loxP sites indicated as triangles and the subsequent excision of exons 3–8 by Cre-mediated gene recombination. Vertical thick bars show relative locations of exons. b–d, body weight (b), the total body fat percentage (c), and the ratio of liver weight/body-weight (d) of 10-week-old male mice fed with normal chow diet. e–g, blood glucose levels (e), serum glucagon levels (f), and serum insulin levels (g) of these mice under overnight fasting conditions (n = 5–10 for each group). h, PAS staining of hepatic glycogens in the livers of Nf-ya LKO and WT control male mice (magnification, 100×). i, quantitative enzymatic analysis of hepatic glycogen in the livers of Nf-ya LKO and WT control male mice (n = 4–6 mice/group). The values are expressed as means ± S.D. *, p < 0.05 versus control (unpaired Student's t test).
Figure 4.
Figure 4.
Liver-specific deletion of Nf-ya suppresses the hepatic gluconeogenic program. 10-week-old male mice fed with normal chow diet (n = 4–6 mice/group). a, real-time PCR analysis showing hepatic mRNA expressions of Nf-ya, Nf-yb, Nf-yc, and gluconeogenic gene. b, Western blotting analysis showing hepatic NF-YA, NF-YB, NF-YC, and gluconeogenic protein levels. c, pyruvate-tolerance test showing glucose production in response to pyruvate challenge. The mice were fasted for 16 h and intraperitoneally injected with sodium pyruvate (2 g/kg body weight). After injection, blood glucose was monitored at the designated time points. d, the areas under the curves (AUC) were calculated. e, glucose production (glucose output) was measured in the culture medium of primary hepatocytes isolated from Nf-ya LKO and littermate control mice. The values are expressed as means ± S.D. *, p < 0.05 versus control (unpaired Student's t test).
Figure 5.
Figure 5.
Effects of hepatic Nf-ya knockout on lipogenesis. 10-week-old male mice fed with normal chow diet (n = 4–6 mice/group). a, Western blotting analysis showing hepatic expression of lipogenic genes including ACACA and FASN (also known as ACC1 and FAS, respectively) and lipolytic genes including PNPLA2 (also known as ATGL), HSL, and its phosphorylation status (p-HSL). b and c, overnight fasting levels of triglyceride (b) and cholesterol (c). The data are means ± S.D. *, p < 0.05 versus control (unpaired Student's t test).
Figure 6.
Figure 6.
Glucagon sensitivity was attenuated in the absence of NF-Y. a, real-time PCR analysis of mRNA levels of G6pc and Pck1 in Hepa1-6 mouse hepatocytes infected with recombinant lentivirus containing Nf-ya sgRNA1 or sgRNA2 or in the presence or absence of 8-Br-cAMP (10 μm). b and c, overnight fasted 10-week-old male mice were injected intraperitoneally with glucagon (300 μg/kg) 15 min after intraperitoneal injection of somatostatin (10 mg/kg) (n = 4–6 mice/group). b, real-time PCR analysis of hepatic mRNA levels of G6pc and Pck1 in WT control and Nf-ya LKO mice. c, a glucagon challenge was performed to assess liver glucagon sensitivity. Glucagon increased glucose levels over time to a much lower degree in Nf-ya LKO mice relative to control mice. d, Western blotting analysis measured the hepatic protein levels of CREB, CREB phosphorylation (p-CREB), and PGC-1 in 10-week-old male mice fed a normal chow diet (n = 4–6 mice/group). The data are means ± S.D. *, p < 0.05 in unpaired Student's t test.
Figure 7.
Figure 7.
NF-Y forms complex with CREB and interacts with gluoconeogenic promoter directly. a, luciferase assay using HEK293 cells transiently transfected with G6pc (left symbols) or Pck1 (right symbols) luciferase construct together with expression vectors for Nf-ya, Nf-yb, and Nf-yc or in the presence or absence of 8-Br-cAMP (10 μm). The values are means ± S.D. of three independent experiments. *, p < 0.05 versus control (unpaired Student's t test). b, occupancy of Nf-ya on distinctive its binding site gluoconeogenic promoters. Left panel, location of NF-YA–binding site (GGTTA) on G6pc or Pck1 promoter. Right panel, ChIP assay showing a binding of NF-Y on G6pc (top panels) or Pck1 promoter (bottom panels). c, luciferase assay using HEK293 cells transiently transfected with WT or GGTTAT-motif deleted G6pc/Pck1 luciferase reporter constructs together with expression vectors for Nf-ya, Nf-yb, and Nf-yc. Vector, empty vector + WT G6pc/Pck1-luciferase; NF-Y, NF-Y + WT G6pc/Pck1-luciferase; Dele, NF-Y + deleted G6pc/Pck1-luciferase (GGTTA motif deleted). The values are means ± S.D. of three independent experiments. *, p < 0.05 in unpaired Student's t test. d, coimmunoprecipitation (IP) assay showing endogenous interaction between CREB and NF-Y in Hepa1-6 hepatocyte. Representative Western blotting (WB) analysis is shown. Left panel, NF-Y was precipitated by using CREB antibody. Right panel, CREB was precipitated by using NF-Y antibody.

Comment in

Similar articles

Cited by

References

    1. Petersen M. C., Vatner D. F., and Shulman G. I. (2017) Regulation of hepatic glucose metabolism in health and disease. Nat. Rev. Endocrinol. 13, 572–587 10.1038/nrendo.2017.80 - DOI - PMC - PubMed
    1. Moore M. C., Coate K. C., Winnick J. J., An Z., and Cherrington A. D. (2012) Regulation of hepatic glucose uptake and storage in vivo. Adv. Nutr. 3, 286–294 10.3945/an.112.002089 - DOI - PMC - PubMed
    1. Farhy L. S., and McCall A. L. (2015) Glucagon: the new “insulin” in the pathophysiology of diabetes. Curr. Opin. Clin. Nutr. Metab. care 18, 407–414 10.1097/MCO.0000000000000192 - DOI - PubMed
    1. Kuo T., McQueen A., Chen T. C., and Wang J. C. (2015) Regulation of glucose homeostasis by glucocorticoids. Adv. Exp. Med. Biol. 872, 99–126 10.1007/978-1-4939-2895-8_5 - DOI - PMC - PubMed
    1. Rizza R. A. (2010) Pathogenesis of fasting and postprandial hyperglycemia in type 2 diabetes: implications for therapy. Diabetes 59, 2697–2707 10.2337/db10-1032 - DOI - PMC - PubMed

Publication types

MeSH terms

LinkOut - more resources