. 2018 Apr 27;293(17):6497-6516.
doi: 10.1074/jbc.M117.811190. Epub 2018 Mar 12.

The transpeptidase PbpA and noncanonical transglycosylase RodA of Mycobacterium tuberculosis play important roles in regulating bacterial cell lengths

Affiliations

The transpeptidase PbpA and noncanonical transglycosylase RodA of Mycobacterium tuberculosis play important roles in regulating bacterial cell lengths

Divya Arora et al. J Biol Chem. .

Abstract

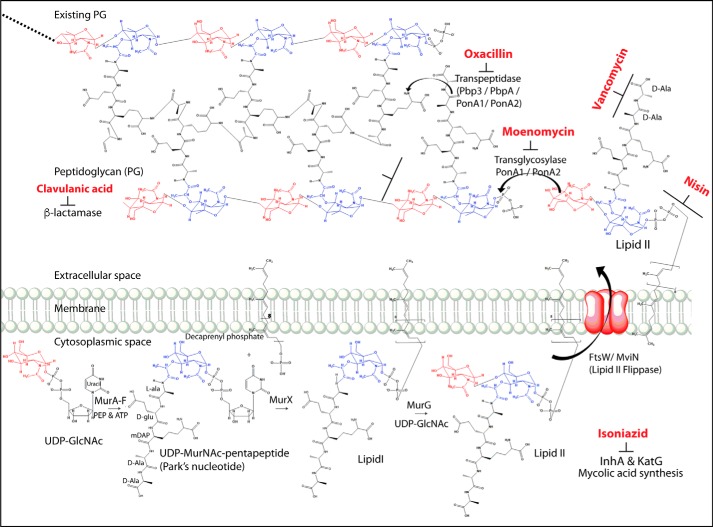
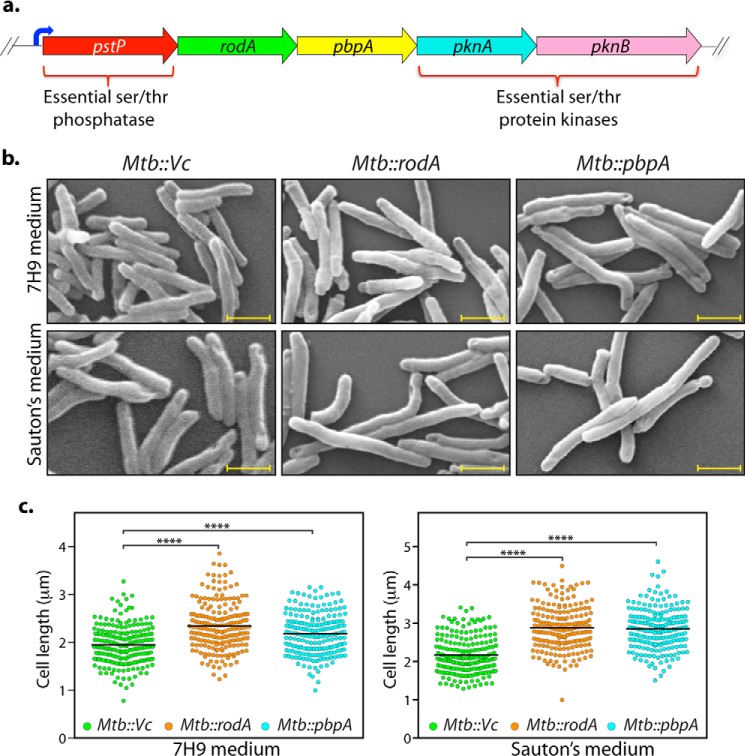
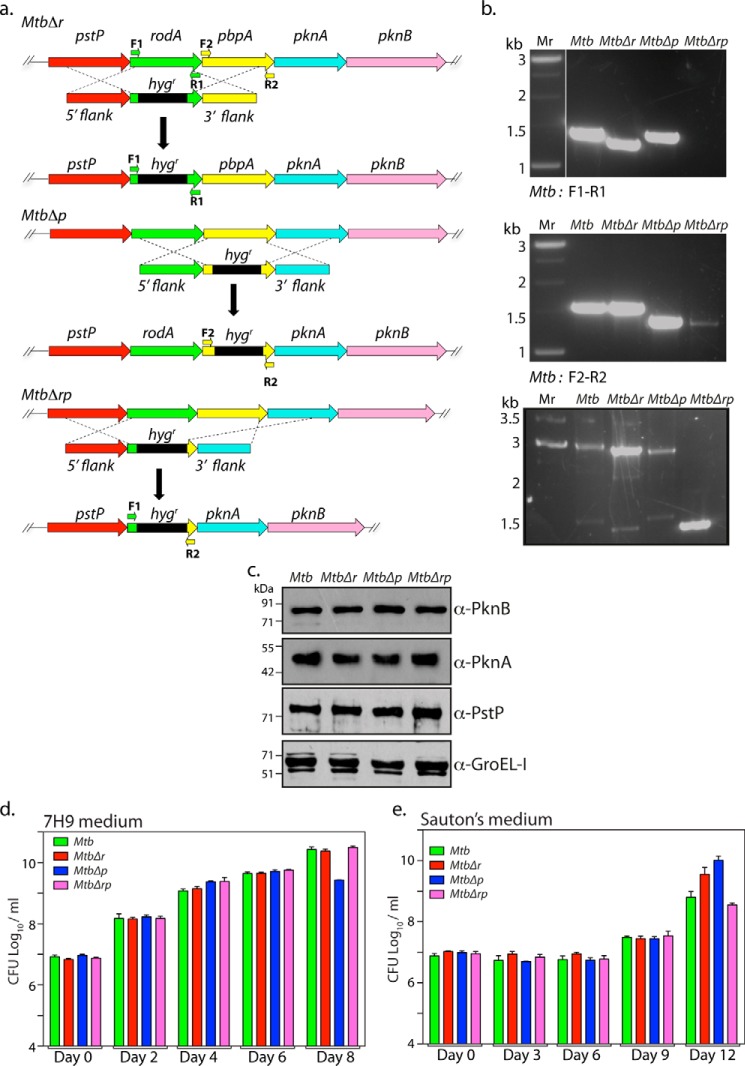
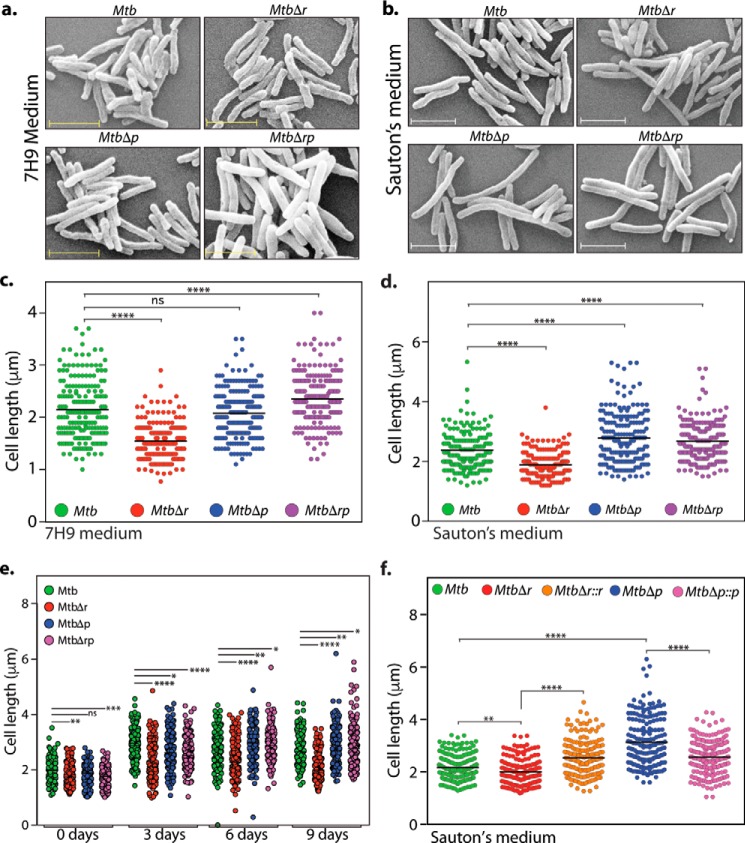
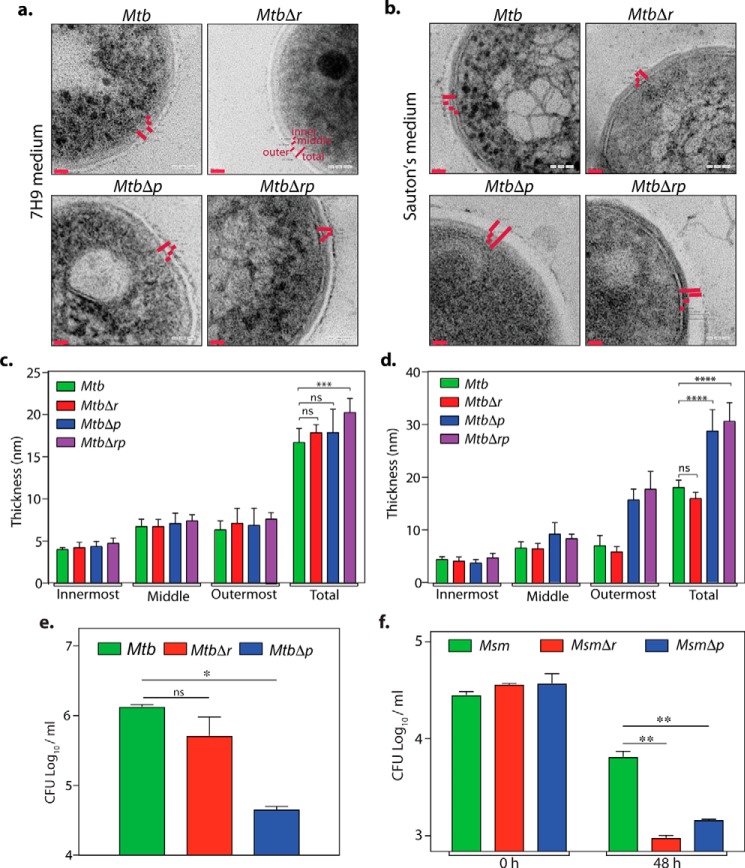
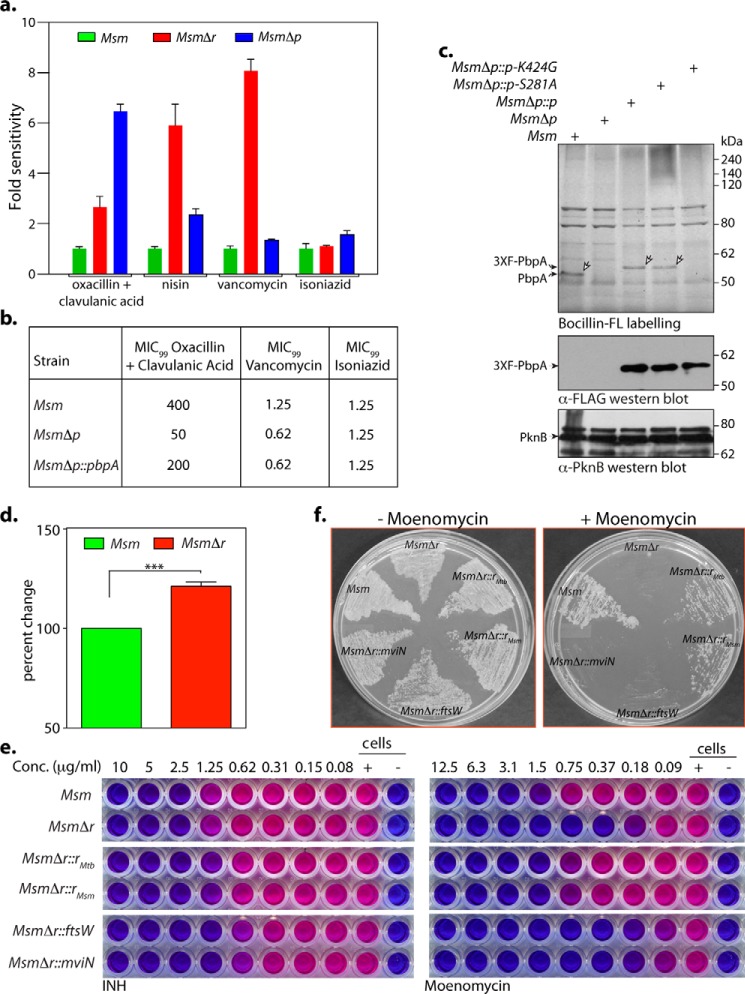
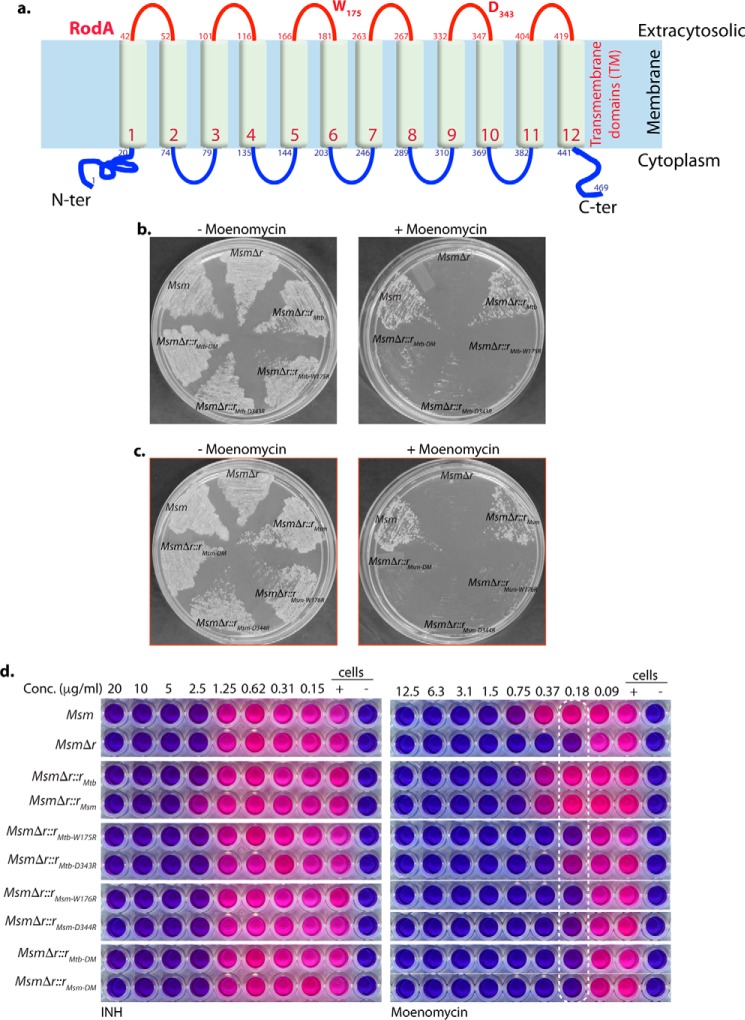
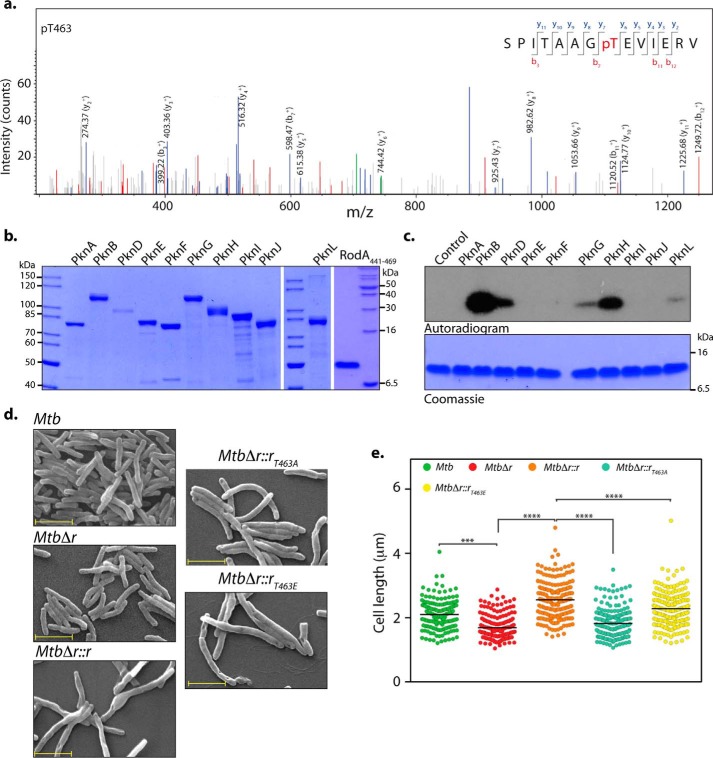
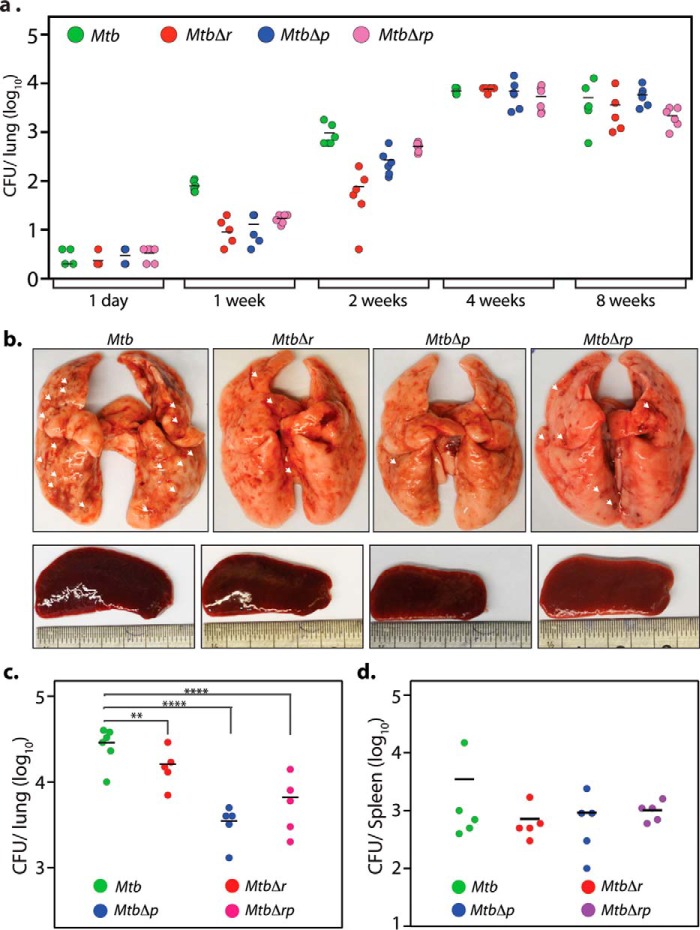
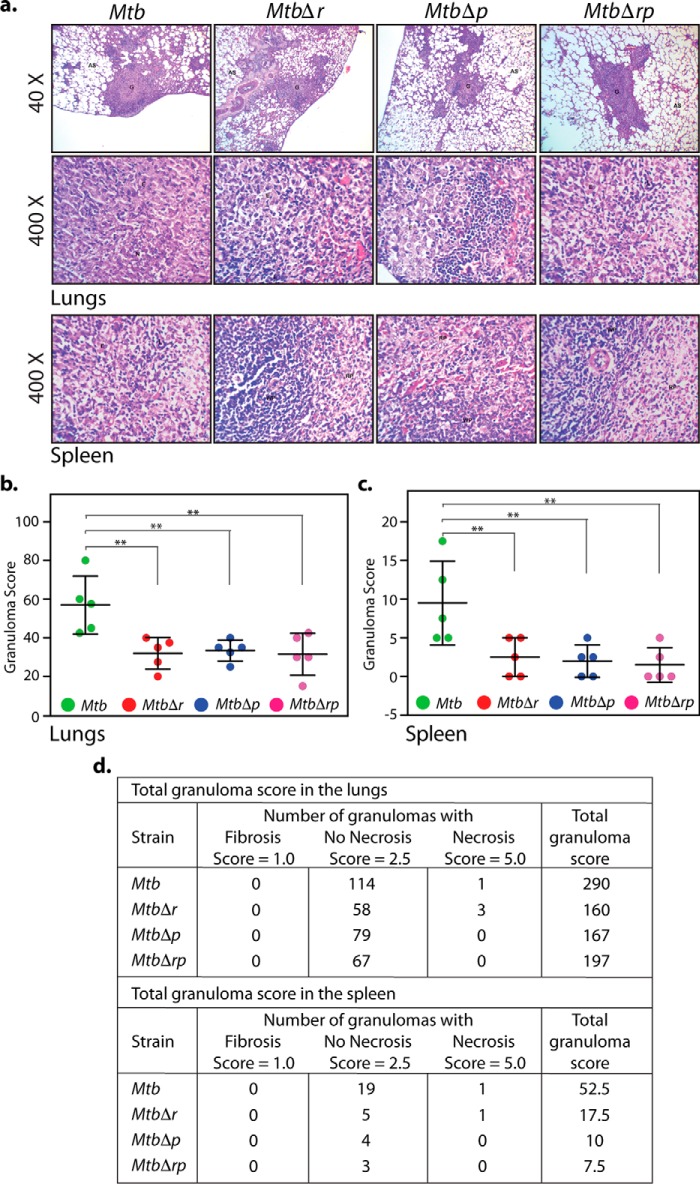
The cell wall of Mycobacterium tuberculosis (Mtb) is a complex structure that protects the pathogen in hostile environments. Peptidoglycan (PG), which helps determine the morphology of the cell envelope, undergoes substantial remodeling under stress. This meshwork of linear chains of sugars, cross-linked through attached peptides, is generated through the sequential action of enzymes termed transglycosylases and transpeptidases. The Mtb genome encodes two classical transglycosylases and four transpeptidases, the functions of which are not fully elucidated. Here, we present work on the yet uncharacterized transpeptidase PbpA and a nonclassical transglycosylase RodA. We elucidate their roles in regulating in vitro growth and in vivo survival of pathogenic mycobacteria. We find that RodA and PbpA are required for regulating cell length, but do not affect mycobacterial growth. Biochemical analyses show PbpA to be a classical transpeptidase, whereas RodA is identified to be a member of an emerging class of noncanonical transglycosylases. Phosphorylation of RodA at Thr-463 modulates its biological function. In a guinea pig infection model, RodA and PbpA are found to be required for both bacterial survival and formation of granuloma structures, thus underscoring the importance of these proteins in mediating mycobacterial virulence in the host. Our results emphasize the fact that whereas redundant enzymes probably compensate for the absence of RodA or PbpA during in vitro growth, the two proteins play critical roles for the survival of the pathogen inside its host.

Keywords: Lipid II; Mycobacterium tuberculosis; PbpA; RodA; bacterial pathogenesis; cell division; cell wall; peptidoglycan; transglycosylase; transpeptidase.


Conflict of interest statement

The authors declare that they have no conflicts of interest with the contents of this article

Figures

Figure 1.
Figure 1.
Schematic diagram depicting the enzymes catalyzing multiple steps of the peptidoglycan biosynthesis pathway and the stages at which PG biosynthesis inhibitors act. The pathway was drawn with the help of ChemDraw Ultra version 12.0 software.
Figure 2.
Figure 2.
Overexpression of RodA and PbpA leads to cell elongation in Mtb. a, pictorial representation of the operon encoding rodA and pbpA. Upstream serine/threonine phosphatase (pstp) and downstream serine/threonine kinase genes (pknA and pknB) are indicated. b, fresh cultures of Mtb::Vc (vector control), Mtb::rodA, or Mtb::pbpA were seeded at an initial A600 of 0.1 in either 7H9 (top) or Sauton's medium (bottom) in the presence of 100 ng/ml anhydrotetracycline, and cells were allowed to grow for 6 days at 37 °C at 100 rpm and fixed. Morphology of Mtb::Vc, Mtb::rodA, and Mtb::pbpA was observed through scanning EM at ×20,000. Scale bar, 1.0 μm. c, quantification of cell lengths in Mtb::Vc, Mtb::rodA, and Mtb::pbpA strains (n ∼200) from cells grown in 7H9 medium (left) or Sauton's medium (right). Mean cell lengths obtained were 1.9 μm (Mtb::Vc), 2.34 μm (Mtb::rodA), and 2.18 μm (Mtb::pbpA) in 7H9 medium and 2.1 μm (Mtb::Vc), 2.8 μm (Mtb::rodA), and 2.8 μm (Mtb::pbpA) in Sauton's medium. Cell lengths were measured independently using Smart Tiff software and plotted as a scattered dot plot with mean values using GraphPad Prism version 6. The experiments were biologically and technically repeated three times. Statistical analysis was performed with the help of a one-way ANOVA test. ****, p < 0.0001.
Figure 3.
Figure 3.
Generation of rodA, pbpA, and rodA-pbpA gene replacement mutants in Mtb. a, schematic depiction of the strategy used for the generation of gene deletion mutants. Primers used for the PCR confirmation are indicated. b, genomic DNA was isolated from log cultures of WT and mutants, and PCRs were performed with a defined set of primers (as indicated). Lane 1, Mr 1-kb ladder; lane 2, Mtb; lane 3, MtbΔr; lane 4, MtbΔp; lane 5, MtbΔrp. The expected sizes for the F1 and R1 pair were as follows: Mtb, 1410 bp; MtbΔr, 1300 bp; MtbΔp, 1410 bp; MtbΔrp, 0. The expected sizes for the F2 and R2 pairs were as follows: Mtb, 1476 bp; MtbΔr, 1476 bp; MtbΔp, 1300 bp; MtbΔrp, 0. The expected sizes for the F1 and R2 pairs were as follows: Mtb, 2886 bp; MtbΔr, 2726 bp; MtbΔp, 2660 bp; MtbΔrp, 1300 bp. c, Western blot analysis to detect polarity effects in deletion mutants Mtb, MtbΔr, MtbΔp, and MtbΔrp strains. Strains were grown to an A600 of 0.8–1.0, and WCLs were resolved and probed with α-PstP, α-PknA, α-PknB, and α-GroEL-I antibodies. d and e, Mtb, MtbΔr, MtbΔp, and MtbΔrp strains were inoculated at A600 ∼0.1 in 7H9 or Sauton's medium, and growth was monitored as bacterial survival by cfu enumeration at the indicated time points for 7H9 (d) and Sauton's medium (e). The experiment was performed in triplicate, and the results were plotted using GraphPad Prism version 6. Error bars, S.D.
Figure 4.
Figure 4.
RodA and PbpA play independent roles in modulating bacterial cell length. a and b, fresh cultures of Mtb, MtbΔr, MtbΔp, and MtbΔrp were seeded at an initial A600 of 0.1 and grown for 6 days at 37 °C at 100 rpm in 7H9 or Sauton's medium followed by fixation. Morphology of the cells was observed through scanning EM at ×20,000 for 7H9 (a) and Sauton's medium (b). Scale bar, 2.0 μm. c, quantification of cell lengths (n ∼200) of Mtb, MtbΔr, MtbΔp, and MtbΔrp strain cells grown in 7H9 medium was performed. Cell lengths were measured independently using Smart Tiff software and plotted by a scatter dot plot with mean values using GraphPad Prism version 6. Mean cell lengths obtained were as follows: Mtb, 2.1 μm; MtbΔr, 1.5 μm; MtbΔp, 2.0 μm; MtbΔrp, 2.3 μm. The experiments were biologically and technically repeated twice. Cell lengths were analyzed using GraphPad Prism version 6, and statistical analysis was performed using a one-way ANOVA test. ****, p < 0.0001; ***, p < 0.001; ns, not significant. d, quantification of cell lengths in Mtb, MtbΔr, MtbΔp, and MtbΔrp strain (n ∼200) cells grown in Sauton's medium was performed, and mean cell lengths obtained were as follows: Mtb, 2.3 μm; MtbΔr, 1.8 μm; MtbΔp, 2.7 μm; MtbΔrp, 2.6 μm. The experiments were biologically and technically repeated twice. Cell lengths were measured independently using Smart Tiff software and plotted by a scattered dot plot with mean values using GraphPad Prism version 6, and the statistical analysis was performed with a one-way ANOVA test. ****, p < 0.0001; ***, p < 0.001. e, fresh cultures of Mtb, MtbΔr, MtbΔp, and MtbΔrp were seeded at an initial A600 of 0.1 and grown at 37 °C at 100 rpm in Sauton's medium followed by fixation at different time points (days 0, 3, 6, and 9) of growth, and cell lengths were measured as described above. Mean cell lengths obtained for different time points were as follows: day 0: Mtb, 1.98 μm; MtbΔr, 1.80 μm; MtbΔp, 1.84 μm; and MtbΔrp, 1.76 μm; day 3: Mtb, 2.87 μm; MtbΔr, 2.26 μm; MtbΔp, 2.69 μm; and MtbΔrp, 2.62 μm; day 6: Mtb, 2.72 μm; MtbΔr, 2.32 μm; MtbΔp, 2.92 μm; and MtbΔrp, 2.90 μm; and day 9: Mtb, 2.71 μm; MtbΔr, 2.0 μm; MtbΔp, 2.91 μm; and MtbΔrp, 2.88 μm. Cell lengths were analyzed using GraphPad Prism version 6, and statistical analysis was performed using a one-way ANOVA test. ****, p < 0.0001; ***, p < 0.001; **, p < 0.01; ns, not significant. f, fresh cultures of Mtb, MtbΔr, MtbΔr::r, MtbΔp, or MtbΔp::p were seeded at an initial A600 of 0.1 in Sauton's medium and continued to grow for 6 days in the presence of 0.1 μm IVN, and cells were fixed and processed for SEM. Cell lengths were observed through SEM at ×20,000. Cell lengths were measured as described above. Obtained mean cell lengths were as follows: Mtb, 2.1 μm; MtbΔr, 1.9 μm; MtbΔr::r, 2.5 μm; MtbΔp, 3.1 μm; MtbΔp::p, 2.5 μm. Statistical analysis was performed using a two-way ANOVA test; ****, p < 0.0001; **, p < 0.01.
Figure 5.
Figure 5.
Deciphering the roles of rodA and pbpA in mycobacterial cell fitness. a–d, TEM analysis of Mtb rodA and pbpA deletion mutants in 7H9 (a and c) or Sauton's medium (b and d). Fresh cultures of Mtb, MtbΔr, MtbΔp, and MtbΔrp were seeded at an initial A600 of 0.1 and grown for 6 days at 37 °C at 100 rpm in 7H9 or Sauton's medium followed by fixation. Fixed cells were processed for TEM, and cell wall architecture was observed at 200 kV, ×50,000 in 7H9 (a) and Sauton's medium (b). c and d, quantification of cell wall thickness in MtbΔr, MtbΔp, MtbΔrp strains (n = 6–7) grown in 7H9 medium (mean cell wall thickness: Mtb, MtbΔr, and MtbΔp, 17 nm; MtbΔrp, 20.2 nm) (c) or Sauton's medium (mean cell wall thickness: Mtb, 18 nm; MtbΔr, 15.9 nm; MtbΔp, 28.7 nm; MtbΔrp, 30.6 nm) (d). Cell wall thickness was measured independently using SmartTiff software and analyzed using GraphPad Prism version 6, and statistical analysis was performed using a two-way ANOVA test. ****, p < 0.0001; ***, p < 0.001. Red bars, cell wall thickness. e and f, hypoxia and persisters analysis for Mtb and Msm deletion mutants. e, bacterial survival analysis of day 42 posthypoxia (Wayne model) for Mtb, MtbΔr, and MtbΔp. Results were plotted using GraphPad prism version 6. Error bar, S.D. Statistical analysis was performed using a two-tailed test. *, p < 0.05. Similar results were obtained in two independent experiments performed in duplicates. f, persisters analysis of Msm, MsmΔr, and MsmΔp. Cultures were grown until exponential phase and treated with 10 μg/ml isoniazid for 48 h, and cfu obtained before and after isoniazid treatment were plotted. Statistical analysis was performed using a two-tailed test. **, p < 0.005. Error bars, S.D. Similar results were obtained in two independent experiments performed in triplicates.
Figure 6.
Figure 6.
RodA functions as a noncanonical transglycosylase and PbpA as a classical transpeptidase. a, MIC analysis of Msm, MsmΔr, and MsmΔp was performed as described under “Experimental procedures.” The graph presents the -fold difference with respect to Msm in (cfu × MIC) values obtained for MsmΔr and MsmΔp. The experiment was performed in triplicate. b, MIC99 analysis for MsmΔp complementation studies. Shown is a tabular representation of MIC99 values obtained upon a REMA performed with Msm, MsmΔp, and MsmΔp::p strains in Dubo's medium for oxacillin + clavulanic acid, vancomycin, and isoniazid. c, membrane fractions were prepared from cultures of Msm, MsmΔp, MsmΔp::p MsmΔp::pS281A, and MsmΔp::pK424G induced with 5 μm IVN. ∼20 μg of membrane was incubated with Bocillin-FL and resolved on 8% SDS-PAGE, and Bocillin-labeled proteins were detected using a Typhoon scanner. A similar amount of membrane extracts were processed for immunoblot analysis. Bands corresponding to endogenous PbpA and episomal 3X-FLAG-PbpAwt/mut are indicated. d, Msm and MsmΔr strains grown in Sauton's medium until A600 ∼0.2–0.3 were pulsed with [3H]mDAP, and equal amounts of cultures were processed for small-scale Lipid II accumulation analysis. Radiolabeled [3H]Lipid II in the samples was quantified. The reading obtained for Msm in each independent experiment was normalized to 100%, and the counts obtained for MsmΔr are represented as percentage change with respect to counts obtained for Msm. The experiment was performed in biological triplicates. Statistical analysis was performed using a two-tailed test. ***, p < 0.0005. e, REMA for Msm, MsmΔr, MsmΔr::rmtb, MsmΔr::rmsm, MsmΔr::ftsW, and MsmΔr::mviN for isoniazid and moenomycin. The experiment was performed in triplicate, and a representative data set is shown. f, growth analysis of Msm, MsmΔr, MsmΔr::rmtb, MsmΔr::rmsm, MsmΔr::ftsW, and MsmΔr::mviN, streaked on 7H11 in the presence or absence of 1 μg/ml moenomycin. The experiment was performed in triplicate, and a representative data set is shown.
Figure 7.
Figure 7.
Amino acid residues critical for noncanonical transglycosylase function are conserved in mycobacterial RodA. a, schematic depicting the organization of RodA across the membrane. Both the amino and carboxyl termini are predicted to be inside the cytoplasm with 12 transmembrane domains by TMHMM. Residues suggested to be critical for transglycosylase activity, Trp-175 and Asp-343, are marked. b, growth analysis of Msm, MsmΔr, MsmΔr::rMtb, MsmΔr::rMtb-W175R, MsmΔr::rMtb-D343R, and MsmΔr::rMtb-DM, streaked on 7H11 plates in the presence or absence of 1 μg/ml moenomycin. c, growth analysis of Msm, MsmΔr, MsmΔr::rMsm, MsmΔr::rMsm-W176R, MsmΔr::rMsm-D344R, and MsmΔr::rMsm-DM, streaked on 7H11 plates in the presence or absence of 1 μg/ml moenomycin. d, REMA assay for Msm, MsmΔr, MsmΔr::rMtb, MsmΔr::rMsm, MsmΔr::rMtb-W175R, MsmΔr::rMtb-D343R, MsmΔr::rMsm-W176R, MsmΔr::rMsm-D344R, and MsmΔr::rMtb-DM, and MsmΔr::rMsm-DM for isoniazid and moenomycin. The experiment was performed in triplicates, and a representative data set is shown.
Figure 8.
Figure 8.
RodA is phosphorylated on Thr-463 residue. a, MS/MS spectrum of precursor m/z: 761.88025 (+2) and MH+: 1522.75322 Da, of the phosphopeptide SPITAAGpTEVIERV (where pT represents phosphothreonine). The location of Thr-463 was evident by the presence of ion series containing y6, y7, b3, b7, and y8–11 in the spectra. b, Coomassie-stained purified MBP-STPKs and His-FLAG-RodA(411–469). c, an in vitro kinase assay was performed with 10 pmol of MBP-STPKs and 312 pmol of His-FLAG-RodA(411–469). Samples were resolved on 15% SDS-PAGE, stained with Coomassie (bottom), and autoradiographed (top). d, fresh cultures of Mtb, MtbΔr, MtbΔr::r, MtbΔr::rT463A, or MtbΔr::rT463E were seeded at an initial A600 of 0.1 in 7H9 medium and continued to grow for 6 days in the presence of 100 ng of anhydrotetracycline, followed by fixation. SEM was performed to analyze the morphology of the cells (×20,000). Scale bar, 2 μm. e, cell lengths of ∼200 individual cells for each sample were quantified. Mean cell lengths for the samples were 2.1 μm (Mtb), 1.6 μm (MtbΔr), 2.5 μm (MtbΔr::r), 1.8 μm (MtbΔr::rT463A), and 2.2 μm (MtbΔr::rT463E). Similar results were obtained in a biological replicate. Statistical analysis was performed using a one-way ANOVA test; ****, p < 0.0001; ***, p < 0.001.
Figure 9.
Figure 9.
RodA and PbpA are important for pathogen survival in the host. a, 5 mice/group/time point were aerosolically infected with 200 cfu/lung of Mtb, MtbΔr, MtbΔp, and MtbΔrp strains. cfu were enumerated in the lungs of infected mice after day 1 (4 mice/group), 1, 2, 4, and 8 weeks (5 mice/group) postinfection. b–d, 5 guinea pigs/group/time point were infected with Mtb, MtbΔr, MtbΔp, and MtbΔrp strains, and animals were sacrificed at 4 weeks postinfection. b, representative images for gross assessment of lungs and spleen from infected guinea pigs 4 weeks postinfection. Discrete tubercles in the lungs are shown with white arrows. c and d, cfu enumeration from the infected lungs (c) and spleen (d). Mean cfu values in the lungs of guinea pigs (c) infected with Mtb, MtbΔr, MtbΔp, and Mtbrp were 4.51, 4.2, 3.54, and 3.81 on the log10 scale, respectively. Statistical analysis was performed using a one-way ANOVA test. ****, p < 0.0001; **, p < 0.01. Mean cfu values in the spleens of guinea pigs (d) infected with Mtb, MtbΔr, MtbΔp, and Mtb were 3.44, 3.41, 3.39, and 3.54 on the log10 scale, respectively.
Figure 10.
Figure 10.
RodA and PbpA mutants show compromised granulomatous pathology in the host. a, representative ×40 and ×400 images (top) of H&E-stained lung sections obtained from guinea pigs infected with Mtb, MtbΔr, MtbΔp, or MtbΔrp at 4 weeks postinfection. Shown are ×400 images (bottom) of H&E-stained spleen sections obtained from guinea pigs infected with Mtb, MtbΔr, MtbΔp, or MtbΔrp at 4 weeks postinfection. G, granuloma; AS, alveolar spaces; FC, foamy histiocytic cells. b–d, granuloma score analysis; scatter plot of the granuloma scores obtained (calculated as described under “Experimental procedures”) of all animals for H&E-stained lung (b) and spleen (c) sections of guinea pigs. Each data point represents the score of an individual animal (n = 5). Statistical analysis was performed using a one-way ANOVA test. **, p < 0.01. d, tabular presentation of granuloma scores of H&E-stained lung and spleen sections for each group showing types of granuloma observed, calculation of granuloma score, and the total granuloma score obtained 4 weeks postinfection.

Similar articles

Cited by

References

    1. Barry C. E., Crick D. C., and McNeil M. R. (2007) Targeting the formation of the cell wall core of M. tuberculosis. Infect. Disord. Drug Targets 7, 182–202 10.2174/187152607781001808 - DOI - PMC - PubMed
    1. Kaur D., Guerin M. E., Skovierová H., Brennan P. J., and Jackson M. (2009) Chapter 2: Biogenesis of the cell wall and other glycoconjugates of Mycobacterium tuberculosis. Adv. Appl. Microbiol. 69, 23–78 10.1016/S0065-2164(09)69002-X - DOI - PMC - PubMed
    1. Bansal-Mutalik R., and Nikaido H. (2014) Mycobacterial outer membrane is a lipid bilayer and the inner membrane is unusually rich in diacyl phosphatidylinositol dimannosides. Proc. Natl. Acad. Sci. U.S.A. 111, 4958–4963 10.1073/pnas.1403078111 - DOI - PMC - PubMed
    1. Barry C. E. 3rd, Boshoff H. I., Dartois V., Dick T., Ehrt S., Flynn J., Schnappinger D., Wilkinson R. J., and Young D. (2009) The spectrum of latent tuberculosis: rethinking the biology and intervention strategies. Nat. Rev. Microbiol. 7, 845–855 10.1038/nrmicro2236 - DOI - PMC - PubMed
    1. Boshoff H. I., and Barry C. E. 3rd (2005) Tuberculosis: metabolism and respiration in the absence of growth. Nat. Rev. Microbiol. 3, 70–80 10.1038/nrmicro1065 - DOI - PubMed

Publication types

MeSH terms

LinkOut - more resources