. 2018 Apr 4;38(14):3571-3583.
doi: 10.1523/JNEUROSCI.2081-17.2018. Epub 2018 Mar 12.

Cereblon Maintains Synaptic and Cognitive Function by Regulating BK Channel

Affiliations

Cereblon Maintains Synaptic and Cognitive Function by Regulating BK Channel

Tae-Yong Choi et al. J Neurosci. .

Abstract

Mutations in the cereblon (CRBN) gene cause human intellectual disability, one of the most common cognitive disorders. However, the molecular mechanisms of CRBN-related intellectual disability remain poorly understood. We investigated the role of CRBN in synaptic function and animal behavior using male mouse and Drosophila models. Crbn knock-out (KO) mice showed normal brain and spine morphology as well as intact synaptic plasticity; however, they also exhibited decreases in synaptic transmission and presynaptic release probability exclusively in excitatory synapses. Presynaptic function was impaired not only by loss of CRBN expression, but also by expression of pathogenic CRBN mutants (human R419X mutant and Drosophila G552X mutant). We found that the BK channel blockers paxilline and iberiotoxin reversed this decrease in presynaptic release probability in Crbn KO mice. In addition, paxilline treatment also restored normal cognitive behavior in Crbn KO mice. These results strongly suggest that increased BK channel activity is the pathological mechanism of intellectual disability in CRBN mutations.SIGNIFICANCE STATEMENTCereblon (CRBN), a well known target of the immunomodulatory drug thalidomide, was originally identified as a gene that causes human intellectual disability when mutated. However, the molecular mechanisms of CRBN-related intellectual disability remain poorly understood. Based on the idea that synaptic abnormalities are the most common factor in cognitive dysfunction, we monitored the synaptic structure and function of Crbn knock-out (KO) animals to identify the molecular mechanisms of intellectual disability. Here, we found that Crbn KO animals showed cognitive deficits caused by enhanced BK channel activity and reduced presynaptic glutamate release. Our findings suggest a physiological pathomechanism of the intellectual disability-related gene CRBN and will contribute to the development of therapeutic strategies for CRBN-related intellectual disability.

Keywords: BK channels; CRBN; intellectual disability; neurotransmitter release; presynaptic.


Conflict of interest statement

The authors declare no competing financial interests.

Figures

Figure 1.
Figure 1.
Crbn KO mice have normal brain architecture and spine morphology. A, Nissl stains of WT and Crbn KO whole brain sections (top) and hippocampus (bottom) at P2 and 3 months. Scale bar, 1 mm (top) and 0.5 mm (bottom). B, Images of primary cultured hippocampal neurons from WT (left) and Crbn KO (right) mice labeled with DiI at 20 DIV (Scale bar, 50 μm). The morphology of the dendritic spines is shown in a high-magnification view in the bottom panel. Scale bar, 10 μm. CE, No differences in total spine density (C), total spine head-width (D), or total spine length (E) were seen between WT and Crbn KO neurons. F, No differences in spine densities of the different morphological categories (mushroom, thin, stubby, or branched types) were seen between WT and Crbn KO neurons. n = 37 WT neurons; n = 28 Crbn KO neurons. All data shown are mean ± SEM. n.s., Not significant by independent Student's t test.
Figure 2.
Figure 2.
Basal synaptic transmission in SC-CA1 synapses and synaptic protein profiles of Crbn KO mice hippocampus. A, Left, representative traces of evoked EPSCs (eEPSCs) and evoked IPSCs (eIPSCs) recorded with holding potentials of −70 and 0 mV in hippocampal SC-CA1 synapses from WT (black trace) or Crbn KO (red trace) mice. Right, input/output relationship of eEPSCs (middle) or eIPSCs (right) from WT (black bar) and Crbn KO mice (red bar). Crbn KO mice showed reduced eEPSC amplitudes than WT mice, but eIPSCs were similar between two groups. n = 21, 3 (21 cells from 3 WT mice); n = 20, 3 (KO). B, Representative traces (left), amplitude (middle), and frequency (right) of AMPAR-mEPSCs in hippocampal CA1 pyramidal neurons of WT (black trace) and Crbn KO mice (red trace). Amplitude and frequency of AMPAR-mEPSCs were not significantly different between WT and Crbn KO mice. n = 19, 4 WT; n = 20, 5 KO. C, Representative traces (left), amplitude (middle), and frequency (right) of mIPSCs in hippocampal CA1 pyramidal neurons of WT (black trace) and KO mice (red trace). Amplitude and frequency of mIPSCs were not significantly different between WT and Crbn KO mice. n = 27, 3 WT; n = 22, 3 KO. D, Hippocampal homogenates from 3- to 5-week-old WT and Crbn KO mice were immunoblotted to evaluate the levels of several synaptic proteins. All protein signals were normalized relative to β-actin levels before comparisons between genotypes were made. Synapsin I was increased and vGAT was decreased significantly in Crbn KO mice, but the expression levels of other synaptic proteins were similar between two groups. n = 4 WT; n = 5 KO. All data shown are mean ±SEM. **p < 0.01; *p < 0.05. n.s., Not significant by independent Student's t test.
Figure 3.
Figure 3.
Crbn KO mice exhibit normal long-term synaptic plasticity in hippocampal SC-CA1 synapses. A, B, No differences were seen in LTP in hippocampal SC-CA1 synapses from 3- to 5-week-old Crbn KO mice; NMDAR-dependent early-phase TBS-LTP (n = 27 cells from 7 WT mice; n = 28 cells from 8 Crbn KO mice, compared with last 10 min average after tetanic stimulation) (A) and L-LTP induced by four repeated HFS (HFS × 4) with 5 min intervals (n = 11, 7 (WT); n = 9, 6 (KO) compared with last 10 min average after tetanic stimulation) (B). C, No differences in NMDAR-dependent TBS-LTP in hippocampal SC-CA1 synapses from 10- to 12-weeks old WT and Crbn KO mice (n = 13, 8 WT; n = 10, 5 KO compared with last 10 min average after tetanic stimulation). D, E, No differences in long-term depression in hippocampal SC-CA1 synapses from 3- to 4-week-old Crbn KO mice; NMDAR-dependent LFS-LTD (n = 13, 3 WT; n = 8, 4 KO) compared with last 10 min average after tetanic stimulation (D) and group I mGluR-dependent LTD (mGluR-LTD) induced by 10 min bath-application of 100 μm (R,S)-3,5-DHPG (n = 7, 3 WT; n = 6, 2 KO compared with last 10 min average after tetanic stimulation) E, Left, fEPSP slope was plotted before and after stimulation. Middle, Sample traces represent fEPSPs at 1 min before (gray is WT, pink is KO) and 1 or 3 (only for L-LTP experiment) h after (black is WT, red is KO) conditioning stimulation. Right, Magnitudes of long-term synaptic plasticity were calculated by comparing the average slopes of fEPSPs recorded during the last 10 min with those recorded before stimulation. All data shown are mean ± SEM. n.s., Not significant by independent Student's t test.
Figure 4.
Figure 4.
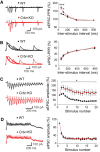
Excitatory, but not inhibitory, presynaptic neurotransmitter release is reduced in hippocampal SC-CA1 synapses of Crbn KO mice. A, B, Left, Representative traces of PPR of eEPSCs (A) or eIPSCs (B) in hippocampal SC-CA1 synapses from WT (black trace) or Crbn KO mice (red trace). Right, eEPSC-PPR or eIPSC-PPR was plotted against ISIs. n = 13, 2 WT; n = 15, 3 KO (for the eEPSC-PPR experiment), n = 12, 2 WT; n = 12, 2 KO (for the eIPSC-PPR experiment). eEPSC-PPR was increased in Crbn KO mice and eIPSC-PPR was similar between two groups. C, D, Left, Representative traces of altered 20-pulse train stimulation-induced responses of eEPSCs (C) or eIPSCs (D) in hippocampal SC-CA1 synapses from WT (black trace) or Crbn KO mice (red trace). Right, Relative amplitudes of eEPSCs or eIPSCs were plotted against stimulus number. STP in excitatory synaptic transmission induced by 20 pulses at 20 Hz stimulation was increased in Crbn KO mice (second ∼ 20th stimulus, *p < 0.05). n = 8, 2 WT; n = 8, 2 KO for the eEPSC-STP experiment; n = 13, 2 WT; n = 12, 2 KO for the eIPSC-STP experiment; ***p < 0.001.
Figure 5.
Figure 5.
Drosophila Crbn mutants have decreased probability of neurotransmitter release. A, Domain structures of human CRBN and its Drosophila ortholog with percentage identity between their corresponding domains. CRBN C-like domain is shown in dark yellow. The single asterisks denote substitution mutations of CRBN used in this study. B, Genomic map of Drosophila CRBN locus. The exons of CRBN are indicated by boxes and the coding regions are colored black. The 1160 bp deleted regions (3R10048848∼10050008) for CRBN null mutants (CRBNex1) are also presented. C, Genomic PCR analyses in WT WT, heterozygous CRBN mutants (CRBNex1/+) using the C primer set in B. D, qRT-PCR analysis for CRBN using the D primer set in B. E, Representative confocal images of anti-HRP labeled Drosophila Crbn mutants third-instar larval NMJ 6/7. Scale bar, 50 μm. Quantification of total bouton number as a percentage of the control. n = 9 WT; n = 8 (CRBNex1/Df). F, Spontaneous mEJCs of the NMJ synapses in Drosophila Crbn mutant. Representative traces (left), mEJC amplitude (middle), and mEJC frequency (right). n = 12 WT; n = 17 CRBNex1/Df. G, eEJC in Crbn mutant. Representative traces (left) and eEJC amplitude (right). n = 12 WT; n = 15 (CRBNex1/Df). H, Decreased PPR in Crbn mutant larvae. Representative traces (left) and PPR is plotted against indicated ISIs (right). n = 15 WT; n = 11 CRBNex1/Df. I, STP induced by 20-pulse train stimulation in Crbn mutant flies. Representative traces (left) and the amplitudes of eEJCs are plotted against stimulus number (right). n = 20 WT; n = 11 CRBNex1/Df; ***p < 0.001.
Figure 6.
Figure 6.
Decreased probability of neurotransmitter release in Drosophila Crbn mutants is not rescued by the overexpression of the pathogenic CRBN mutant. A, Representative traces (left) of spontaneous mEJCs in the following genotypes: C155-GAL4/+ (control), C155-GAL4/+; UAS-Myc-CRBNWT/+; CRBNex1/Df (CRBN WT rescue) and C155-GAL4/+; UAS-Myc-CRBNG552X/+; CRBNex1/Df (CRBN GX rescue). Mean amplitude (middle) and frequency (right) of spontaneous mEJCs are shown. n = 11 control; n = 8 CRBN-WT rescue; n = 18 CRBN-GX rescue. B, Representative eEJC traces (left) and mean amplitude of eEJCs (right) in CRBN rescue animals. n = 11 control; n = 8 CRBN-WT rescue; n = 18 CRBN-GX rescue. C, Overexpression of CRBN WT rescued the increased PPR (10 and 25 ms ISI) at Crbn mutant synapses but CRBN GX did not. Representative traces (left) and PPR is plotted against indicated ISIs (right). n = 11 control; n = 8 CRBN-WT rescue; n = 18 CRBN-GX rescue. D, 20-pulse train stimulation-induced STP at Crbn mutant synapses is rescued by presynaptic CRBN-WT expression but not by CRBN-GX. Representative traces (left) and the amplitudes of eEJCs are plotted against stimulus number (right). n = 10 control; n = 8 CRBN-WT rescue; n = 15 CRBN-GX rescue. All data shown are mean ± SEM. ***p < 0.001; **p < 0.01; *p < 0.05. n.s., Not significant by independent Student's t test.
Figure 7.
Figure 7.
Reduced excitatory presynaptic function in Crbn KO mice is rescued by a BK channel blocker. A, Increased IK(Ca) in hippocampal CA1 pyramidal neurons in Crbn KO mice were selectively reduced by paxilline (a pan-BK channel blocker, 10 μm). n = 29, 3 (29 cells from 3 animals) for WT mice with vehicle (WT + vehicle); n = 17, 3 for KO mice with vehicle (KO + vehicle); n = 29, 3 (WT + paxilline); n = 29, 3 (KO + paxilline). B, Increased surface expression of BK channels in Crbn KO mice. Hippocampal slices prepared from WT and Crbn KO mice were used for steady-state biotinylation of surface BK channels. Input (10%) of total lysates are shown on the left and the biotinylated surface BK channels are shown on the right. Actin was used as a control. Quantification of surface BK channel levels in WT and Crbn KO mice. Data are normalized to WT and presented as mean ± SEM. n = 4, **p < 0.01 (on independent Student's t test). C, Paxilline (10 μm) negates the increased PPR (50 ms inter stimulus interval) at Crbn KO SC-CA1 synapses. n = 15, 3 WT + vehicle; n = 16, 3 KO + vehicle; n = 14, 3 WT + paxilline; n = 16, 3 KO + paxilline. D, Paxilline (10 μm) restores increased activity-dependent plasticity during repetitive stimulation (20 pulses at 20 Hz) at Crbn KO SC-CA1 synapses. n = 20, 5 WT + vehicle; n = 16, 6 KO + vehicle; n = 13, 3 WT + paxilline; n = 11, 3 KO + paxilline. E, Iberiotoxin (100 nm) negates the increased PPR (50 ms interstimulus interval) at Crbn KO SC-CA1 synapses. n = 12, 2 WT + vehicle; n = 14, 2 KO + vehicle; n = 18, 2 WT + iberiotoxin; n = 17, 2 KO + iberiotoxin. F, Iberiotoxin (100 nm) restores increased activity-dependent plasticity during repetitive stimulation (20 pulses at 20 Hz) at Crbn KO SC-CA1 synapses. n = 14, 2 WT + vehicle; n = 16, 2 KO + vehicle; n = 18, 2 WT + iberiotoxin; n = 21, 2 KO + iberiotoxin; *p < 0.05; ***p < 0.001 or ###p < 0.001.
Figure 8.
Figure 8.
Human R419X CRBN expression rescue decreased the probability of release in Crbn KO mice. A, Representative images of WT and Crbn KO neurons. Primary cultured hippocampal neurons were transfected with cytosol GFP (EGFP only) and fixed 14∼20 DIV. B, Representative IK(Ca) traces in untransfected (black) and transfected (red) hippocampal neurons cultured from Crbn KO mice. Overexpression of CRBN WT reduced the increased IK(Ca) in hippocampal cultured neurons in Crbn KO mice but overexpression of CRBN R419X did not. n = 11 untransfected Crbn KO cells; n = 9 WT CRBN transfected Crbn KO cells (WT-Rescue); n = 11 untransfected Crbn KO cells; n = 10 R419X CRBN transfected Crbn KO cells (R419X-Rescue). C, Left, Representative traces of vG-pH response to 100 AP stimuli from WT, Crbn KO, WT-Rescue, and R419X-Rescue neurons (normalized to the NH4 Cl peak signal). Right, Mean value of 100 AP response from WT (n = 8 cells), Crbn KO (n = 8 cells), WT-Rescue (n = 7 cells), and R419X-Rescue (n = 7 cells). ***p < 0.001. D, Representative fields of vG-pH fluorescence images at rest, ΔF100, and NH4Cl application from WT, Crbn KO, WT-Rescue, and R419X-Rescue, respectively. E, Left, Representative traces of vG-pH response to 20 AP stimuli at 100 Hz to discriminate readily releasable pool (RRP). The arrow indicates a short plateau representing RRP position (Ariel and Ryan, 2010). Right, Mean RRP size from WT (5.64 ± 1.28; n = 7 cells), Crbn KO (5.23 ± 0.68; n = 6 cells), WT-Rescue (5.84 ± 0.64; n = 7 cells), and R419X-Rescue (5.94 ± 0.61; n = 7 cells).
Figure 9.
Figure 9.
Paxilline treatment rescued abnormal cognitive behaviors in Crbn KO mice. A, Paxilline treatment rescued the abnormal behavior of Crbn KO mice in the passive avoidance test. n = 7 WT with vehicle; n = 6 KO with vehicle; n = 7 WT with paxilline; n = 6 KO with paxilline. B, Paxilline treatment rescued the abnormal behavior of Crbn KO mice in the novel object recognition test. Left, Exploration time. Right, Discrimination index. n = 8 WT with vehicle; n = 8 KO with vehicle; n = 8 WT with paxilline; n = 8 KO with paxilline. C, Paxilline treatment did not affect the hyperanxious behavior of Crbn KO mice in the EPM test. Left, Time spent in the open arm. Right, Time spent in the closed arm. n = 9 WT with vehicle; n = 9 KO with vehicle; n = 8 WT with paxilline; n = 8 KO with paxilline. All data are presented as mean ± SEM. ***p < 0.001, **p < 0.01, *p < 0.05, n.s., not significant for comparisons within genotype; n.s., not significant for comparisons within treatment by two-way ANOVA with Holm–Sidak's multiple-comparisons test.

Comment in

Similar articles

Cited by

References

    1. Aizawa M, Abe Y, Ito T, Handa H, Nawa H (2011) mRNA distribution of the thalidomide binding protein cereblon in adult mouse brain. Neurosci Res 69:343–347. 10.1016/j.neures.2010.12.019 - DOI - PubMed
    1. Aoki T, Baraban SC (2000) Properties of a calcium-activated K+ current on interneurons in the developing rat hippocampus. J Neurophysiol 83:3453–3461. 10.1152/jn.2000.83.6.3453 - DOI - PubMed
    1. Ariel P, Ryan TA (2010) Optical mapping of release properties in synapses. Front Neural Circuits 4: pii: 18. 10.3389/fncir.2010.00018 - DOI - PMC - PubMed
    1. Bartlett JB, Dredge K, Dalgleish AG (2004) The evolution of thalidomide and its IMiD derivatives as anticancer agents. Nat Rev Cancer 4:314–322. 10.1038/nrc1323 - DOI - PubMed
    1. Bhakar AL, Dölen G, Bear MF (2012) The pathophysiology of fragile X (and what it teaches us about synapses). Annu Rev Neurosci 35:417–443. 10.1146/annurev-neuro-060909-153138 - DOI - PMC - PubMed

Publication types

MeSH terms